 Open Access Article
Creative Commons Attribution 3.0 Unported Licence
Novel persistent phosphors of lanthanide–chromium co-doped yttrium aluminum gallium garnet: design concept with vacuum referred binding energy diagram†
Jian
Xu
,
Jumpei
Ueda
and
Setsuhisa
Tanabe
*
Graduate School of Human and Environmental Studies, Kyoto University, Kyoto 606-8501, Japan. E-mail: tanabe.setsuhisa.4v@kyoto-u.ac.jp; Tel: +81-75-753-6832
First published on 21st April 2016
Abstract
We have developed Pr3+–Cr3+ and Tb3+–Cr3+ co-doped Y3Al2Ga3O12 (YAGG) persistent phosphors with orange (Pr3+) and light green (Tb3+) persistent luminescence. The duration of their persistent luminance (of 0.32 mcd m−2) can last up to about 8 h and 12 h, respectively. On the other hand, the persistent luminescence intensities of Nd3+–Cr3+ and Dy3+–Cr3+ co-doped YAGG samples are much weaker than those of the Pr3+–Cr3+ and Tb3+–Cr3+ co-doped ones, and the dominant persistent luminescence is mainly due to the deep-red transition of Cr3+. The mechanisms of different persistent luminescence behaviors of these four samples can be explained by the vacuum referred binding energy (VRBE) diagram of lanthanide ions in the YAGG host. The stability of hole traps at the ground states of Pr3+, Nd3+, Tb3+ and Dy3+ ions and the possibility to collaborate with Cr3+ electron traps to induce persistent luminescence are discussed in detail.
1. Introduction
Persistent luminescence (PersL), also denoted as “glow-in-the-dark”, is a specific type of luminescence that can last for seconds, minutes or even hours, usually at room temperature (RT), after ceasing excitation sources.1–3 It has been over 20 years since the new generation green persistent phosphor, SrAl2O4:Eu2+–Dy3+ (SAO:Eu–Dy) was reported and successfully commercialized for safety signage applications, such as emergency exit signs in buildings and guiding strips in the aisles of airplanes.4–10 Until now, despite the fast development and considerable research on persistent phosphors after this significant discovery, the detailed mechanism of PersL is still an open question. The most acceptable mechanism can be qualitatively explained by an electron trapping–detrapping process as follows: when persistent phosphors are excited by ultraviolet (UV) light (visible light in rare cases), electron–hole (e–h) pairs are generated and the excited electrons, through the conduction band (CB), are captured by electron traps; this process is usually called the trapping process. The stored electrons are then released by thermal stimulation to the CB (detrapping process) and re-combined with holes, resulting in PersL. During a series of processes, “trap depth”, which represents the energy gap between the bottom of the CB and the electron trap, is crucial since it determines the behavior of PersL, such as initial emission intensity and luminescence duration. The nature of electron traps, such as type, distribution, and energy level location has been extremely well studied; however, there are few reports concerning the role of the other re-combination part, the hole.11–14 Similar to electron traps whose energy levels are located below the bottom of the CB, the energy levels of hole traps should also be located above the top of the valence band (VB). Therefore, the determination or even prediction of the energy levels of the doping ions in a host, whether they can be selected as electron traps and/or hole traps, is definitely important for designing novel persistent phosphors.Recently, we reported garnet persistent phosphors of Ce3+,Cr3+ co-doped Y3Al5−xGaxO12 (YAGG:Ce–Cr), in which Cr3+ acts as an efficient electron trap with ideal trap depth at x = 3 for Ce3+ PersL at RT.15–17 The enhanced persistent luminance of the YAGG:Ce–Cr (x = 3) transparent ceramic persistent phosphor at 60 min after ceasing blue excitation could reach 88 mcd m−2, which is over three times higher than that of the compacted pellet made of commercial SAO:Eu–Dy powder (25 mcd m−2).18 On the other hand, we also developed Cr3+ singly-doped YAGG (YAGG:Cr) persistent phosphors with a similar garnet matrix showing deep-red PersL (∼690 nm), in which Cr3+ ions act both as emitting centers and trap centers.19,20 The persistent radiance (in units of mW sr−1 m−2) of the optimized composition (x = 3) was even higher than that of the ZnGa2O4:Cr3+ persistent phosphor, which is widely used for in vivo bio-imaging applications.3,21–25
2. Choice of lanthanide candidates in the YAGG host
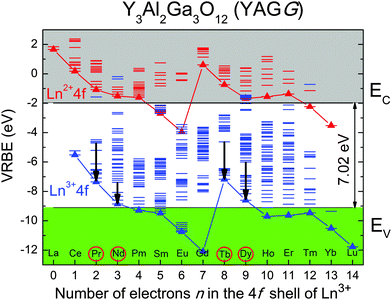
The successful discovery of these Cr3+ singly- and co-doped YAGG persistent phosphors15,19 motivated us to design improved ones with the help of theoretical predictions, especially the energy level locations of lanthanide ions in a specific host, due to their wide adoption as emission centers and/or trap centers for PersL. Vacuum referred binding energy (VRBE) diagrams of 15 lanthanides, proposed by Dorenbos,26–32 provide a strong predicting power since the characteristic variation in electron and hole trapping depths of lanthanide ions is given by the shapes of the two zigzag curves representing the ground states of divalent and trivalent lanthanide ions. The zigzag shapes of the two curves remain almost unchanged in different hosts, due to the shielding effect of 5s2 and 5p6 orbitals on the 4f orbitals. Once the binding energy of the ground state for one lanthanide ion relative to the CB or VB is determined, those of the 4f levels of all other lanthanides can be estimated fairly well by constructing this diagram.According to the VRBE diagram of the YAGG host16 shown in Fig. 1, besides Ce3+, there are four other trivalent lanthanides (Pr3+, Nd3+, Tb3+, Dy3+) whose ground states are located above the top of the VB, indicating that they can be selected as potential candidates for hole traps. Therefore, in this work, Pr3+–Cr3+, Nd3+–Cr3+, Tb3+–Cr3+, Dy3+–Cr3+ co-doped YAGG phosphors were prepared and their feasibility for PersL are discussed based on this diagram.
3. Experimental section
Transparent ceramics of Y2.985Pr0.015Al1.999Cr0.001Ga3O12 (YAGG:Pr–Cr), Y2.97Nd0.03Al1.999Cr0.001Ga3O12 (YAGG:Nd–Cr), Y2.97Tb0.03Al1.999Cr0.001Ga3O12 (YAGG:Tb–Cr), and Y2.985Dy0.015Al1.999Cr0.001Ga3O12 (YAGG:Dy–Cr) were fabricated by a solid-state reaction method and vacuum sintering. Y2O3, Al2O3, Ga2O3 Pr6O11, Nd2O3, Tb4O7 and Dy2O3 with 4N purity, and Cr2O3 with 3N purity were used as raw materials. The starting powder was mixed by the ball milling method, with anhydrous alcohol, for several hours. The powder mixture was dried at 80 °C for 36 h and compacted to form a ceramic green body [ϕ20 mm × (2–3) mm] under uniaxial pressure of 50 MPa, and finally sintered at 1600–1650 °C for 10–20 h under vacuum. The as-sintered samples were double-mirror polished to a thickness of 1.5 ± 0.1 mm using a copper plate and diamond slurry. The transparent ceramics of Y2.985Ce0.015Al1.999Cr0.001Ga3O12 (YAGG:Ce–Cr)18 and Y3Al1.99Cr0.01Ga3O12 (YAGG:Cr)19 prepared by the same method were used as reference samples. All the as-prepared samples were confirmed to be single phase (ICPDS: No. 089-6660) by XRD measurement (see Fig. S1, ESI†).Photoluminescence (PL) and PersL spectra of the YAGG samples were measured at 25 °C by a Si CCD spectrometer (QE65-Pro, Ocean Optics) and calibrated by a standard halogen lamp (SCL-600, Labsphere). A 300 W Xe-lamp (MAX-302, Asahi Spectra) with a UV mirror module (250–400 nm) was used as the excitation source for thermoluminescence (TL) two-dimensional (2D) plot measurements (see the schematic illustration of measurement setup in Fig. S2, ESI†). The ceramic sample was set in a cryostat (Helitran LT3, Advanced Research Systems) to control the temperature and firstly illuminated by UV light at 150 K for 10 min, then heated up to 550 K at a rate of 10 K min−1 at 10 min after ceasing the illumination. The TL signals were recorded by a PMT detector (R11041, Hamamatsu Photonics & Co. Ltd,) covered with 350 nm short-cut and 750 nm long-cut filters. The CCD spectrometer was operated simultaneously with the TL measurement to monitor the emission spectra at different temperatures. All persistent luminescence decay curves of the samples, after being excited for 5 min by the Xe-lamp with the UV module, were measured at 25 °C using the same PMT detector. The decay curves were then calibrated to the absolute intensity (luminance, in units of mcd m−2) using a radiance meter (Glacier X, B&W Tek Inc.). Photographs of the samples were taken with a digital camera (EOS kiss X5, Canon) under the same setting conditions: exposure time – 0.1 s, ISO value – 1600, aperture value (F value) – 5.0.
4. Results
4.1. PL and PersL spectra
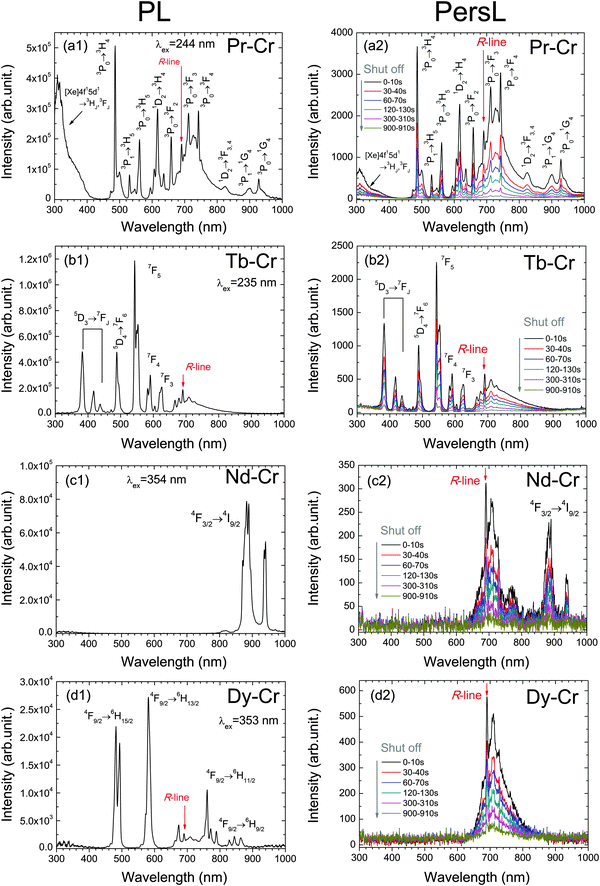
Fig. 2(a1)–(d1) show the PL spectra of the YAGG:Ln–Cr (Ln = Pr, Tb, Nd, Dy) phosphors excited by their respective excitation wavelengths. The typical f–f transitions due to Pr3+: 3PJ → 3H4,5, 1D2 → 3H4; Tb3+: 5D3, 5D4 → 7FJ; Nd3+: 4F3/2 → 4I9/2 and Dy3+: 4F9/2 → 6H15/2, 6H13/2, 6H11/2, 6H9/2 were observed in YAGG:Pr–Cr, YAGG:Tb–Cr, YAGG:Nd–Cr and YAGG:Dy–Cr samples, respectively. Besides, Cr3+ luminescence bands were also observed in the YAGG:Pr–Cr and YAGG:Tb–Cr samples since the excitation wavelengths for Pr3+ (244 nm) and Tb3+ (235 nm) match well with the excitation band of Cr3+: 4A2(4F) → 4T1(4P). However, the excitation wavelengths for Nd3+ (354 nm) and Dy3+ (353 nm) did not match the excitation bands of Cr3+;19,20 therefore, the typical Cr3+ bands, including “R-line”: 2E(2G) → 4A2(4F) and its phonon sidebands (PSBs), were not observed in the YAGG:Nd–Cr sample, but still existed in the YAGG:Dy–Cr sample. This is mainly attributed to the energy transfer from Dy3+: 4F9/2 to Cr3+: 4T2(4F) followed by R-line luminescence of Cr3+.After ceasing the UV (250–400 nm) excitation, the corresponding PersL spectra of the four YAGG persistent phosphors were recorded at different times, shown in Fig. 2(a2)–(d2). The shapes of the PL and PersL spectra are nearly identical in the YAGG:Pr–Cr and YAGG:Tb–Cr samples, suggesting that the emission centers due to Pr3+ and Tb3+ are the same under and after excitation. However, the PersL spectra of the YAGG:Nd–Cr and YAGG:Dy–Cr samples are quite different from their PL spectra, in which PersL from Cr3+ is mainly dominant, and their PersL intensities are much weaker than those of the YAGG:Pr–Cr and YAGG:Tb–Cr samples.
4.2. Persistent luminescence decay curves
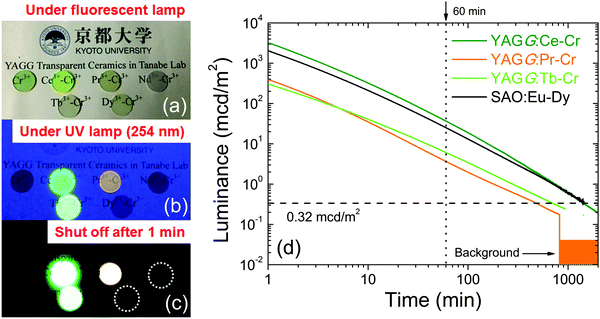
Fig. 3(a)–(c) show the photographs of YAGG:Ln–Cr (Ln = Ce, Pr, Nd, Tb, Dy) transparent ceramic persistent phosphors together with one reference sample, YAGG:Cr, under and after UV (254 nm) excitation. All the samples show optical transparency, through which the letters below the samples can be clearly recognized by the naked eye. After ceasing the excitation, Ce–Cr, Pr–Cr, and Tb–Cr co-doped samples exhibit bright PersL due to Ce3+ (green), Pr3+ (orange) and Tb3+ (light green), respectively. The color coordinates of PersL in the CIE 1931 chromaticity diagram are (0.295, 0.553) for YAGG:Ce–Cr, (0.439, 0.367) for YAGG:Pr–Cr, and (0.313, 0.454) for YAGG:Tb–Cr samples (see Fig. S3, ESI†). On the other hand, the Nd–Cr, Dy–Cr co-doped samples [white circles in Fig. 3(c)] showed very weak deep-red PersL (too weak to be recorded by the camera) due to Cr3+, which was also observed in the YAGG:Cr reference sample.The persistent luminescence decay curves (in luminance units) of the YAGG:Pr–Cr and YAGG:Tb–Cr samples, after ceasing UV (250–400 nm) illumination for 5 min, are shown in Fig. 3(d). The decay profiles of the YAGG:Ce–Cr phosphor18 and the compacted pellet made of the SAO:Eu–Dy commercial phosphor (LumiNova-GLL300FFS, Nemoto & Co. Ltd,)15 are also plotted as references. The luminance values at 60 min after ceasing the excitation were 35 mcd m−2 for YAGG:Ce–Cr, 3.7 mcd m−2 for YAGG:Pr–Cr, 6.1 mcd m−2 for YAGG:Tb–Cr and 25 mcd m−2 for SAO:Eu–Dy samples. Persistent luminance durations, to reach a value of 0.32 mcd m−2, were around 1469 min for YAGG:Ce–Cr, 499 min for YAGG:Pr–Cr, and 729 min for YAGG:Tb–Cr samples. Note that the luminance of 0.32 mcd m−2 is the minimum value commonly used by the safety signage industry (about 100 times the sensitivity of the dark-adapted eye).2
4.3. TL glow curves
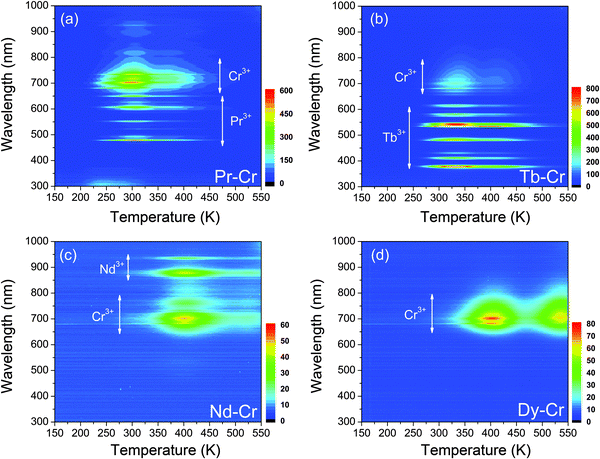
Fig. 4 shows the contour plots (2D mapping) of TL glow curves of the YAGG:Ln–Cr (Ln = Pr, Tb, Nd, Dy) samples in order to see what kind of emission contributes to the TL glow peak at different temperatures. From the plots of the YAGG:Pr–Cr and YAGG:Tb–Cr samples in (a) and (b), it can be seen that at increased temperatures, the TL spectra are simply composed of two luminescence centers from Pr3+/Tb3+ and Cr3+, which agree well with their PersL spectra in Fig. 2(a2) and (b2). The intense TL glow peaks of the two samples are located at around RT so that they can show intense PersL at RT. However, in the Nd–Cr and Dy–Cr co-doped samples given in (c) and (d), the PersL intensities are much weaker than those of the Pr–Cr and Tb–Cr co-doped ones, in which the TL spectra are mainly composed of the broad band luminescence from Cr3+ (origin of PersL from Nd3+ will be discussed later in the next section). Especially for the YAGG:Dy–Cr sample, no sharp f–f transitions of Dy3+ are observed at any temperatures, which indicates that Dy3+ ions do not contribute to the PersL. | ||
| Fig. 4 Wavelength–temperature (λ–T) contour plots of the (a) YAGG:Pr–Cr (b) YAGG:Tb–Cr (c) YAGG:Nd–Cr (d) YAGG:Dy–Cr transparent ceramic persistent phosphors. | ||
5. Discussion
According to the obtained results of the four YAGG:Ln–Cr (Ln = Pr, Nd, Tb, Dy) phosphors, they can be approximately divided into three groups: (i) Pr–Cr and Tb–Cr co-doped samples showing bright PersL mainly from Pr3+ and Tb3+ (ii) Dy–Cr co-doped sample showing weak PersL only from Cr3+. (iii) Nd–Cr co-doped sample showing weak PersL both from Cr3+ and Nd3+.It is worth noting that human eyes are most sensitive to green and yellow emission; less sensitive to violet, blue, and red emission; UV and near-infrared (NIR) emission are totally invisible.33 The photopic vision, which is mediated by the cone cells in human eyes, allows color perception and shows a broad band sensitivity curve (from 380 to 780 nm), which peaks at 555 nm with 683 lm W−1 luminous efficacy. The line emissions due to Pr3+: 3PJ(J=0,1,2) → 3H4,5, 1D2 → 3H4, and Tb3+: 5D4 → 7FJ(J=6,5,4,3) in YAGG:Pr–Cr and YAGG:Tb–Cr samples match well with the sensitivity curve of photopic vision (see Fig. S4, ESI†). However, the luminous efficacy is almost zero in the deep-red to NIR region, so that PersL from Cr3+ is difficult to be captured by human eyes.
In Ln3+–Cr3+ co-doped garnets, the PersL process usually occurs in four steps according to the electron trapping–detrapping model (the charging energy is assumed to be high enough to excite the electron into the CB):
 | (1) |
| Ln3+ + h+ → Ln4+ or (Ln3+ + h+) [hole trapping] | (2) |
| Cr3+ + e− → Cr2+ or (Cr3+ + e−) [electron trapping] |
| Ln4+ or (Ln3+ + h+) + e− → (Ln3+)* [electron de-trapping from Cr2+ or (Cr3+ + e−) leading to Ln3+ in an excited state] | (3) |
| (Ln3+)* → Ln3+ + hν [radiative transition] | (4) |
The above mechanism provides a good explanation for the PersL behaviors of YAGG:Pr–Cr and YAGG:Tb–Cr samples. According to the VRBE diagram of the YAGG host (see Fig. 1), similar to Ce3+,15,16 the ground states of Pr3+(3H4) and Tb3+(7F6) are located above the top of the VB, with a large energy gap (1.78 eV for Pr3+; 1.96 eV for Tb3+). Therefore, the hole created at Pr3+/Tb3+ is difficult to move to the VB when compared with moving a photo-induced electron into the CB at RT. As such, Pr3+/Tb3+ ions can be a stable hole trap (Pr4+/Tb4+ or Pr3+/Tb3+ + h+), collaborating with the Cr3+ electron trap to induce the long PersL. Furthermore, similar to the YAGG:Ce–Cr persistent phosphors,15,16 the PersL behaviors of the YAGG:Pr–Cr and YAGG:Tb–Cr persistent phosphors, such as initial emission intensity, luminescence duration and adapting temperature can also be made tunable by changing the Ga3+ substitution content in the tetrahedral and/or octahedral sites of the YAGG host (taking YAGG:Pr–Cr orange persistent phosphors as an example, see Fig. S5 and Table S1, ESI†).
However, the energy gap between the ground state of Dy3+(6H15/2) and the top of the VB is too small (0.54 eV) as described in the diagram. Once a photo-induced hole is captured by Dy3+, it will immediately escape into the VB so that it is quite difficult to form a stable hole trap at Dy3+ to be form Dy4+ or (Dy3+ + h+) at RT. As a consequence, the re-combination of e–h pairs may occur via a non-radiative approach so that PersL from the (Dy3+)* state is totally quenched (see Fig. 2(d2) and 4d). In this special case, Cr3+ ions take part in the PersL process, since under UV illumination Cr3+ itself can act both as a hole trap center to form Cr4+(Cr3+ + h+) and an electron trap center to form Cr2+(Cr3+ + e−).19 The Cr4+(Cr3+ + h+) ion acts as a re-combination center for the electron that is released from the Cr2+(Cr3+ + e−) trap center, followed by PersL due to Cr3+. Considering the small doping concentration of Cr3+ in this work (0.05 mol%, ten times lower than our previous report19), the observed weak PersL from Cr3+ in the YAGG:Dy–Cr sample is quite reasonable.
The PersL mechanism of the YAGG:Nd–Cr sample is more complicated than for other samples. The ground state of Nd3+(4I9/2) is quite close to the top of the VB (energy gap: 0.29 eV, even smaller than that of Dy3+) in the VRBE diagram. This indicates that Nd3+ cannot work as a stable hole trap to form Nd4+ or (Nd3+ + h+) at RT; however, PersL from Nd3+ is still observed (see Fig. 2(c2) and 4c). This is mainly attributed to the persistent energy transfer from Cr3+ to Nd3+, which is similar to the same process as that in the YAGG host, where it occurs from Ce3+ to Nd3+.34 Since the emission band of the donor (Cr3+) matches well with the absorption band of the acceptor (Nd3+), resonant energy transfer from Cr3+ to Nd3+ takes place, like that in Y3Al5O12 (YAG)35,36 (see Fig. S6, ESI†). Therefore, the persistent energy transfer occurs mainly from Cr3+: 2E(2G) to Nd3+: 4F7/2, which is followed by rapid multi-phonon relaxation down to the 4F3/2 excited level, and finally induces the sharp PersL bands of Nd3+: 4F3/2 → 4IJ located at around 880 nm and longer wavelengths.
6. Conclusions
In summary, based on the VRBE diagram of the YAGG host, Pr3+, Nd3+, Tb3+, Dy3+ ions were selected and co-doped with Cr3+ ions to develop novel persistent phosphors. The energy gaps between the ground states of Pr3+/Tb3+ and the top of the VB are large enough so that Pr3+/Tb3+ ions can form stable hole traps, collaborating with the Cr3+ electron traps to induce long PersL. The duration of the persistent luminance (0.32 mcd m−2) of the YAGG:Pr–Cr and YAGG:Tb–Cr samples due to Pr3+ (orange) and Tb3+ (light green) could reach about 8 h and 12 h, respectively. However, because of the small energy gaps between the ground states of Nd3+/Dy3+ and the top of the VB, Nd3+/Dy3+ ions cannot act as stable hole traps. Therefore, the persistent luminescence intensities of YAGG:Nd–Cr and YAGG:Dy–Cr samples are quite weak and are dominated mainly by the deep-red transition of Cr3+.In this paper, we introduced a way to design novel garnet persistent phosphors, based on the knowledge of the energy level diagram of lanthanide dopants. Since lanthanide ions are widely used as emission centers and/or trap centers for PersL, this theoretical prediction diagram can be a useful guide for choosing the proper lanthanide ions, in a more general and convenient manner, to design new storage phosphors in different matrices.
Acknowledgements
We would like to acknowledge Prof. Pieter Dorenbos from Delft University of Technology, Prof. Bruno. Viana from Chimie-Paris Tech and Prof. Peter A. Tanner from the Hong Kong Institute of Education, who stayed at Kyoto University as visiting professors, for fruitful discussions on persistent phosphors and luminescence mechanisms.References
- K. van den Eeckhout, P. F. Smet and D. Poelman, Materials, 2010, 3, 2536 CrossRef CAS.
- K. van den Eeckhout, D. Poelman and P. F. Smet, Materials, 2013, 6, 2789 CrossRef CAS.
- B. Viana, S. K. Sharma, D. Gourier, T. Maldiney, E. Teston, D. Scherman and C. Richard, J. Lumin., 2016, 170, 879 CrossRef CAS.
- Y. Murayama, N. Takeuchi, Y. Aoki and T. Matsuzawa, US Pat., 5.242.006, 1995 Search PubMed.
- H. Takasaki, S. Tanabe and T. Hanada, J. Ceram. Soc. Jpn., 1996, 104, 322 CrossRef CAS.
- S. Tanabe and T. Hanada, New Ceramics, 1996, 9(10), 27 CAS , in Japanese.
- T. Matsuzawa, Y. Aoki, N. Takeuchi and Y. Murayama, J. Electrochem. Soc., 1996, 143, 2670 CrossRef CAS.
- Y. Aoki, Y. Hirata, H. Sasai, T. Ohishi and N. Takeuchi, Japanese Pat., 208948, 1997 Search PubMed.
- F. Clabau, X. Rocquefelte, S. Jobic, P. Deniard, M. H. Whangbo, A. Garcia and T. Le Mercier, Chem. Mater., 2005, 17, 3904 CrossRef CAS.
- J. Botterman and P. F. Smet, Opt. Express, 2015, 23, A868 CrossRef PubMed.
- K. Chakrabarti, V. K. Mathur, J. F. Rhodes and R. J. Abbundi, J. Appl. Phys., 1988, 64, 1363 CrossRef CAS.
- A. Lecointre, A. Bessière, A. J. J. Bos, P. Dorenbos, B. Viana and S. Jacquart, J. Phys. Chem. C, 2011, 115, 4217 CAS.
- H. Luo, A. J. J. Bos and P. Dorenbos, J. Phys. Chem. C, 2016, 120, 5916 CAS.
- B. Qu, B. Zhang, L. Wang, R. Zhou, X.-C. Zeng and L. Li, ACS Appl. Mater. Interfaces, 2016, 8, 5439 CAS.
- J. Ueda, K. Kuroishi and S. Tanabe, Appl. Phys. Lett., 2014, 104, 101904 CrossRef.
- J. Ueda, P. Dorenbos, A. J. J. Bos, K. Kuroishi and S. Tanabe, J. Mater. Chem. C, 2015, 3, 5642 RSC.
- J. Ueda, J. Ceram. Soc. Jpn., 2015, 123, 1059 CrossRef CAS.
- J. Xu, J. Ueda, K. Kuroishi and S. Tanabe, Scr. Mater., 2015, 102, 47 CrossRef CAS.
- J. Xu, J. Ueda, Y. Zhuang, B. Viana and S. Tanabe, Appl. Phys. Express, 2015, 8, 042602 CrossRef.
- Y. Katayama, B. Viana, D. Gourier, J. Xu and S. Tanabe, Opt. Mater. Express, 2016, 6, 1405 CrossRef.
- A. Bessière, S. Jacquart, K. Priolkar, A. Lecointre, B. Viana and D. Gourier, Opt. Express, 2011, 19(11), 10131 CrossRef PubMed.
- T. Maldiney, A. Bessière, J. Seguin, E. Teston, S. K. Sharma, B. Viana, A. J. J. Bos, P. Dorenbos, M. Bessodes, D. Gourier, D. Scherman and C. Richard, Nat. Mater., 2014, 13, 418 CrossRef CAS PubMed.
- T. Maldiney, B. Ballet, M. Bessodes, D. Scherman and C. Richard, Nanoscale, 2014, 6, 13970 RSC.
- A. Bessière, S. K. Sharma, N. Basavaraju, K. R. Priolkar, L. Binet, B. Viana, A. J. J. Bos, T. Maldiney, C. Richard, D. Scherman and D. Gourier, Chem. Mater., 2014, 26, 1365 CrossRef.
- D. Gourier, A. Bessière, S. K. Sharma, L. Binet, B. Viana, N. Basavaraju and K. R. Priolkar, J. Phys. Chem. Solids, 2014, 75, 826 CrossRef CAS.
- P. Dorenbos, J. Phys.: Condens. Matter, 2003, 15, 8417 CrossRef CAS.
- P. Dorenbos, J. Lumin., 2005, 111, 89 CrossRef CAS.
- P. Dorenbos, J. Electrochem. Soc., 2005, 152, H107 CrossRef CAS.
- P. Dorenbos, J. Mater. Chem., 2012, 22, 22344 RSC.
- P. Dorenbos, J. Lumin., 2013, 134, 310 CrossRef CAS.
- F. T. You, A. J. J. Bos, Q. F. Shi, S. H. Huang and P. Dorenbos, Phys. Rev. B: Condens. Matter Mater. Phys., 2012, 85, 115101 CrossRef.
- A. J. J. Bos, P. Dorenbos, A. Bessière and B. Viana, Radiat. Meas., 2008, 43, 222 CrossRef CAS.
- Y. Zhuang, Y. Katayama, J. Ueda and S. Tanabe, Opt. Mater., 2014, 36, 1907 CrossRef CAS.
- J. Xu, S. Tanabe, A. D. Sontakke and J. Ueda, Appl. Phys. Lett., 2015, 107, 081903 CrossRef.
- A. Ikesue, K. Kamata and K. Yoshida, J. Am. Ceram. Soc., 1995, 78, 2545 CrossRef CAS.
- P. Samuel, G. A. Kumar, T. Yanagitani, H. Yagi, K.-I. Ueda and S. M. Babu, Opt. Mater., 2011, 34, 303 CrossRef CAS.
Footnote |
| † Electronic supplementary information (ESI) available. See DOI: 10.1039/c6tc00802j |
| This journal is © The Royal Society of Chemistry 2016 |


