 Open Access Article
Multiple phase and dielectric transitions on a novel multi-sensitive [TPrA][M(dca)3] (M: Fe2+, Co2+ and Ni2+) hybrid inorganic–organic perovskite family†
J. M.
Bermúdez-García
*a,
M.
Sánchez-Andújar
 a,
S.
Yáñez-Vilar
ab,
S.
Castro-García
a,
R.
Artiaga
c,
J.
López-Beceiro
c,
L.
Botana
d,
A.
Alegría
de and
M. A.
Señarís-Rodríguez
*a
a,
S.
Yáñez-Vilar
ab,
S.
Castro-García
a,
R.
Artiaga
c,
J.
López-Beceiro
c,
L.
Botana
d,
A.
Alegría
de and
M. A.
Señarís-Rodríguez
*a
aQuiMolMat Group, Department of Fundamental Chemistry, Faculty of Science and CICA, University of A Coruña, Campus A Coruña, 15071 A Coruña, Spain. E-mail: j.bermudez@udc.es; m.senaris.rodriguez@udc.es
bDepartment of Applied Physics, University of Santiago de Compostela, 15782 Santiago de Compostela, Spain
cDepartment of Industrial Engineering II, University of A Coruña, Campus Ferrol, 15403 Ferrol, Spain
dMaterial Physical Center, CSIC-UPV/EHU, P. Manuel de Lardizabal 5, 20018 Donostia-San Sebastian, Spain
eMaterial Physical Department, University of the Basque Country, PO Box 1072, 20008 Donostia-San Sebastian, Spain
First published on 14th April 2016
Abstract
The hybrid inorganic–organic [TPrA][M(dca)3] (M: Fe2+, Co2+ and Ni2+) compounds, where TPrA is the tetrapropylammonium cation and dca is the dicyanamide anion, are unique multi-sensitive compounds that display multiple phases and dielectric transitions. These materials exhibit up to three first-order structural transitions (between the polymorphs I, Ia, Ib and II) associated with the same number of dielectric transitions in the temperature range of 210–360 K. The mechanisms responsible for these dielectric responses are found to be novel within the hybrid perovskites, involving ionic displacements of the A-site cations (TPrA) and order/disorder processes of the X anions (dca). In addition, the phase transitions and dielectric transition temperatures can be tuned by applying external hydrostatic pressure or by inducing internal pressure by modifying the tolerance factor through ionic substitution in the B-sites. This multi-sensitive response towards temperature, external and internal pressure opens up promising technological applications for this family of materials, such as dielectric transductors or multistimuli-sensors, whose response can be modulated in a wide range of temperatures and pressures.
1. Introduction
Perovskites, and the phase transitions they can experience as a function of temperature, pressure, etc., have been at the center of a vast amount of research in solid state and material science over the last decades1 in view of their huge scientific and technological interest. In that context, early studies on conventional inorganic perovskites, ABX3 (A: lanthanides, alkaline-earth metals or similar cations, B: transition metal cations and X: oxide, sulphide or halide anions, etc.), specially mixed oxides, highlighted the exceptional functional and even multi-functional properties. This is the case, among others, of the very well-known and widely used ferroelectric BaTiO3, the piezoelectric Pb(Zr1−xTix)O3 (PZTs),2 the high temperature superconductor YBa2Cu3O7−δ,3 the colossal magnetoresistive La1−xCaxMnO3,4 the mixed ionic–electronic conductors La1−xSrxCoO3−δ,1a or more recently, the multiferroic BiFeO3.5Interestingly, in the last few years, significant efforts have been devoted to the development of new members of the versatile family of the so-called perovskite-like hybrid inorganic–organic materials,6 where the A- and/or X-site inorganic moieties of the conventional perovskites have been replaced by organic building blocks. Some of these materials, despite their recentness, have already revealed very remarkable functional properties. This is the case of the (MA)PbI3 (MA = methylammonium cation),7 which has revealed unprecedented photoconductivity; or the noteworthy [AmineH][M(X)3] families (AmineH = midsized protonated amines in the A-site position of the perovskite, M = different divalent transition metal cations in the B-site, X = different bidentate-bridge ligands in the X-site position, such as N3−, CN− or HCOO−), which exhibit cooperative magnetic, electric or elastic order, even multiferroicity, associated in many cases to very interesting thermally-induced phase transitions.8–17 Very remarkably, magnetoelectric coupling has been recently reported experimentally in the paramagnetic state of [(CH3)2NH2][Fe(HCOO)3],16 and ferroelectricity induced by magnetic order has been demonstrated in [CH3NH3][Co(HCOO)3],17 opening the large, flexible, multifunctional and designable family of hybrid perovskites to magnetically induced multiferroic behaviour.
Another related, but so far much less explored, family of potentially interesting compounds is that of metal-dicyanamides with the formula [AmineH][M(dca)3] and has perovskite-like structure. In these compounds, the dicyanamide anions, [N(CN)2]− (dca), bridge the transition metal cations (up to now, M: Mn2+ref. 18 and 19 and Ni2+ref. 18) in a μ1,5-dca end-to-end mode, forming a 3D framework. Meanwhile, the protonated amines (so far tetrapropylammonium, [(CH3CH2CH2)4N]+ or TPrA) are located in the resulting pseudo-cubooctahedral cavities.18
In our previous work,19 we have revisited the Mn compound [TPrA][M(dca)3], finding a structural transition at 330 K, and studied the influence of external pressure on the structural and dielectric properties of this compound. Interestingly enough, we found that this material had a new type-I multiferroicity that was very sensitive to temperature and external pressure.
In the present work, we enlarge the family of [TPrA][M(dca)3] perovskites with two new members (M: Fe2+ and Co2+) that we describe for the first time; and we shed light on the unexplored structural features of the Ni compound, for which two structural transitions had been previously reported at 160 K and 210 K,18 and we present two new additional polymorphs.
We also explore the dielectric properties of these materials and present a systematic and careful study of the effect of external and internal pressure on the structural transitions and dielectric responses of these three [TPrA][M(dca)3] (M: Fe2+, Co2+ and Ni2+) compounds.
Very interestingly, and as we will show below, we have found that these Fe, Co, and Ni compounds display multiple phase transitions responsible for multiple dielectric transitions that are both very sensitive to temperature as well as to external and internal pressure.
2. Experimental
2.1 Synthesis
[TPrA][M(dca)3] (M: Fe2+, Co2+ and Ni2+) materials were prepared from commercially available FeCl2·4H2O (98%, Sigma-Aldrich), Co(NO3)2·6H2O (98%, Sigma-Aldrich), Ni(NO3)2·6H2O (≥98.5%, Sigma-Aldrich), (TPrA)Br (98%, Aldrich), Na(dca) (96%, Aldrich) and absolute ethanol (Panreac), which were used as purchased without further purification. A reagent amount of deionised water was also used in the synthesis.The synthetic route used here is an adaptation of the previously reported method for the preparation of the [TPrA][M(dca)3] compounds (M: Mn2+ and Ni2+),18 where synthesis of the metal dicyanamide frameworks were templated by alkylammonium cations and accomplished through a mild solution chemistry method at room temperature.
In a typical experiment, 10 ml of an aqueous solution containing 2 mmol of FeCl2·4H2O or M(NO3)2·6H2O (M: Co2+ and Ni2+), was placed at the bottom of a glass tube. This solution was layered by a mixture of a solution of (TPrA)Br (2 mmol) in 10 ml of ethanol and a solution of Na(dca) (6 mmol) in 10 ml of water.
Single crystals of the three compounds (cubic colourless for M: Fe2+, cubic pink for M: Co2+, and cubic green for M: Ni2+) were obtained after one week and they were collected by filtration and washed several times with ethanol.
The compounds were obtained as single phase materials and their purity was confirmed by comparison of their experimental powder X-ray diffraction (PXRD) patterns at room temperature with those simulated from the single-crystal X-ray diffraction (SCXRD) data, see Fig. S1 of ESI.†
2.2 Single-crystal X-ray diffraction
Single-crystal data sets were collected in a Bruker-Nonius x8 ApexII X-ray diffractometer equipped with a CCD detector and using monochromatic MoKα1 radiation (λ = 0.71073 Å) at different temperatures: 368 K, 323 K, 300 K (293 K in the case of the Fe compound), 200 K (180 K for the Ni compound) and 100 K. Suitable crystals of each sample were chosen and mounted on a glass fiber using instant glue. For the 100 K and 200 K (or 180 K) sets, the crystal temperature was maintained using a cold stream of nitrogen from a Kyroflex cryostream cooler. Data integration and reduction was performed using the Apex2 V.1.0 27 (Bruker-Nonius, 2005) suite software. The intensity collected was corrected for Lorentz and polarization effects, and for absorption by semi-empirical methods on the basis of symmetry-equivalent data using SADABS (2004) from the suite software. The structures were solved by the direct method using the SHELXS-97 program20 and were refined by the full-matrix least-squares method on the SHELXL-97 program,20 both programs are available within the WinGX package.21 To solve the structures, anisotropic thermal factors were employed for the non-H atoms and non-disordered atoms. In the case of ordered TPrA cations, the hydrogen atoms of the propyl groups were added to the ideal positions and isotropic thermal factors were refined.2.3 Powder X-ray diffraction
A Siemens D-5000 diffractometer using CuKα radiation (λ = 1.5418 Å) was used to study these compounds by X-ray powder diffraction (XRPD) at room temperature. The XRPD pattern was compared with the profile obtained from the single crystal structure that was generated using Mercury 3.5.1 software.222.4 Differential scanning calorimetry
Differential scanning calorimetry (DSC) studies were carried out in a TA Instruments MDSC Q2000 equipped with a liquid nitrogen cooling system. The samples (each with a mass around 5 mg) were heated and cooled with a rate of 20 K min−1 (2 K min−1 in the case of the Ni compound) from 135 to 375 K under a nitrogen atmosphere.Additionally, pressure differential scanning calorimetry (PDSC) tests were performed in a TA Instruments pressure cell mounted on a Q2000 modulated DSC. The cell was calibrated for temperature and heat with indium at each of the pressures to be used in the measuring tests. The effect of pressure on the melting temperature and enthalpy of indium was taken into account.23 In a typical experiment, about 5 mg of each sample was confined inside a pinhole aluminum capsule. The experiments were performed in N2 atmosphere at a constant pressure (from 1 to 69 bar) while keeping a constant flow of 50 ml min−1 of N2. The samples under a constant external pressure were heated and cooled at a rate of 2 K min−1 from room temperature to 343 K.
2.5 Pressure–volume–temperature (PVT) analysis
To study the dilatometry of the materials at different pressures, PVT 100 SWO/ThermoHaake equipment was used. In a typical experiment, about 440 mg of powder material was loaded inside a cylinder between two pistons that transmit an axial compressive force from 200 to 1600 bar to the samples. After applying the external pressure, the samples were heated at a rate of 5 K min−1 from 183 K to 373 K and the axial thermal expansion of the samples was registered.2.6 Dielectric measurements
The complex dielectric permittivity (εr = εr′ − iεr′′) of the cold-press pelletized samples were measured as a function of frequency and temperature with a parallel-plate capacitor coupled to a Solartron 1260A Impedance/Gain-Phase Analyzer, capable of measuring in the frequency range from 10 μHz to 32 MHz using an amplitude of 2 V. The capacitor was mounted in a Janis SVT200T cryostat refrigerated with liquid nitrogen, and with a Lakeshore 332 incorporated to control the temperature from 78 to 400 K. Data were collected upon heating.Pelletized samples, made from cold-press non-oriented single crystals with an area of approximately 133 mm2 and a thickness of approximately 1.3 mm, were prepared to fit into the capacitor, and gold was sputtered on their surfaces to ensure a good electrical contact with the electrodes.
All the dielectric measurements were carried out in a nitrogen atmosphere where several cycles of vacuum and nitrogen gas were performed to ensure that the sample environment was free of water.
Additionally, dielectric measurements were carried out in a pressure cell supplied by Novocontrol GmbH. The cell, basically a stainless steel cylinder with a hermetic seal, was filled with a silicone fluid that transmits an isostatic pressure from the piston to the sample. The dielectric response was measured for 103–106 Hz frequencies. The measurements were performed as a function of temperature (310–380 K) for constant pressures up to 2000 bar.
3. Results and discussion
3.1 Studies at ambient pressure
| Heating | Cooling | |||||
|---|---|---|---|---|---|---|
| T1 (K) | T2 (K) | T3 (K) | T1 (K) | T2 (K) | T3 (K) | |
| Fe | 286 | 300 | 331 | 279 | 292 | 330 |
| Co | 246 | 301 | 341 | 230 | 292 | 339 |
| Ni | 216 | 302 | 356 | 175 | 291 | 355 |
The observed thermal hysteresis indicates the first order character of such transitions, whose associated enthalpy and entropy changes are indicated in Table S1 of the ESI.†
Taking into account that for an order–disorder transition ΔS = R![[thin space (1/6-em)]](https://www.rsc.org/images/entities/char_2009.gif) ln(N), where R is the gas constant and N is the ratio of the number of configurations in the disordered and ordered system, a value of N ∼ 1.2–2.6 is calculated for each transition, depending also on the given compound (see Table S1 of ESI†). Such values are much lower than in the case of the analogue Mn compound, [TPrA][Mn(dca)3], that exhibits a single phase transition with N ∼ 8.19
ln(N), where R is the gas constant and N is the ratio of the number of configurations in the disordered and ordered system, a value of N ∼ 1.2–2.6 is calculated for each transition, depending also on the given compound (see Table S1 of ESI†). Such values are much lower than in the case of the analogue Mn compound, [TPrA][Mn(dca)3], that exhibits a single phase transition with N ∼ 8.19
In the case of the Ni compound, we have to note that we identified, by DSC, the previously reported high temperature structural transition at ∼210 K.18 Nevertheless, we were not able to also find the reported lower temperature structural transition (∼160 K), not even when measuring at the slow temperature rate of 2 K min−1. As we will show below,18 this result is in agreement with our single-crystal X-ray diffraction analysis, which also does not show the previously reported re-entrant structural transition at 160 K for this compound. We attribute this lack of transition to kinetic factors.
According to SCXRD, these compounds display four polymorphs (hereafter named as I, Ia, Ib and II) from 100 K to 368 K, all based on perovskite-like structures.
In the following paragraphs, we will comparatively describe the obtained structures, paying special attention to the novel polymorphs (four, in the case of the Fe and Co compounds, two in the case of the Ni compound), and focussing on details that are relevant to understand the properties.
The crystallographic data for the four polymorphs of each of the three compounds are compiled in Tables S2–S4 of the ESI,† and a summary of selected bond lengths and angles is provided in the Tables S5–S8 of the ESI.†
Polymorph I. Below 286 K (M: Fe2+), 246 K (M: Co2+) and 216 K (M: Ni2+) the structure of these compounds is tetragonal, space group P
![[4 with combining macron]](https://www.rsc.org/images/entities/char_0034_0304.gif) 21c (non-centrosymmetric), and it can be described as a 2a × 2a × 2a perovskite super-structure.
21c (non-centrosymmetric), and it can be described as a 2a × 2a × 2a perovskite super-structure.
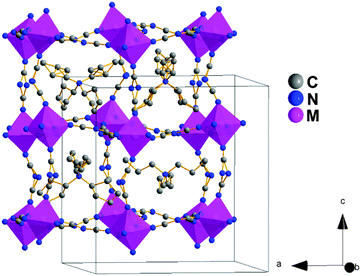
The asymmetric unit is defined by one independent metal cation, three dca anions and three TPrA cations. The metal cations are in a distorted [MN6] octahedral environment with six different M–N distances, see Table S5 of the ESI.† The resulting [MN6] octahedra are rotated cooperatively along the main crystallographic axes (tilt systems a−b+c− at Glazer notation).24 The TPrA cations are located inside the cavities of the resulting framework.
As it also occurs in the other polymorphs, and as it could be expected, as the size of the M (perovskite B-site cation) decreases from Fe2+ to Ni2+, the unit cell volume and the M–N bond lengths were observed to decrease. In addition, the octahedra tilting in the ab plane decreases.
As seen in Fig. 2, the structures exhibit a certain disorder in the dca anions (in the N-amide atoms along the c-axis) and in the C atoms of the TPrA cations, as it was previously described for the Ni and Mn compounds.18,19 In addition, we remark a most interesting new feature: half of the TPrA cations inside the pseudo-cubooctahedral cavities (those located on a 2-fold axis) show a cooperatively off-center shift along the c-axis, following an antiferrodistortive up-down/up-down pattern, see Fig. S2 of the ESI.†
Such displacement, that increases as the size of the M (B-site cation) decreases, is 0.095(9) Å (M: Fe2+), 0.069(0) Å (M: Co2+) and 0.038(2) Å (M: Ni2+).
The characteristics of this low temperature polymorph are similar to those recently reported for polymorph I of the Mn analogue19 where the TPrA shift along the c-axis is even larger (0.105(3) Å).
In the case of the Ni compound, for which this polymorph I has already been described before,18 a re-entrant phase transition from polymorph I to polymorph Ia (described below) at 160 K is also reported.18 Nevertheless, our SCXRD data (supported by our DSC analysis) do not reveal this structural transition. The polymorph I is maintained down-to 100 K. Therefore, we rationalize that the previously reported re-entrant structural transition could be related to kinetic factors that depend on the cooling rate and stabilization time.
Polymorph Ia. At T1 (see Table 1), the structure of polymorph I transforms into that of polymorph Ia of orthorhombic symmetry, space group Pnna (centrosymmetric) and a different 2a × ≈2√2a × ≈2√2a perovskite super-lattice, where apol.Ia ≈ cpol.I, and bpol.Ia, cpol.Ia ≈ √2apol.I, see Tables S2–S4 of the ESI.†
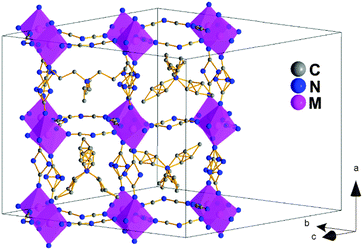
The asymmetric unit contains two independent metal cations, eight dca anions and four TPrA cations. As in polymorph I, each metal cation is in a distorted octahedral environment with six different M–N distances (see Table S6 of the ESI†) and the [MN6] octahedra are cooperatively rotated following an a−b+c− tilt system.
On the other hand, and as could be expected, this polymorph Ia shows a slightly larger disorder than polymorph I (Fig. 3). The positions of the N-amide of the dca ligands along the a-axis had to be modeled occupying two (or three positions depending on the dca ligand) with equal occupancies; also, three of the four TPrA cations in the asymmetric unit present disorder in the C atom positions of their propyl groups.
And most remarkably, all the TPrA cations are in off-center positions following a cooperative pattern different from that shown by polymorph I, see Fig. S3 of the ESI:† (a) half of them (those located on a 2-fold axis along the a-axis) show a cooperative off-center shift (about 0.23 Å, ∼15% larger than in polymorph I along such a direction) along the a-axis towards one side of these cavities. These displaced TPrA cations are antiferrodistortively arranged along the b-axis, displaying an up-down-up-down pattern. (b) The other half of the TPrA cations (those located on a 2-fold axis along the c-axis) show an even larger cooperative off-center shift (up to 0.62 Å) along the c-axis towards one edge of these cavities, following an antiferrodistortive pattern.
Polymorph Ib. At T2, the structure of these [TPrA][M(dca)3], (M: Fe2+, Co2+ and Ni2+) compounds changes again: even if its symmetry remains orthorhombic, its space group changes to Ibam (centrosymmetric), and it has to be described on the basis of a different ≈√2a × ≈√2a × 2a super-lattice, see Tables S2–S4 of the ESI.†
In this case, the asymmetric unit contains one independent metal cation, two dca anions and one TPrA cation. The transition metal cations are in a slightly distorted octahedral environment with three different M–N bond lengths, see Table S7 of the ESI.† And differently from polymorph I and polymorph Ia, here the [MN6] octahedra are cooperatively rotated within the ab plane and display an anticlockwise arrangement along the c-axis (tilt systems a0a0c− at Glazer notation).
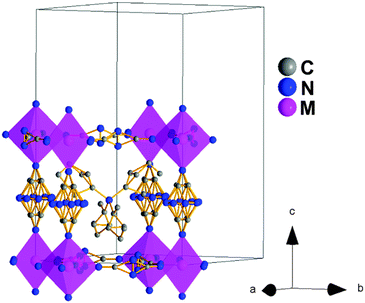
Also, in this polymorph, the dca ligands show a much larger disorder than in the case of polymorph Ia, especially along the c-axis, so that the N-amide atom and the C atom had to be modeled occupying the 8 and 4 positions, respectively. This increase suggests a dynamic disorder along such a direction that would imply the rotation of the dca ligands around the c-axis axis, see Fig. 4.
As for the TPrA cations, which are also more disordered than in polymorph Ia, the most important remark is that they are located at the center of the cavities (Fig. 4). This is in contrast to the previous polymorphs. As indicated above, half (polymorph I) or all of them (polymorph Ia) are off-shifted.
Polymorph II. At T3 (see Table 1) the structure of these compounds changes again and transforms into that of polymorph II with tetragonal symmetry and space group I4/mcm (centrosymmetric), even if the same perovskite super-lattice as polymorph Ib, ≈√2a × ≈√2a × 2a. In fact, the space group of that lower temperature polymorph is a subgroup of polymorph II.
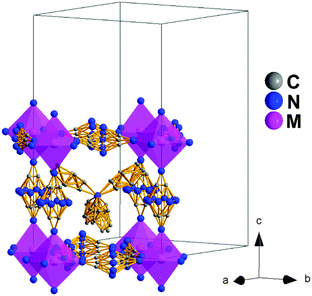
In that context, both polymorphs Ib and II are quite similar and their main differences rely on their symmetry and the even larger disorder of the dca ligands and TPrA cations in this higher temperature polymorph, see Fig. 5. On the other hand, and as in polymorph Ib, the TPrA cations remain centered in the cavities.
Therefore, different from the previous transitions, this occurs only at T3 and involves order/disorder phenomena with no ionic displacements.
This polymorph II of the Fe, Co and Ni compounds is similar to that recently reported for the Mn compound above 330 K.19
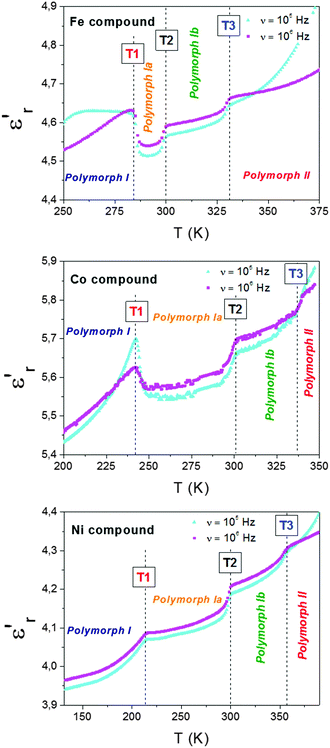 | ||
| Fig. 6 Temperature dependence of the dielectric constant (εr′) of the Fe, Co and Ni compounds measured at different frequencies (105–106 Hz). | ||
Taking into account the previous structural information, we ascribe such anomalies to the following processes:
(a) At T1, the dca ligands remain disordered in both polymorphs mainly due to the cooperative displacement of the TPrA cations between two different antiferrodistortive arrangements that involve off-centered positions. (b) At T2, we relate it to the displacement of the TPrA cations (which are off-center shifted in polymorph Ia) to center positions in polymorph Ib. In addition, the increase disorder experienced by the polar dca ligands could also be contributing to the observed dielectric anomaly. (c) Finally, at T3, we relate it to the additional order/disorder transition experienced by both the dca ligands and TPrA cations on passing from polymorph Ib to polymorph II.
This situation is reminiscent of that recently described for the Mn analogue, where a dielectric anomaly is observed above room temperature, Tt ∼ 330 K, associated to the change from a cooperative to a non-cooperative electric behaviour (antiferroelectric (AFE) to paraelectric (PE) transition). The former implies an AFE distribution of electric dipoles in polymorph I, related to an off-shift of the apolar TPrA cations and the order–disorder of the polar dca ligands mechanisms.
Nevertheless, in the case of here studied, (TPrA)[M(dca)3] (M: Fe2+, Co2+ and Ni2+), they not only show one but multiple dielectric anomalies that are related to the richer assortment of crystal structures displayed by these compounds.
Another aspect that should be emphasized is the significant difference in the origin of the dielectric transitions displayed by these (TPrA)[M(dca)3] (M: Mn2+, Fe2+, Co2+ and Ni2+) compounds, and those previously reported for nother hybrid perovskites such as [AmineH][M(X)3], (AmineH: midsized alkylammonium cations, X: N3−, CN− or HCOO− ligands).8–17 These latter contain polar cations inside the cubooctahedral cavities and/or H-bonds between the cations and the framework, and their dielectric transitions arise from order–disorder processes of the guest polar molecules.
Nevertheless, in the case of this novel dicyanamide family of [TPrA][M(dca)3] (M: Mn2+, Fe2+, Co2+ and Ni2+), the guest TPrA cations are non-polar and cannot form H-bonds, so that the mechanisms associated with the dielectric response are completely different, namely: (a) this response is related to a contribution of a cooperative off-shift of the guest TPrA cations inside the cavities that is reminiscent of the behaviour shown by ceramic ferroelectrics with perovskite structure, such as BaTiO3 (where the B-site cation is the one experiencing the temperature dependent reversible displacement, giving rise to the electric order). (b) It is also related to order–disorder processes driven by the polar dca ligands. This interesting feature can provide a novel mechanism to couple the magnetic and dielectric response of these compounds since the dca bridges are also involved in the magnetic interaction between the metal cations.
3.2 Influence of external and internal pressure on the structural and dielectric transition
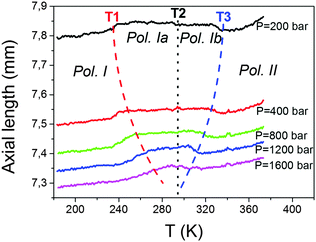
In what follows, we will show that these compounds are very sensitive to both applied external pressures, even small ones (P < 2 kbar), as well as to internal chemical pressure induced by modifying the size of the B-site cations.Interestingly, the kinks at T1 and T3 are highly pressure dependent, while no significant pressure dependence is observed for that appearing at T2.
As for the kink observed at T1, that implies an increase in the axial length. It gets progressively displaced towards higher temperatures as pressure increases, that is, it exhibits positive pressure dependence, δTt/δP ≈ +23 K kbar−1. This value is of the same order for the Mn compound previously reported, δTt/δP = +24.2 K kbar−1.19 Meanwhile, the anomaly observed at T3, which implies a sharp decrease in the axial length, gets progressively displaced towards lower temperatures upon application of increasing pressures. This means that this transition displays a negative pressure dependence, δTt/δP < 0, whose absolute value is similar to that of the previous case, even if negative, δTt/δP ≈ −23 K kbar−1.
To further deepen the peculiar pressure dependence of the transition occurring at T3, we have performed additional pressure differential scanning calorimetry (PDSC) studies applying smaller pressures (up to 69 bar).
As can be seen in Fig. 8, both the endothermic and exothermic peaks associated with this transition experience a progressive displacement towards lower temperatures as pressure is increased, with a value of δTt3/δP = −18.4 K kbar−1, of the same order to that found in the PVT experiments. Meanwhile, we observed that the enthalpy (ΔH) and entropy (ΔS) changes involved in such a transition remained constant under the applied external pressure.
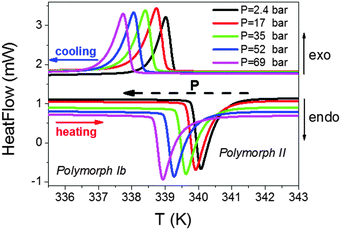 | ||
| Fig. 8 Pressure differential scanning calorimetry (PDSC) curves for the T3 transition of the Co compound. Similar behaviour is found in the Fe and Ni compounds. | ||
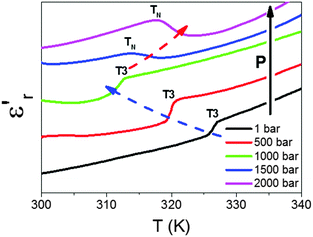
We have also studied the effect of external pressures (up to P ≤ 2000 bar) in the temperature dependence of the dielectric permittivity of these compounds. As an example of such behaviour, we show in Fig. 9 the effect of external pressure on the dielectric response of the Co-compound in the temperature range where the anomaly at T3 is detected.
As can be seen, for P < 1500 bar, the kink observed at T3 in the εr′ vs. T curve experiences a progressive displacement towards lower temperatures as pressure increases, in agreement with previous experiments.
Meanwhile, and very interestingly, when pressures that are higher than those previously used are applied, P ≥ 1500 bar, the shape of the kink changes and a new transition (TN) is found, which gets shifted to higher temperatures as pressure is further increased.
Taking into account that the shape and pressure dependence of such a peak is similar to that experienced by the Mn compound,19 we ascribe it to a new pressure-induced structural transition transforming directly polymorph I to polymorph II in these Fe, Co and Ni compounds.
This in turn means that polymorphs Ia and Ib become thermodynamically unstable under applied pressure, and that both will disappear for P > 1600 bar. In fact, for higher pressures, a single structural transition between polymorph I and II is expected, similar to the case of the Mn analogue.19
As it is well-known in those compounds, the origin of the internal chemical pressure is in the size mismatch that occurs when the A-site ions are too small to fill the space in the three-dimensional network of the [MO6] octahedral. This mismatch can be estimated as η = 1 − α, which is the deviation of the tolerance factor (α) of the structure from the ideal value.25–27
Extending this idea to the here studied [TPrA][M(dca)3] (M = Mn2+, Fe2+, Co2+ and Ni2+) perovskite compounds, where the ionic radius of the B-site cations follows the sequence rB: Mn2+ > Fe2+ > Co2+ > Ni2+, it can be expected that the tolerance factor will increase along the series while the internal pressure will decrease.
Moreover, we have calculated the value of such tolerance factors (α) following the approach recently introduced by Kieslich et al.28 to extend the concept of Goldschmidt's tolerance factor to hybrid inorganic–organic perovskites.
For that purpose, and using the modified Goldschmidt's equation, α = (rA(eff) + rX(eff))/√2(rB + 0.5hX(eff)),28 we have calculated the value of α from experimental room temperature crystallographic data of A-site (TPrA) and X-site (dca) ions and using the Shannon ionic radii tables29 for the B-site (transition metal) cations.
From the obtained values, which are summarized in Table S6 of the ESI† and range between 1.02(6) (M: Mn2+) and 1.05(9) (M: Ni2+), it is worth highlighting two aspects: (a) they reflect the expected increase in the tolerance factor as the size of B decreases, even if the large values of X (and A) prevent them from a larger variation. (b) Taking into account the large and complex A and X ions involved, and the simplicity of the model assumed to calculate their effective ionic sizes, the values obtained for the tolerance factor are extremely good. They fit very nicely within the TF region for which perovskite structures are expected to form (between 0.8–1.0 ± 6%)28 even if in this particular [TPrA][M(dca)3] system the upper limit is going to be slightly larger. These results also indicate that, in this dicyanamide series, the formation of hexagonal polytypes will require at least α > 1.05(9).
Another very interesting point that comes out from these results is the parallelism between the effect on internal pressure and external pressure on the structure of these dicyanamide compounds: both increasing external pressure or increasing the size of B reduces the temperature range in which the intermediate polymorphs Ia and Ib exist, until they finally disappear, as observed for the case of the Mn compound and for external pressures above 1500 bar, see Fig. S4 of the ESI.†
A final aspect that is worth referring to is the origin of the different pressure dependences displayed by the three consecutive temperature-induced phase transitions, and whose trend is again similar in the case of external and internal pressure. In that context, and as mentioned before, while the transition occurring at T1 shows the more commonly observed δTt/δP > 0, that at T3 shows a more scarcely seen pressure dependence of the negative sign δTt/δP < 0, and that at T2 is almost pressure independent.
To understand this behaviour, it is interesting to revisit previous studies carried out on oxidic and halidic perovskites, which have established that the sign of δTt/δP can depend on two factors: (a) the mechanism of the phase transition, whether it is displacive or an order–disorder type, and (b) the value of the tolerance factor that determines the change of stability of its cubic phase under P.30
As for (a), order–disorder transitions can be responsible for δTt/δP < 0, while displacive transitions give δTt/δP > 0.30 In the case of (b), when α is below the ideal value 1, the pressure reduces the stability of the cubic phase and favours those of lower symmetry, resulting in δTt/δP > 0. Meanwhile in systems with α > 1 and hexagonal stacking, pressure stabilizes the cubic stacking at the expense of the former, resulting in δTt/δP < 0.25
In the case of the here studied [TPrA][M(dca)3] series, where the four compounds exhibit perovskite-like distorted structures and none of them the hexagonal stacking expected for α > 1, we relate the different pressure dependences displayed by the three consecutive temperature-induced phase transitions to the prevailing mechanism of each of them: this would be the displacive one in the transition occurring at T1 and the order–disorder one in the case of T3. Meanwhile, the close competition between these two mechanisms in the case of T2 will result in almost no pressure dependence.
These external/internal pressure-responses reveal an easy tuning of the structural transition temperature for these hybrid perovskites. Since these structural transitions are in turn related to the dielectric properties, they can be used to modulate different dielectric responses in a wide range of temperatures near room temperature (from 210 to 360 K) either by applying small external pressures (P < 2 kbar) or simply by making appropriate ionic substitutions.
Therefore, this family of [TPrA][M(dca)3] dicyanamides provides promising technological applications as dielectric transductors, sensitive towards small changes of temperature and pressure values, that can even be easily modulated by appropriate ionic substitutions.
4. Conclusions
The hybrid inorganic–organic [TPrA][M(dca)3] (M: Fe2+, Co2+ and Ni2+) compounds are singular materials with perovskite-type structure. In these materials, [MN6] octahedral are linked by μ1,5-dca bridges forming pseudo cubooctahedral cavities, that hold TPrA cations inside. Remarkably, they exhibit multiple phase transitions, that display up to three first-order structural transition between four different polymorphs (I, Ia, Ib and II) in a range of temperatures near room temperature (210–360 K). This finding is in contrast with the analogous Mn compound that only displays one first-order transition at Tt ∼ 330 K.Interestingly, these compounds also show multiple dielectric anomalies that are related to their richer assortment of crystal structures. Another aspect that should be emphasized is the significant difference in the origin of the dielectric transitions displayed by these (TPrA)[M(dca)3] (M: Fe2+, Co2+ and Ni2+) compounds, and those previously reported for other hybrid perovskites. In the case of these novel dicyanamide perovskite-like compounds, the guest TPrA cations are non-polar and cannot form H-bonds, so that the mechanisms associated with the dielectric response are related to: (a) the contribution of a cooperative off-shift of the guest TPrA cations inside the cavities; and (b) order–disorder processes driven by the polar dca ligands.
In addition, we have studied the parallelism between the effect of the external hydrostatic pressure (P < 2 kbar) and the internal chemical pressure (by modifying the ionic radii and thereby the tolerance factor) on the phase and dielectric transitions. It is important to highlight that we can modulate the structural and dielectric transition temperature as a function of external/internal pressure: by increasing the external pressure or increasing the M (perovskite B-site cations) ionic radii (decreasing the tolerance factor), we can reduce the thermal stability of the intermediate polymorphs Ia and Ib, and even suppress them.
Therefore, the hybrid perovskites [TPrA][M(dca)3] (M: Fe2+, Co2+ and Ni2+) are unique multi-sensitive materials where their multiple phase and dielectric transitions can be easily tuned as a function of external pressures as well as by internal chemical pressure. To our knowledge, these are the first examples of hybrid inorganic–organic perovskite-like materials with multiple dielectric transitions that offer easy temperature, pressure and chemical modulation. In that event, these singular materials offer potential interest for future technological applications such as temperature and pressure sensing.
Acknowledgements
The authors are grateful for the financial support from Ministerio de Economía y Competitividad MINECO (MINECO) ENE2014-56237-C4-4-R and Xunta de Galicia under the project GRC2014/042. J. M. B.-G. also wants to thank Barrié Foundation for a predoctoral fellowship and S. Y.-V. to the Xunta de Galicia for a postdoctoral grant (Plan I2C).Notes and references
- (a) P. Granger, V. I. Parvulescu, S. Kaliaguine and W. Prellier, Perovskites and Related Mixed Oxides: Concepts and Applications, Wiley-VCH, Weinheim, Germany, 2015 Search PubMed; (b) F. S. Galasso, Structure, properties, and preparation of perovskite-type compounds, Pergamon Press, New York, 1969 Search PubMed; (c) M. A. Peña and J. L. G. Fierro, Chem. Rev., 2001, 101, 1981–2018 CrossRef.
- (a) M. E. Lines and A. M. Glass, Principles applications of ferroelectric and related materials, Oxford Unviersity Press, New York, 2001 Search PubMed; (b) F. Jona and G. Shirane, Ferroelectric Crystals, Pergamon Press, Oxford, 1962 Search PubMed.
- J. M. Tarascon and B. G. Bagley, in Chemistry of superconducting materials, ed. T. A. Vanderah, Noyes Publications, 1992 Search PubMed.
- C. N. R. Rao and B. Raveau, Colossal magnetoresistance, charge ordering and related properties of Manganese oxides, World Scientific Publications, Hackensack, NJ, USA, 2004 Search PubMed.
- N. A. Spaldin and M. Fiebig, Science, 2005, 309, 391–392 CrossRef CAS PubMed.
- D. Mitzi, in Prog. Inorg. Chem., ed. K. D. Karlin, John Wiley & Sons, New York, USA, 1999, ch. 1, vol. 48 Search PubMed.
- (a) M. M. Lee, J. Teuscher, T. Miyasaka, T. N. Murakami and H. J. Snaith, Science, 2012, 338, 643–647 CrossRef CAS PubMed; (b) J. Burschka, N. Pellet, S. J. Moon, R. Humphry-Baker, P. Gao, M. K. Nazeeruddin and M. Grätzel, Nature, 2013, 499, 316–319 CrossRef CAS PubMed; (c) N. J. Jeon, J. H. Noh, W. S. Yang, Y. C. Kim, S. Ryu, J. Seo and S. I. Seok, Nature, 2015, 517, 476–480 CrossRef CAS PubMed; (d) M. Sessolo and H. J. Bolink, Science, 2016, 350, 917 CrossRef PubMed.
- (a) X.-H. Zhao, X.-C. Huang, S.-L. Zhang, D. Shao, H.-Y. Wei and X.-Y. Wang, J. Am. Chem. Soc., 2013, 135, 16006–16009 CrossRef CAS PubMed; (b) Z.-Y. Du, Y.-P. Zhao, W.-X. Zhang, H.-L. Zhou, C.-T. He, W. Xue, B.-Y. Wang and X.-M. Chen, Chem. Commun., 2014, 50, 1989–1991 RSC; (c) Z.-Y. Du, Y.-P. Zhao, C.-T. He, B.-Y. Wang, W. Xue, H.-L. Zhou, J. Bai, B. Huang, W.-X. Zhang and X.-M. Chen, Cryst. Growth Des., 2014, 14, 3903–3909 CrossRef CAS; (d) Z.-Y. Du, Y.-Z. Sun, S.-L. Chen, B. Huang, Y.-J. Su, T.-T. Xu, W.-X. Zhang and X.-M. Chen, Chem. Commun., 2015, 51, 15641–15644 RSC; (e) Z.-Y. Du, T.-T. Xu, B. Huang, Y.-J. Su, W. Xue, C.-T. He, W.-X. Zhang and X.-M. Chen, Angew. Chem., 2015, 127, 928–932 CrossRef; (f) L. C. Gómez-Aguirre, B. Pato-Doldán, A. Stroppa, L.-M. Yang, T. Frauenheim, J. Mira, S. Yáñez-Vilar, R. Artiaga, S. Castro-García, M. Sánchez-Andújar and M. A. Señarís-Rodríguez, Chem. – Eur. J., 2016 DOI:10.1002/chem.201503445.
- (a) W. Zhang, Y. Cai, R.-G. Xiong, H. Yoshikawa and K. Awaga, Angew. Chem., Int. Ed., 2010, 122, 6758–6760 CrossRef; (b) W. Zhang, H.-Y. Ye, R. Graf, H. W. Spiess, Y.-F. Yao, R.-Q. Zhu and R.-G. Xiong, J. Am. Chem. Soc., 2013, 135, 5230–5233 CrossRef CAS PubMed; (c) X. Zhang, X.-D. Shao, S.-C. Li, Y. Cai, Y.-F. Yao, R.-G. Xiong and W. Zhang, Chem. Commun., 2015, 51, 4568–4571 RSC; (d) W.-J. Xu, S.-L. Chen, Z.-T. Hu, R.-B. Lin, Y.-J. Su, W.-X. Zhang and X.-M. Chen, Dalton Trans., 2016, 45, 4224–4229 RSC.
- (a) P. Jain, N. S. Dalal, B. H. Toby, H. W. Kroto and A. K. Cheetham, J. Am. Chem. Soc., 2008, 130, 10450–10451 CrossRef CAS PubMed; (b) P. Jain, V. Ramachandran, R. J. Clark, H. D. Zhou, B. H. Toby, N. S. Dalal, H. W. Kroto and A. K. Cheetham, J. Am. Chem. Soc., 2009, 131, 13625–13627 CrossRef CAS PubMed; (c) Z. Zhang, W. Li, M. A. Carpenter, C. J. Howard and A. K. Cheetham, CrystEngComm, 2015, 17, 370–374 RSC; (d) G. Kieslich, A. C. Forse, S. Sun, K. T. Butler, S. Kumagai, Y. Wu, M. R. Warren, A. Walsh, C. P. Grey and A. K. Cheetham, Chem. Mater., 2016, 28, 312–317 CrossRef CAS; (e) G. Kieslich, S. Kumagai, K. T. Butler, T. Okamura, C. H. Hendon, S. Sun, M. Yamashita, A. Walsh and A. K. Cheetham, Chem. Commun., 2015, 51, 15538–15541 RSC.
- (a) R. Shang, G.-C. Xu, Z.-M. Wang and S. Gao, Chem. – Eur. J., 2014, 20, 1146–1158 CrossRef CAS PubMed; (b) S. Chen, R. Shang, K.-L. Hu, Z.-M. Wang and S. Gao, Inorg. Chem. Front., 2014, 1, 83–98 RSC; (c) S. Chen, R. Shang, B.-W. Wang, Z.-M. Wang and S. Gao, Angew. Chem., 2015, 127, 11245–11248 CrossRef; (d) R. Shang, S. Chen, B.-W. Wang, Z.-M. Wang and S. Gao, Angew. Chem., 2016, 128, 2137–2140 CrossRef.
- (a) M. Sánchez-Andújar, S. Presedo, S. Yáñez-Vilar, S. Castro-García, J. Shamir and M. A. Señarís-Rodríguez, Inorg. Chem., 2010, 49, 1510–1516 CrossRef PubMed; (b) B. Pato-Doldán, M. Sánchez-Andújar, L. C. Gómez-Aguirre, S. Yáñez-Vilar, J. López-Beceiro, C. Gracia-Fernández, A. A. Haghighirad, F. Ritter, S. Castro-García and M. A. Señarís-Rodríguez, Phys. Chem. Chem. Phys., 2012, 14, 8498–8501 RSC; (c) J. López-Beceiro, C. Gracia-Fernández, S. Gómez-Barreiro, S. Castro-García, M. Sánchez-Andújar and R. Artiaga, J. Phys. Chem. C, 2012, 116, 1219–1224 CrossRef; (d) B. Pato-Doldán, L. C. Gómez-Aguirre, J. M. Bermúdez-García, M. Sánchez-Andújar, A. Fondado, J. Mira, S. Castro-García and M. A. Señarís-Rodríguez, RSC Adv., 2013, 3, 22404–22411 RSC; (e) M. Sánchez-Andújar, L. C. Gómez-Aguirre, B. Pato-Doldán, S. Yáñez-Vilar, R. Artiaga, A. L. Llamas-Saiz, R. S. Manna, F. Schnelle, M. Lang, F. Ritter, A. A. Haghighirad and M. A. Señarís-Rodríguez, CrystEngComm, 2014, 16, 3558–3566 RSC; (f) L. C. Gómez-Aguirre, B. Pato-Doldán, A. Stroppa, S. Yáñez-Vilar, L. Bayarjargal, B. Winkler, S. Castro-García, J. Mira, M. Sánchez-Andújar and M. A. Señarís-Rodríguez, Inorg. Chem., 2015, 54, 2109–2116 CrossRef PubMed.
- (a) B. Zhou, Y. Imai, A. Kobayashi, Z.-M. Wang and H. Kobayashi, Angew. Chem., Int. Ed. Engl., 2011, 50, 11441–11445 CrossRef CAS PubMed; (b) Y. Imai, B. Zhou, Y. Ito, H. Fijimori, A. Kobayashi, Z. M. Wang and H. Kobayashi, Chem. – Asian J., 2012, 7, 2786–2790 CrossRef CAS PubMed.
- (a) A. Stroppa, P. Barone, P. Jain, J. M. Perez-Mato and S. Picozzi, Adv. Mater., 2013, 25, 2284–2290 CrossRef CAS PubMed; (b) Y. Tian, A. Stroppa, Y.-S. Chai, P. Barone, M. Perez-Mato, S. Picozzi and Y. Sun, Phys. Status Solidi RRL, 2015, 9, 62–67 CrossRef CAS; (c) M. Ptak, M. Mczka, A. Ggor, A. Sieradzki, A. Stroppa, D. Di Sante, J. M. Perez-Mato and L. Macalik, Dalton Trans., 2016, 45, 2574–2583 RSC.
- (a) M. Mczka, A. Ciupa, A. Ggor, A. Sieradzki, A. Pikul, B. Macalik and M. Drozd, Inorg. Chem., 2014, 53, 5260–5268 CrossRef PubMed; (b) M. Mczka, A. Pietraszko, B. Macalik and K. Hermanowicz, Inorg. Chem., 2014, 53, 787–794 CrossRef PubMed; (c) M. Mczka, A. Ggor, B. Macalik, A. Pikul, M. Ptak and J. Hanuza, Inorg. Chem., 2014, 53, 457–467 CrossRef PubMed; (d) M. Mczka, A. Ggor, K. Hermanowicz, A. Sieradzki, L. Macalik and A. Pikul, J. Solid State Chem., 2016, 237, 150–158 CrossRef.
- (a) Y. Tian, A. Stroppa, Y. Chai, L. Yan, S. Wang, P. Barone, S. Picozzi and Y. Sun, Sci. Rep., 2014, 4, 6062 CrossRef CAS PubMed; (b) Y. Tian, S. Shen, J. Cong, L. Yan, S. Wang and Y. Sun, J. Am. Chem. Soc., 2016, 138, 782–785 CrossRef CAS PubMed.
- L. C. Gómez-Aguirre, B. Pato-Doldán, J. Mira, S. Castro-García, M. A. Señarís-Rodríguez, M. Sánchez-Andújar, J. Singleton and V. S. Zapf, J. Am. Chem. Soc., 2016, 138, 1122–1125 CrossRef PubMed.
- J. A. Schlueter, J. L. Manson and U. Geiser, Inorg. Chem., 2005, 44, 3194–3202 CrossRef CAS PubMed.
- J. M. Bermúdez-García, M. Sánchez-Andújar, S. Yáñez-Vilar, S. Castro-García, R. Artiaga, J. López-Beceiro, L. Botana, A. Alegría and M. A. Señarís-Rodríguez, Inorg. Chem., 2015, 54, 11680–11687 CrossRef PubMed.
- G. M. Sheldrick, Acta Crystallogr., Sect. A: Cryst. Phys., Diffr., Theor. Gen. Crystallogr., 2008, 64, 112–122 CrossRef CAS PubMed.
- L. J. Farrugia, Appl. Crystallogr., 2012, 45, 849–854 CrossRef CAS.
- Mercury 3.5.1 (Build RC5) – Crystal Structure Visualisation (CCDC) http://www.ccdc.cam.ac.uk/mercury.
- (a) J. D. Dudley and H. T. Hall, Phys. Rev., 1960, 118, 1211–1216 CrossRef CAS; (b) G. W. H. Höhne, W. Dollhopf, K. Blankenhorn and P. U. Mayr, Thermochim. Acta, 1996, 273, 17–24 CrossRef.
- A. M. Glazer, Acta Crystallogr., Sect. B: Struct. Sci., 1972, 28, 3384–3392 CrossRef CAS.
- J. B. Goodenough, J. A. Kafalas and J. M. Longo, in Preparative methods in Solid State Chemistry, ed. P. Hagenmüller, Academic press, New York, USA, 1972, ch. 1 Search PubMed.
- K. I. Kugel, A. L. Rakhmanov, A. O. Sboychakov, N. Poccia and A. Bianconi, Phys. Rev. B: Condens. Matter Mater. Phys., 2008, 78, 165124 CrossRef.
- H. Y. Hwang, T. T. Palstra, S.-W. Cheong and B. Batlogg, Phys. Rev. B: Condens. Matter Mater. Phys., 1995, 52, 15046–15049 CrossRef CAS.
- (a) G. Kieslich, S. Suna and A. K. Cheetham, Chem. Sci., 2014, 5, 4712–4715 RSC; (b) G. Kieslich, S. Suna and A. K. Cheetham, Chem. Sci., 2015, 6, 3430–3433 RSC.
- R. D. Shannon, Acta Crystallogr., Sect. A: Found. Crystallogr., 1976, 32, 751 CrossRef.
- K. S. Aleksandrov, J. Bartolome, M. V. Gorev and I. N. Flerov, Phys. Status Solidi B, 2000, 217, 785–791 CrossRef CAS.
Footnote |
| † Electronic supplementary information (ESI) available: Powder XRD patterns, details of the crystal structure, graphics of the variation of the phase transition temperatures with the tolerance factor and external pressure, table of enthalpy and entropy values obtained by DSC, summary of crystallographic data and CIF (CSD number: 431135–431145). See DOI: 10.1039/c6tc00723f |
| This journal is © The Royal Society of Chemistry 2016 |


