Building a poly(epoxy propylimidazolium ionic liquid)/graphene hybrid through πcation–π interaction for fabricating high-k polymer composites with low dielectric loss and percolation threshold†
Chunxi
Xu
,
Li
Yuan
,
Guozheng
Liang
* and
Aijuan
Gu
*
State and Local Joint Engineering Laboratory for Novel Functional Polymeric Materials, Jiangsu Key Laboratory of Advanced Functional Polymer Design and Application, College of Chemistry, Chemical Engineering and Materials Science, Soochow University, Suzhou, China. E-mail: ajgu@suda.edu.cn; lgzheng@suda.edu.cn; Fax: +86 51265880089; Tel: +86 51265880967
First published on 14th March 2016
Abstract
Sustainability urgently asks for low dielectric loss and a low percolation threshold (fc) while developing high dielectric constant (Hi-k) conductor/polymer composites. In this work, a novel hybridized graphene (PIL–TrGO) was first reported using a two-step process, including the decoration of an epoxy functionalized ionic liquid (IL) on the surface of thermally reduced graphene oxide (TrGO) through πcation–π interaction, followed by in situ polymerization of the IL. The DC conductivity of the PIL–TrGO hybrid is as good as that of TrGO. Then, different loadings of PIL–TrGO were added into cyanate ester (CE) to prepare a series of composites; the TrGO/CE composites were also prepared for comparison. Different from TrGO, the PIL has a large amount of epoxy groups, which guarantees good dispersion of the hybridized graphene in CE matrix, and thus provides the base for transferring the outstanding electrical properties of graphene to the composites. When the loading of fillers approaches the percolation threshold (fc), the dielectric constant and loss at 100 Hz of PIL–TrGO/CE composites are about 13 and 0.57 times that of TrGO/CE composites, respectively, while the fc of PIL–TrGO/CE composites is still as low as 0.94 wt%. The dielectric mechanism was studied by discussing and simulating impedance spectra, and the results show that PIL–TrGO/CE composites possess more micro-capacitor structures than TrGO/CE composites; moreover, the cation–anion charge layers on TrGO surfaces enhance the Maxwell–Wagner–Sillars polarization between PIL–TrGO hybrid and the CE matrix, and then markedly increase the dielectric constant of composites. PILs coated on graphene surfaces act as electron insulative layers and thus decrease dielectric loss induced by the leakage current between conductive carbon layers.
1 Introduction
With the rapid development and wide use of electronic technology, giant permittivity is required for capacitors with large capacity, small volume, high reliability and long-term stability.1–3 Compared with ceramic/polymer composites, high dielectric constant (Hi-k) conductor/polymer composites show advantages of a much lower filler content, lower density, better processability and better mechanical properties.4–6 However, attaining a marked increase in permittivity usually also brings high dielectric loss due to the percolation theory; this goes against the application as energy storage materials. To reduce the dielectric loss for Hi-k conductor/polymer composites, researchers tried to coat conductors with an insulating layer and found that the presence of insulation coating generally increased the percolation threshold (fc) and decreased the dielectric constant for composites. Therefore, building novel conductors becomes the most important strategy for developing Hi-k materials.Carbon materials are the most used conductors to fabricate Hi-k composites at present. The unique layered structure of graphene makes it the best among all known conductors to transfer electrons at room temperature.7 Hence, it is attractive and preferential to design a novel conductor based on graphene.
Recently, chemical (covalent)8–10 and physical (noncovalent)11–13 methods have been applied to modify graphene. Among them, decorating or forming a coat starting from organics onto graphene sheets through physical actions such as π–π conjugation, van der Waals force or electrostatic interaction has attracted tremendous interest. This is because noncovalent modifications usually do not destroy graphene's intrinsic π-conjugate electronic structure,14 and thus the excellent properties of graphene can be preserved.
Conducting polymers are often used to noncovalently modify graphene, such as polyaniline15 and polypyrrole.16 Yet these polymers generally have poor solubility and poor processability as well as relatively low thermal resistance (200–300 °C),16,17 and so these polymers are not suitable for fabricating Hi-k composites based on heat-resistant thermosetting resins. In addition, Shang's group prepared polyaniline modified graphene and the corresponding polyvinylidene fluoride (PVDF) composites; despite good dispersion and compatibility with PVDF, the coating rate of PAIN is so large that the resultant dielectric constant is relatively low (only 9.5 at 104 Hz when the graphene content is 3 vol%), and consequently, the PVDF composites have higher fc.18
Since 2014, several papers have been published on modifying graphene by ionic liquids (ILs) due to the unique advantages of ILs such as high ionic conductivity at room temperature, strong polarity, low toxicity, high chemical and thermal stability.19 Xu and co-workers reported PVDF composites based on small molecule IL modified graphene, and found that the IL modification of graphene increased the fc from 0.67 to 1.86 vol% and the corresponding dielectric constant at the fc increased from 90 to 167.20 Wang's group prepared (1-hexadecyl) triphenylphosphonium bromide (HTPB) modified reduced graphene oxide (rGO) and found that HTPB-rGO/PVDF composites have a low fc (≈0.678 wt%), but the permittivity was also very low (≈20 at 102 Hz).21 Zhou's group fabricated 1-(2-amino ethyl)-3-methylimidazole bromide (IL) modified graphene, which was then used to prepare bismaleimide resin composites; the composites had high permittivity (≈1001) and low dielectric loss (≈0.008) at 102 Hz, but the content of modified graphene is as large as 4 wt%.22
The above results demonstrate that although IL modified graphene shows the advantage of fabricating Hi-k composites, further work should be done to simultaneously achieve a high dielectric constant, low dielectric loss and a low fc. In addition, previous research pointed out that the interaction between small molecules and graphene was weak and observed the desorption of surfactant molecules from graphene.23
Our project aims at developing new conductors that combine the advantages but not shortcomings of both graphene and ILs for developing polymer composites with simultaneously high dielectric constant, low dielectric loss and low fc. In particular, a new kind of hybridized graphene (PIL–TrGO) was built through πcation–π interaction with unique poly(epoxy propylimidazolium ionic liquid), and then the hybrid was added into cyanate ester (CE) to prepare a series of new composites. These composites have desirable dielectric properties, including a high dielectric constant, low dielectric loss and a low fc. The origin behind was intensively discussed.
2 Experimental
2.1 Materials
The CE used herein was 2,2-bis(4-cyanatophenyl) propane, which was obtained from Yangzhou Technia Material Co. China. Natural graphite powder (average particle size ≤30 μm) was obtained from Sinopharm Chemical Reagent Co., Ltd, China. Strong sulfuric acid (H2SO4, 95–98%), hydrogen peroxide (H2O2, 30%), methanol, acetone, ethyl ether, epichlorohydrin, N-vinyl imidazole (99%), vitamin C, potassium permanganate (KMnO4), sodium nitrate (NaNO3) and sodium tetrafluoroborate (98%) were all commercial products and used without further purification. 2,2-Azobis(isobutyronitrile) (AIBN) was purchased from Aladdin reagent (Shanghai) Co., Ltd, China, and recrystallized from alcohol before use. Deionized water was produced in our lab.2.2 Synthesis of the epoxy-functionalized IL monomer (e-Vimi BF4)
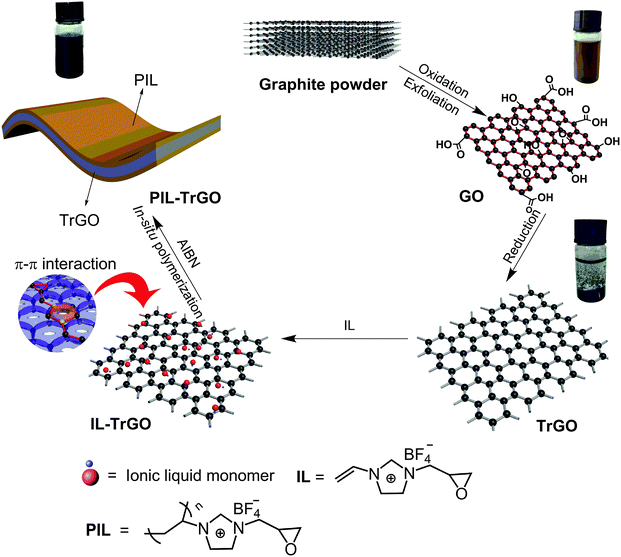
IL, 1-vinyl-3-epoxy limidazolium tetrafluoroborate (e-Vimi BF4), was synthesized using the process shown in Fig. 1. In particular, N-vinyl imidazole (0.106 mol) and epichlorohydrin (0.106 mol) were mixed, followed by refluxing for 24 h with stirring under nitrogen atmosphere. Then, the mixture was washed with ethyl ether several times and dried in vacuum at 45 °C for 4 h to get a dark-red viscous liquid (e-Vimi Cl, 11.7 g, yield = 59%). The as-obtained IL monomer (0.054 mol) was dissolved in methanol (10 mL). NaBF4 (0.054 mol) was slowly added to the solution, followed by agitation at room temperature for 24 h. Then methanol was removed using a rotary evaporator. Next, the mixture was re-dissolved with acetone and filtered. Finally, the filtrate was evaporated and dried in vacuum at 40 °C for 4 h to give the pure compound (10.3 g, yield = 80%) as a brown viscous liquid, coded as e-Vimi BF4. The structure of e-Vimi BF4 was elucidated using 1H-NMR spectroscopy (Fig. S1 in ESI†) and high resolution electrospray ionization mass spectrometry (HR ESI MS) (Fig. S2 in ESI†). 1H-NMR, 400 MHz (D2O): δ 9.44 (s, 1H), 8.25 (t, 1H), 7.85 (t, 1H), 7.37 (q, 1H), 5.99 (dd, 1H), 5.47 (dd, 1H), 4.45 (dd, 1H), 4.17 (m, 2H), 2.09 (s, 2H). HR ESI MS: m/z 151.0889 [M]+; calcd for e-Vimi+m/z 151.0871; error 12 ppm.2.3 Synthesis of poly(ionic liquid)–thermally reduced graphene oxide (PIL–TrGO) hybrids
GO was prepared from graphite by the traditional Hummers method.24 Dry GO powder (0.2 g) was dispersed in deionized water (200 mL) at room temperature under mechanical agitation in a 50 °C bath sonicator for 40 min to get a solution, into which vitamin C (2 g) was added with stirring for 24 h in a water bath (80 °C). Next, the mixture was filtered and washed with deionized water, followed by freeze drying to get a black puffy powder, named chemically reduced graphene oxide (CrGO). Finally, the as-obtained CrGO powder was heated in a muffle at 900 °C for 1 min to get thermally reduced graphene oxide (TrGO).PIL-TrGO hybrids were prepared through in situ chemical polymerization of ILs on TrGO under mechanical agitation. In a typical procedure, TrGO (1 g) was dispersed in deionized water (500 mL) after ultrasound treatment for 10 min under mechanical agitation in a 50 °C bath sonicator to get a mixture. Then e-Vimi BF4 (0.04 mmol) dissolved in deionized water was added into the above mixture under ultrasonication for another 30 min. The AIBN solution (2 wt%) dissolved in n-propanol was added into the mixture, followed by in situ radical polymerization with stirring under refluxing for 22 h under N2 atmosphere. The crude was collected by centrifugation, washed several times with water, and freeze dried, successively, to get PIL–TrGO powder.
2.4 Preparation of PIL–TrGO/CE composites
Appropriate amounts of CE and PIL–TrGO were blended at 80 °C for 30 min with thorough stirring under sonication to get a mixture. The mixture was then heated to 160 °C and maintained at that temperature with vigorous stirring for 2 h to obtain a PIL–TrGO/CE prepolymer. The prepolymer was poured into a preheated mold and degassed under vacuum at 160 °C for 30 min, followed by putting into an oven for curing and postcuring under the conditions: 160 °C/2 h + 180 °C/2 h + 200 °C/2 h + 220 °C/2 h, and 240 °C/4 h, successively. The cured composites were coded as nPIL–TrGO/CE, where n is the mass percentage of PIL–TrGO hybrids in the whole composites, taking values of 0.2, 0.4, 0.6, 0.8 and 1.For comparison, the composites based on TrGO and CE resin were also prepared, which were coded as mTrGO/CE composites, where m is the mass percentage of TrGO in the whole composites, taking values of 0.1, 0.2, 0.3, 0.5, 0.6, 0.8 and 1.
2.5 Characterization
1H-NMR spectra were recorded on a Varian Unity Inova 400 MHz spectrometer (USA).HR ESI MS spectrum was recorded in a dilute methanol solution on an Agilent 6220 Accurate Mass TOF LC/MS spectrometer in positive ion mode.
X-ray photon spectroscopy (XPS) spectra were recorded on a Shimadzu-KRATOS Analytical-Axis ULTRA-DLD spectrometer (Britain) equipped with a monochromatized Al Kα X-ray source.
Fourier transform infrared (FTIR) spectra were recorded on a Nicolet-5700 spectrometer (USA) in the region 4000–400 cm−1 at a resolution of 2 cm−1 using the transmission mode. Each sample was blended and pressed into a KBr pellet.
A Ruili 1100 spectrophotometer (Cary 50, USA) was used to record the UV-vis spectra (200–800 nm) of samples to obtain their absorbance.
Fluorescence spectra of solid powders were recorded on a Nicolet F-2500 spectrometer (Japan). The excitation wavelength was selected as 226 nm.
Raman spectra were obtained on an Almega Dispersion Raman (HR800, Horiba Jobin Yvon, Japan) using a He–Ne laser (633 nm) at room temperature. The slit width was 100 μm and the confocal hole was 400 μm.
X-ray diffraction (XRD) patterns were recorded in the range of 2θ = 5–85° (2° min−1) using a Rigaku D/Max diffractometer (Rigaku Co. Ltd, Tokyo, Japan) with Cu-Kα radiation (k = 1.54056 Å) at 30 kV and 15 mA.
A scanning electron microscope (SEM, Hitachi S-4700, Japan), a transmission electron microscope (TEM, Hitachi H-600, Japan) and a high resolution transmission electron microscope (HRTEM, Tecnai G220, FEI, USA) were employed to observe the morphologies of samples. Composite samples for taking SEM pictures were stored in liquid nitrogen before breaking.
A digital four-probe resistivity meter (ST-2258A, Suzhou Jingge Electronic Co., Ltd, China) was applied to test DC conductivities.
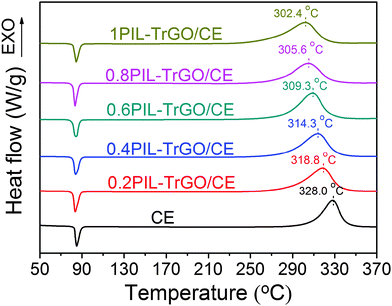
A differential scanning calorimetry (DSC) technique was used to study the curing behavior of each prepolymer on a TA calorimeter (Q200, TA) from 50 to 370 °C at a heating rate of 10 °C min−1 under a nitrogen atmosphere.
Electric and dielectric properties were measured on a broadband dielectric spectrometer (Novocontrol concept 80, Hundsange, Germany) at room temperature over the frequency range from 1 to 106 Hz. The dimensions of each sample were (25 ± 0.02) × (25 ± 0.02) × (3 ± 0.02) mm3.
3 Results and discussion
3.1 Design and characterization of PIL–TrGO hybrids
To overcome the poor adhesion between an IL and graphene as well as desorption during the fabrication process of composites,23 a novel graphene hybrid consisting of TrGO and a PIL was reported herein for the first time. Firstly, TrGO was modified with IL molecules through πcation–π interaction, and then IL molecules in situ homopolymerized on the graphene surface with each other through vinyl groups of e-Vimi BF4 (as shown in Fig. 2). Different from ILs, PILs form a complete coating layer on the graphene surface, which increases significantly the interaction between PILs and graphene, leading to a stabile dispersion of graphene via electrostatic repulsion.XPS spectra were recorded to evaluate the elemental compositions, chemical structures and protonation states of samples. As shown in Fig. 3, the elements of C, N and O in PIL–TrGO, TrGO and GO are obviously observed in survey spectra (Fig. 3a). The intensity of O1s of GO prepared using the traditional Hummers method is much higher than that of TrGO, indicating that after chemical and thermal reduction, the vast majority of oxygen-containing groups on GO sheets are removed, and only few carbonyl and carboxyl groups on the edge of graphene sheets are left, proving that the complete π-conjugate structure of TrGO sheets is re-formed again. The survey spectra of GO and TrGO are mainly composed of C and O, these elements also appear along with additional F and N elements in the spectrum of PIL–TrGO wherein the peak reflecting F (≈686 eV) arises from the ionic liquid anion (tetrafluoroborate), and that reflecting N (≈400 eV) comes from the 1-vinyl-3-epoxy limidazolium ion.
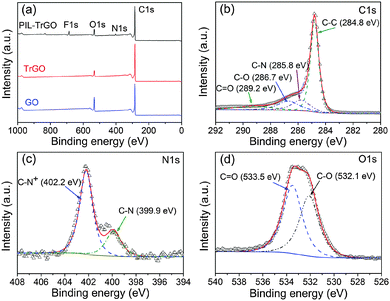 | ||
| Fig. 3 Deconvoluted XPS spectra: (a) survey spectra of PIL–TrGO, TrGO and GO; XPS core spectra of (b) C1s, (c) N1s, and (d) O1s of PIL–TrGO. | ||
In the C1s core-line spectrum of PIL–TrGO (Fig. 3b), the main peak is fitted with four peaks at 284.8 (C–C/C![[double bond, length as m-dash]](https://www.rsc.org/images/entities/char_e001.gif) C in graphene sheets), 285.8 (C–N of imidazolium groups in PILs), 286.7, and 289.2 eV (C–O and C
C in graphene sheets), 285.8 (C–N of imidazolium groups in PILs), 286.7, and 289.2 eV (C–O and C![[double bond, length as m-dash]](https://www.rsc.org/images/entities/char_e001.gif) O of unremoved oxygen-containing groups in graphene sheets, respectively)25. The N1s spectrum of PIL–TrGO (Fig. 3c) shows one peak at 402.2 eV, arising from the C–N+ on the imidazolium ring of PILs where N is tetravalent and thus has a higher electronegativity,26 while the other peak at 399.9 eV corresponds to the C–N. In the O1s core spectrum of PIL–TrGO (Fig. 3d), the peaks at 532.1 eV and 533.5 eV represent the C–O and C
O of unremoved oxygen-containing groups in graphene sheets, respectively)25. The N1s spectrum of PIL–TrGO (Fig. 3c) shows one peak at 402.2 eV, arising from the C–N+ on the imidazolium ring of PILs where N is tetravalent and thus has a higher electronegativity,26 while the other peak at 399.9 eV corresponds to the C–N. In the O1s core spectrum of PIL–TrGO (Fig. 3d), the peaks at 532.1 eV and 533.5 eV represent the C–O and C![[double bond, length as m-dash]](https://www.rsc.org/images/entities/char_e001.gif) O of unreduced groups on the edge of TrGO, respectively. Since XPS only reveals the nanoscale elemental binding-energy on the material surface, the appearance of new N1s and O1s peaks in the survey spectra and C–N/C–N+ in the core-line spectra of PIL–TrGO proves that PIL dipoles are successfully grafted onto the TrGO surface.
O of unreduced groups on the edge of TrGO, respectively. Since XPS only reveals the nanoscale elemental binding-energy on the material surface, the appearance of new N1s and O1s peaks in the survey spectra and C–N/C–N+ in the core-line spectra of PIL–TrGO proves that PIL dipoles are successfully grafted onto the TrGO surface.
A series of techniques including FTIR, UV-vis, fluorescence, Raman and XRD are utilized to detect the noncovalent interaction between PILs and TrGO. As shown in Fig. 4a, there are few peaks left in the FTIR spectrum of TrGO; the peaks at 3200–3600 cm−1 represent the remaining hydroxy moieties (C–OH), and the peaks at 1250–1050 cm−1 stand for epoxy groups on the TrGO surface.27 The peaks at 3140–3100 cm−1, 1655 cm−1, 1558 cm−1 and 1109–921 cm−1 in the FTIR spectrum of IL are attributed to the –C–H stretching of the alkyl chain, –C![[double bond, length as m-dash]](https://www.rsc.org/images/entities/char_e001.gif) N–28 and –C
N–28 and –C![[double bond, length as m-dash]](https://www.rsc.org/images/entities/char_e001.gif) N+–29 stretchings in the imidazolium ring and the characteristic absorption of epoxy groups, respectively. Among them, the characteristic peaks of the imidazolium ring and epoxy groups are also found in the FTIR spectrum of PIL–TrGO; however, the characteristic peak of –the C
N+–29 stretchings in the imidazolium ring and the characteristic absorption of epoxy groups, respectively. Among them, the characteristic peaks of the imidazolium ring and epoxy groups are also found in the FTIR spectrum of PIL–TrGO; however, the characteristic peak of –the C![[double bond, length as m-dash]](https://www.rsc.org/images/entities/char_e001.gif) N– has a red-shift with a gap of 6 cm−1; while the absorption peak of epoxy groups can be divided into two stretching vibration peaks centered at 1124 cm−1 and 1084 cm−1, clearly verifying the existence of a strong conjugated π–π interaction between limidazolium-rich PIL chains and TrGO sheets.
N– has a red-shift with a gap of 6 cm−1; while the absorption peak of epoxy groups can be divided into two stretching vibration peaks centered at 1124 cm−1 and 1084 cm−1, clearly verifying the existence of a strong conjugated π–π interaction between limidazolium-rich PIL chains and TrGO sheets.
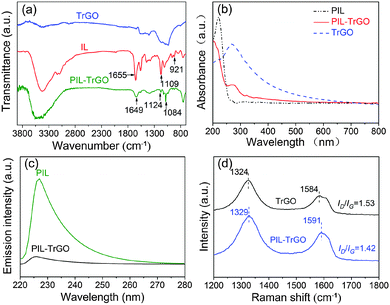 | ||
| Fig. 4 FTIR (a) and UV-vis (b) spectra of TrGO, IL and PIL–TrGO; fluorescence (c) and Raman (d) spectra of PIL and PIL–TrGO. | ||
The same phenomenon also occurs in UV-vis spectra (Fig. 4b). In detail, the maximum UV-vis absorption peak of TrGO appears at 270 nm (corresponding to π–π* transitions of aromatic rings),30 while that in the UV-vis spectrum of PIL–TrGO has a 10 nm blue-shift (Fig. 4b), further proving that there is a strong π–π interaction between PILs and graphene sheets.30 In addition, in fluorescence spectra of PILs and PIL–TrGO (Fig. 4c), the maximum emission (λmax) of PILs appears at 226 nm, yet that of PIL–TrGO dramatically decreases. This is because the π–π interaction is beneficial for efficient energy transfer of excitons,31 and thus strongly quenches the fluorescence intensity of PILs.
The π–π interaction of PILs and TrGO can be further characterized by Raman spectra. As displayed in Fig. 4d, the characteristic peaks at 1584 cm−1 and 1324 cm−1 are the G bond and D bond of carbon materials, respectively.32 The two peaks in the spectrum of PIL–TrGO shift by 5–6 cm−1 to higher wavenumbers compared with that of TrGO. These results indicate that electron-deficient PILs are grafted onto graphene's electron-rich surface through physical interaction, and the resultant PIL–TrGO hybrid has a better dispersion. In addition, the intensity ratio of D bond to G bond (ID/IG) for PIL–TrGO is 1.42, lower than that of TrGO (1.53). Because there is no chemical interaction between PILs and TrGO, so ID does not change. As a result, the decrease of ID/IG is attributed to the formation of a π–π conjugate structure between the imidazolium ring of PILs and delocalized π-electrons on the surface of TrGO.
Based on the above discussions, it is reasonable to conclude that there exists a strong πcation–π noncovalent interaction between PILs and graphene, which is the driving force to fabricate novel PIL–TrGO hybrids.
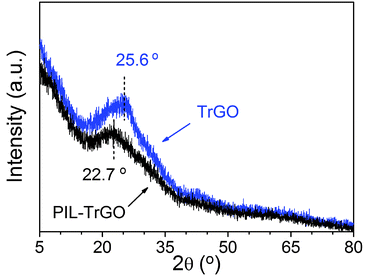
As well known, untreated graphene sheets tend to agglomerate and so it is even hard to gain a uniform dispersion in organic phase.33 The blue-shifts of G and D bonds of PIL–TrGO (Raman results in Fig. 4d) indicate that the thermally reduced GO is exfoliated into individual graphene sheets with an increased spacing during non-covalent functionalization with PILs. A similar conclusion is drawn from the XRD results. As shown in the XRD patterns of TrGO and PIL–TrGO (Fig. 5), the characteristic peaks of PIL–TrGO (002) shift from 25.6° to 22.7° after introducing PILs into TrGO sheets, so PIL–TrGO has a larger interlayer spacing34 than TrGO; in other words, the decoration of PILs onto graphene sheets efficiently reduces the van der Waals force and act as a spacer for graphene sheets.
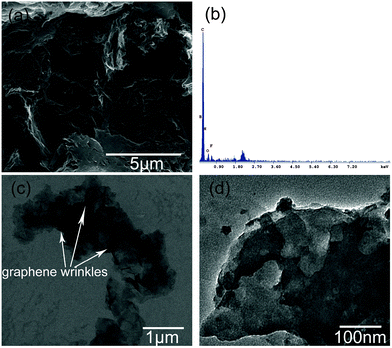
The morphology of the graphene hybrid is directly observed using SEM and TEM techniques. PIL–TrGO has a relatively flat and smooth surface (Fig. 6a) with B, F and N elements (Fig. 6b), suggesting that a thin PIL layer has been decorated onto the graphene sheets. The TEM picture (Fig. 6c) shows that graphene sheets have exfoliated into single or few layers; moreover, there are few unique wrinkle-like structures on graphene sheets, and the shadow refers to PIL layers anchored on graphene sheets as reported in the other modified graphene.35 The thin PIL layers can be observed more clearly in the HRTEM picture (Fig. 6d) where no sharp edges exist in PIL–TrGO hybrids.
In conclusion, PIL–TrGO was prepared through a strong πcation–π noncovalent interaction between PILs and TrGO; besides, the conjugated PIL effectively decreases the stacking effect of graphene, and thus exfoliate the aggregation of graphene sheets into a single or few layered structure. Therefore, the differences between PIL–TrGO and TrGO not only result from the presence of PILs, but also originate from the structure change of graphene induced by the presence of PILs.
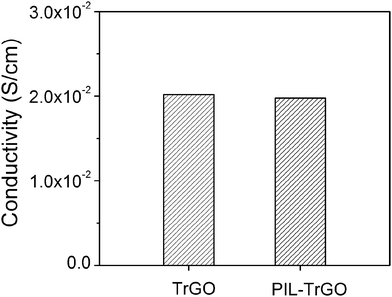
As noted, since the most attractive factor to choose graphene as the conductor is its unique electrical conductivity, so it is very essential for any modified graphene to inherit this merit. Fig. 7 gives DC conductivities of TrGO and PIL–TrGO. Clearly, the hybridized graphene has a similar good DC conductivity (10−2 S cm−1) as the original one.
3.2 Structures of TrGO/CE and PIL–TrGO/CE composites
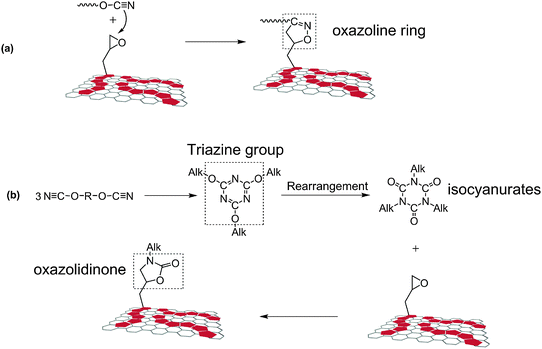
Fig. 8 displays the DSC curves of CE and PIL–TrGO/CE prepolymers. The exothermic peaks shift toward lower temperature with the addition of PIL–TrGO, and more loading of PIL–TrGO leads to lower temperature. This is because epoxy groups of PILs grafted onto graphene sheets can fasten the curing reaction by accelerating the homopolymerization of –OCN groups as well as copolymerizing with –OCN groups (Fig. 9).36,37Moreover, the copolymerization guarantees a good dispersion for PIL–TrGO in CE matrix, and provides a strong interaction between PIL–TrGO and CE. This will be further confirmed by observing the SEM images of fracture surfaces of TrGO/CE and PIL–TrGO/CE composites as shown in Fig. 10. In particular, TrGO powder exhibits a re-aggregated state and a wrinkle-like morphology, so there are many cavities in TrGO/CE composites (Fig. 10a and b). On the contrary, PIL–TrGO displays a separate and flat layered structure with good dispersion without cavities in CE resin (Fig. 10c and d), which is a favourable morphology for Hi-k materials.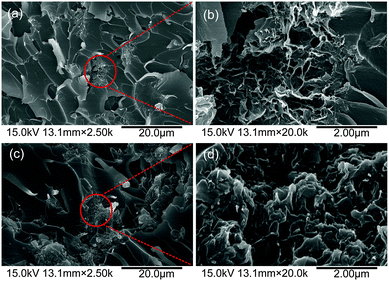 | ||
| Fig. 10 SEM images of fracture surfaces of TrGO/CE (a and b) and PIL–TrGO/CE (c and d) composites, where b and d are the enlarged pictures of the circled area in pictures a and d, respectively. | ||
3.3 Dielectric properties of TrGO/CE and PIL–TrGO/CE composites
Fig. 11 displays the frequency dependence of AC conductivity of TrGO/CE and PIL–TrGO/CE composites. The conductivities of PIL–TrGO/CE composites are clearly lower than those of TrGO/CE composites at the same filler content (f). This difference is attributed to different structures of TrGO and PIL–TrGO as well as those between their corresponding composites.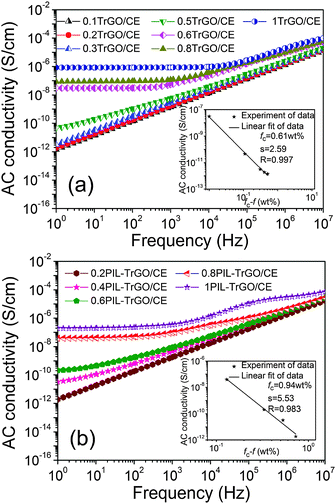 | ||
| Fig. 11 The electrical conductivity as a function of the filler content of TrGO/CE (a) and PIL–TrGO/CE (b) composites. The inset shows the log(σ) − log(fc − f) plot for fc > f. | ||
According to a least-squares fit of AC conductivities (at 1 Hz) of the composites for repeated experiments, as shown in the inset plots of Fig. 11a and b, the calculated fc values of TrGO/CE and PIL–TrGO/CE composites are 0.61 wt% (or 0.41 vol%) and 0.94 wt% (or 0.63 vol%), respectively. It is interesting to find that the fc of PIL–TrGO/CE composites remains at a relatively low level among the modified rGO/polymer composites reported,1,3,38–44 as summarized in Table S1 of the ESI.†
Fig. 12 displays the dependence of the dielectric constant on the frequency of TrGO/CE and PIL–TrGO/CE composites. As expected, the dielectric constant of either TrGO/CE or PIL–TrGO/CE composites shows a typical percolation phenomenon as the mass fraction of fillers increases. The dielectric constant of TrGO/CE composites presents a sudden increase to 75 (at 102 Hz) or 70 (at 103 Hz) when the filler content is around 0.6 wt% (Fig. 12). The steep increase of the dielectric constant of PIL–TrGO/CE takes place when the loading of PIL–TrGO reaches 1 wt%. The dielectric constants at 102 and 103 Hz of 1PIL–TrGO/CE are as high as 956 and 340 (Fig. 12), about 13 and 4.9 times that of 0.6TrGO/CE composites, respectively. In the literature, the permittivity of pristine graphene composites is in the range of 70–100 at 102 Hz,45,46 while that of modified graphene Hi-k composites is around 20–200 (at 103 Hz), as summarized in Table S1 of the ESI.† Hence, the PIL–TrGO/CE developed herein exhibits an obvious advantage, which can be attributed to the unique structure of PIL–TrGO.
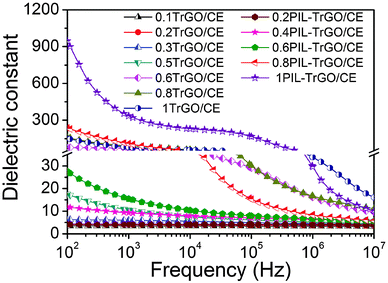 | ||
| Fig. 12 Dependence of the dielectric constant on the frequency of TrGO/CE and PIL–TrGO/CE composites at room temperature. | ||
As seen in Fig. 13, the capacitance of 1PIL–TrGO/CE composites is about one order of magnitude higher than that of 0.6TrGO/CE composites over a wide frequency range (102–106 Hz). In particular, on the one hand, PIL–TrGO has much better dispersion than TrGO in CE matrix, forming more micro-capacitor structures that is extremely important for achieving high capacitance. While, on the other hand, the cation–anion dipoles in the chains of PILs form polar interfaces with graphene, enhancing the Maxwell–Wagner–Sillars (MWS) interfacial polarization between PIL–TrGO and CE resin. It is well known that MWS polarization occurs whenever there is an accumulation of charge carriers at an interface between two kinds of materials.39 As the content of PIL–TrGO enlarges, the interfacial region rapidly increases and the MWS polarization significantly improves, which is the special nature that endows PIL–TrGO with a special advantage in improving the dielectric constant.
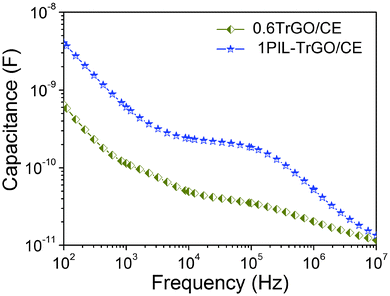 | ||
| Fig. 13 Dependence of capacitance on the frequency of TrGO/CE and PIL–TrGO/CE composites at room temperature. | ||
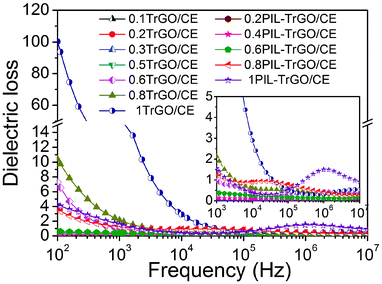
Fig. 14 shows the frequency dependence of dielectric loss of TrGO/CE and PIL–TrGO/CE composites. With the increase of the filler content, the dielectric loss gradually rises and jumps to a high value when the percolation phenomenon appears, which is the inevitable consequence of the highly enhanced conductivity of the CE composites.47 But there exist significant differences between TrGO/CE and PIL–TrGO/CE composites in frequency dependence of dielectric loss, particularly when the loading of fillers approaches the fc. Fig. 13 shows that 0.6TrGO/CE and 1PIL–TrGO/CE composites have the highest dielectric constants among their respective type of composites, yet 0.6TrGO/CE has higher dielectric loss (at 102 Hz) compared to 1PIL–TrGO/CE. It is known that leakage current and tunnelling current are two kinds of currents for electrical conductivity.48 Note that the leakage current plays a bigger role in conductivity than the tunnel current, while the former is dependent on the formation of conductive routes. Obviously, the dielectric loss of composites is closely related to the dispersion of conductors and the direct connection among conductors. Compared with TrGO, PIL–TrGO has better dispersion in CE resin as discussed above (Fig. 10); besides, the insulating PIL coating on the surface of graphene sheets avoids direct connection among TrGO. The two parameters result in significantly reduced dielectric loss.
Note that a broad peak located in the high-frequency region (104–107 Hz) is visible in the dielectric loss curve of PIL–TrGO/CE composites near fc (f = 0.8 wt% and 1 wt%). This relaxation peak should be ascribed to the MWS polarization mechanism. In particular, different from the static dielectric measurement, the dynamic dielectric loss can be divided into conductivity loss and polarization loss, while the latter results from the polarization relaxation process inside dielectric composites.49 In other words, the inherent dipoles of PILs are forced to resonate with the frequency of the electric field, so a part of energy supplied will dissipate in the form of heat. The relaxation peak appears when the polarization process falls behind the change of the external alternating electric field in the high-frequency region. In addition, more PILs introduced lead to higher dipoles density, and as a result, the polarization relaxation peak shifts toward higher frequency.
To study the dielectric strengthening mechanism of TrGO/CE and PIL–TrGO/CE composites, electrochemical impedance spectra (EIS) were simulated using two distinct equivalent circuits (Fig. 15). The equivalent circuit of TrGO/CE (Fig. 15a) consists of matrix resistance (Rm), contact resistance (Rc),50 charge-transfer resistance (Rct), matrix capacitance (Cm), contact capacitance (Cc), and charge-transfer capacitance (Cct). The constant phase angle element (CPE) is the calibration of the capacitance deviating from a pure capacitive behaviour.51 In comparison, an extra parallel circuit containing a CPEp and a polarization resistance (RP) is introduced into the equivalent circuit of PIL–TrGO/CE (Fig. 15b). Obviously, the better dispersion of graphene sheets in resin matrix can form vast micro-capacitor structures, and the insulative PIL polar layers introduce the polarization resistance in the meantime.
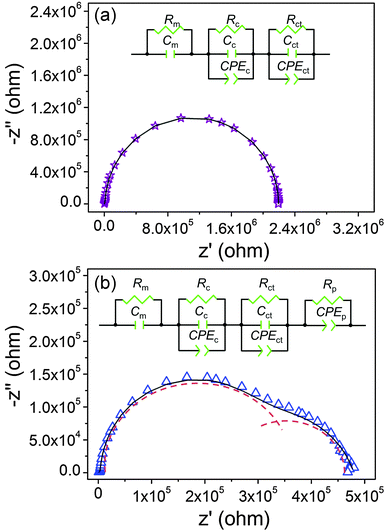 | ||
| Fig. 15 Experimental data (hollow circle) and fitting curves (solid line); the inset shows an equivalent circuit of the corresponding composite ((a) 0.6TrGO/CE; (b) 1PIL–TrGO/CE). | ||
The Nyquist analyses shown in Fig. 16 depict the relationship between real and imaginary components of complex impedance for TrGO/CE and PIL–TrGO/CE composites. As we know, the semicircle diameter in Nyquist plots is equivalent to the charge transfer resistance (Rct) for dielectric materials.52 The impedance can be considered as the synergy of the conductivity impedance and the polarization impedance, according to eqn (1) and (2):
| Z = ZR + ZP | (1) |
 | (2) |
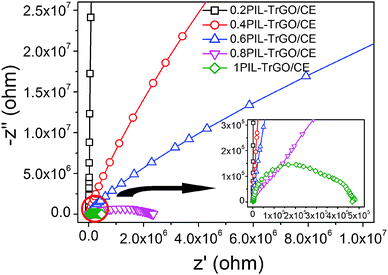 | ||
| Fig. 16 Impedance spectra of TrGO/CE and PIL–TrGO/CE composites. The inset is an enlarged version of the circled area. | ||
The Nyquist curves of TrGO/CE composites show traditional semicircle shapes (Fig. 15a), suggesting that the dielectric properties originate from the formation of electron channels by direct connection of graphene sheets, and therefore the charge transfer inside TrGO/CE composites is significantly enhanced.53 On the contrary, the Nyquist curve of 1PIL–TrGO/CE consists of two overlaid semicircles (Fig. 15b), the one in the low-frequency region (1–103 Hz) represents the polarization resistance (RP); in the high frequency region (103–107 Hz), ZP can be neglected owing to the polarization relaxation,54 so the semicircle in the high-frequency region (103–107 Hz) reflects the ZR of composites. The double-semicircle Nyquist plots demonstrate that the formation of conductive networks of graphene and the enhanced MWS polarization are two key factors for the improved permittivity of PIL–TrGO/CE composites. The enhanced MWS polarization is attributed to more polar interfaces induced by the interaction between cation–anion dipoles in PILs and graphene as well as more micro-capacitors resulted from good dispersion of PIL–TrGO. As the content of PIL–TrGO increases, either the semicircle diameter of Nyquist plots (Fig. 16) or the bulk resistance decreases, indicating the formation of conductive channels.
4 Conclusions
PILs are anchored onto graphene surfaces through πcation–π noncovalent interaction, forming a new kind of graphene hybrid (PIL–TrGO) with excellent conductivity as original graphene. This hybridization not only endows graphene with stable dispersion and good interaction with the CE resin matrix, but also exfoliates graphene sheets into single or few layered graphene sheets. These changes make TrGO/CE and PIL–TrGO composites to have many different structures and dielectric properties. PIL–TrGO/CE composites have a lower fc compared with those reported previously; when approaching the fc, the dielectric constant and loss (at 102 Hz) of PIL–TrGO/CE composites are about 13 and 0.57 times those of TrGO/CE composites, respectively. These attractive properties of PIL–TrGO/CE composites mainly originate from the different structures. In particular, the presence of PILs not only increases the number of micro-capacitor structures markedly, but also enhances the interfacial polarization and avoids direct connection among TrGO sheets.Acknowledgements
We thank the National Natural Science Foundation of China (51473107) and the Priority Academic Program Development of Jiangsu Higher Education Institution (PAPD) for financially supporting this project.Notes and references
- Z. C. Shi, S. G. Chen, R. H. Fan, X. A. Wang, X. Wang, Z. D. Zhang and K. Sun, J. Mater. Chem. C, 2014, 2, 6752–6757 RSC.
- Y. Yang, H. L. Sun, D. Yin, Z. H. Lu, J. H. Wei, R. Xiong, J. Shi, Z. Y. Wang, Z. Y. Liu and Q. Q. Lei, J. Mater. Chem. A, 2015, 3, 4916–4921 CAS.
- M. Tian, Z. Y. Wei, X. Q. Zan, L. Q. Zhang, J. Zhang, Q. Ma, N. Y. Ning and T. Nishi, Compos. Sci. Technol., 2014, 99, 37–44 CrossRef CAS.
- B. H. Wang, L. M. Liu, G. Z. Liang, L. Yuan and A. J. Gu, J. Mater. Chem. A, 2015, 3, 23162–23169 CAS.
- L. Rena, J. Zhao, S. J. Wang, B. Z. Han and Z. M. Dang, Compos. Sci. Technol., 2015, 114, 57–63 CrossRef.
- S. K. Yadav, I. J. Kim, H. J. Kim, J. Kim, S. M. Hong and C. M. Koo, J. Mater. Chem. C, 2013, 1, 5463–5470 RSC.
- Y. B. Tan and J. M. Lee, J. Mater. Chem. A, 2013, 1, 14814–14843 CAS.
- J. E. Johns and M. C. Hersam, Acc. Chem. Res., 2012, 46, 77–86 CrossRef PubMed.
- C. K. Chua and M. Pumera, Chem. Soc. Rev., 2013, 42, 3222–3233 RSC.
- L. Liao, Q. Xie, X. F. Guo and Z. F. Liu, Adv. Mater., 2015, 27, 4093–4096 CrossRef CAS PubMed.
- X. Q. Ji, L. Cui, Y. H. Xu and J. Q. Liu, Compos. Sci. Technol., 2015, 106, 25–31 CrossRef CAS.
- H. Wang, S. G. Bi, Y. S. Ye, Y. Xue, X. L. Xie and Y. W. Mai, Nanoscale, 2015, 7, 3548–3557 RSC.
- M. L. Jana, S. Saha, P. Khanra, P. Samanta, H. Koo, N. C. Murmu and T. Kuila, J. Mater. Chem. A, 2015, 3, 7323–7331 CAS.
- A. Ferreira, M. T. Martínez, A. Ansón-Casaos, L. E. Gómez-Pineda, F. Vaz and S. Lanceros-Mendez, Carbon, 2013, 61, 568–576 CrossRef CAS.
- S. H. Cho, M. Kim, J. S. Lee and J. Jang, ACS Appl. Mater. Interfaces, 2015, 7, 22301–22314 CAS.
- S. Bose, T. Kuila, M. E. Uddin, N. H. Kim, A. K. T. Lau and J. H. Lee, Polymer, 2010, 51, 5921–5928 CrossRef CAS.
- Z. X. Qiang, G. Z. Liang, A. J. Gu and L. Yuan, Mater. Lett., 2014, 115, 159–161 CrossRef CAS.
- J. W. Shang, Y. H. Zhang, L. Yu, X. L. Luan, B. Shen, Z. L. Zhang, F. Z. Lva and P. K. Chu, J. Mater. Chem. A, 2013, 1, 884–890 CAS.
- G. G. Eshetu, M. Armand, B. Scrosati and S. Passerini, Angew. Chem., Int. Ed., 2014, 53, 13342–13359 CrossRef PubMed.
- P. Xu, H. G. Gui, X. X. Wang, Y. D. Hu and Y. S. Ding, Compos. Sci. Technol., 2015, 117, 282–288 CrossRef CAS.
- J. C. Wang, J. L. Wu, W. Xu, Q. Zhang and Q. Fu, Compos. Sci. Technol., 2014, 91, 1–7 CrossRef CAS.
- J. T. Zhou, Z. J. Yao, W. J. Zhen, D. B. Wei and S. Q. Li, Mater. Lett., 2014, 124, 155–157 CrossRef CAS.
- S. T. Hsiao, C. C. M. Ma, H. W. Tien, W. H. Liao, Y. S. Wang, S. M. Li, C. Y. Yang, S. C. Lin and R. B. Yang, ACS Appl. Mater. Interfaces, 2015, 7, 2817–2826 CAS.
- W. S. Hummers, Jr. and R. E. Offeman, J. Am. Chem. Soc., 1958, 80, 1339 CrossRef.
- H. Mao, J. C. Liang, H. F. Zhang, Q. Pei, D. L. Liu, S. Y. Wu, Y. Zhang and X. M. Song, Biosens. Bioelectron., 2015, 70, 289–298 CrossRef CAS PubMed.
- S. H. Cho, M. Kim, J. S. Lee and J. Jang, ACS Appl. Mater. Interfaces, 2015, 7, 22301–22314 CAS.
- M. Jana, P. Khanra, N. C. Murmu, P. Samanta, J. H. Lee and T. Kuila, Phys. Chem. Chem. Phys., 2014, 16, 7618–7626 RSC.
- A. Pourjavadi, S. H. Hosseini, M. Doulabi, S. M. Fakoorpoor and F. Seidi, ACS Catal., 2012, 2, 1259–1266 CrossRef CAS.
- A. F. Aslanov, N. I. Korotkikh and O. P. Shvaika, Chem. Heterocycl. Compd., 1996, 32, 914–917 CrossRef.
- T. Chen, J. H. Qiu, K. J. Zhu, J. H. Li, J. W. Wang, S. Q. Li and X. L. Wang, J. Phys. Chem. B, 2015, 119, 4521–4530 CrossRef CAS PubMed.
- A. Mandal and A. K. Nandi, J. Phys. Chem. C, 2012, 116, 9360–9371 CAS.
- Z. T. Zhu, X. Sun, H. R. Xue, H. Guo, X. L. Fan, X. C. Pan and J. P. He, J. Mater. Chem. C, 2014, 2, 6582–6591 RSC.
- L. D. Li, J. B. Yin, Y. Liu and X. P. Zhao, J. Mater. Chem. C, 2015, 3, 5098–5108 RSC.
- M. Acik, D. R. Dreyer, C. W. Bielawski and Y. J. Chabal, J. Phys. Chem. C, 2012, 116, 7867–7873 CAS.
- W. F. Zhao, Y. S. Tang, J. Xi and J. Kong, Appl. Surf. Sci., 2015, 326, 276–284 CrossRef CAS.
- F. Ren, G. M. Zhu, P. G. Ren, Y. K. Wang and X. P. Cui, Appl. Surf. Sci., 2014, 316, 549–557 CrossRef CAS.
- G. Wang, R. G. Wang, G. Fu, T. L. Gao, C. M. Fu, H. Kuang, F. Yang, W. C. Jiao, L. F. Hao and W. B. Liu, Polym. Eng. Sci., 2015, 55, 2591–2602 CAS.
- T. Chen, J. H. Qiu, K. J. Zhu, X. Y. He, X. Kang and E. L. Dong, Mater. Lett., 2014, 128, 19–22 CrossRef CAS.
- S. Wageh, L. He, A. A. A. Ghamdi, Y. A. A. Turki and S. C. Tjong, RSC Adv., 2014, 4, 28426–28431 RSC.
- W. S. Tong, Y. H. Zhang, Q. Zhang, X. L. Luan, Y. Duan, S. F. Pan, F. Z. Lv and Q. An, Carbon, 2015, 94, 590–598 CrossRef CAS.
- W. S. Tong, Y. H. Zhang, L. Yu, F. Z. Lv, L. P. Liu, Q. Zhang and Q. An, Chem. Phys. Lett., 2015, 638, 43–46 CrossRef CAS.
- D. Ljubic, M. Srinivasan, R. Szoszkiewicz, I. Javni and Z. S. Petrovic, Eur. Polym. J., 2015, 70, 55–65 CrossRef CAS.
- Y. H. Li, Y. J. Shi, F. Y. Cai, J. Xue, F. Chen and Q. Fu, Composites, Part A, 2015, 78, 318–326 CrossRef CAS.
- K. Yang, X. Y. Huang, L. J. Fang, J. L. He and P. K. Jiang, Nanoscale, 2014, 6, 14740–14753 RSC.
- T. X. Wang, G. Z. Liang, L. Yuan and A. J. Gu, Carbon, 2014, 77, 920–932 CrossRef CAS.
- T. Chen, J. H. Qiu, K. J. Zhu, J. H. Li, J. W. Wang, S. Q. Li and X. L. Wang, RSC Adv., 2014, 4, 64061–64067 RSC.
- J. W. Zha, X. Zhu, Y. H. Wu, S. J. Wang, R. K. Y. Li and Z. M. Dang, J. Mater. Chem. C, 2015, 3, 7195–7202 RSC.
- J. F. Chang, G. Z. Liang, A. J. Gu, S. D. Cai and L. Yuan, Carbon, 2012, 50, 689–698 CrossRef CAS.
- Y. Wang, H. T. Guan, C. J. Dong, X. C. Xiao, S. F. Du and Y. D. Wang, Ceram. Int., 2016, 42, 936–942 CrossRef CAS.
- J. W. Zha, W. K. Li, R. J. Liao, J. B. Bai and Z. M. Dang, J. Mater. Chem. A, 2013, 1, 843–851 CAS.
- Y. Y. Li, Z. Z. Yang, H. X. Qiu, Y. G. Dai, Q. B. Zheng, J. Li and J. H. Yang, J. Mater. Chem. A, 2014, 2, 14139–14145 CAS.
- S. J. Guo, D. Wen, Y. M. Zhai, S. J. Dong and E. Wang, Biosens. Bioelectron., 2011, 26, 3475–3481 CrossRef CAS PubMed.
- Y. W. Hu, S. C. Hua, F. H. Li, Y. Y. Jiang, X. X. Bai, D. Li and L. Niu, Biosens. Bioelectron., 2011, 26, 4355–4361 CrossRef CAS PubMed.
- P. B. Ishai, M. S. Talary, A. Caduff, E. Levy and Y. Feldman, Meas. Sci. Technol., 2013, 24, 102001 CrossRef.
Footnote |
| † Electronic supplementary information (ESI) available: Fig. S1 shows the 1H NMR (400 Hz, D2O) spectrum of e-Vimi BF4; Fig. S2 shows the high resolution electrospray ionization mass spectrum of e-Vimi BF4; Table S1 summarizes the dielectric constants and fc values of graphene/polymer composites at 1 kHz. See DOI: 10.1039/c6tc00209a |
| This journal is © The Royal Society of Chemistry 2016 |


