 Open Access Article
Thermochemistry study and improved thermal stability of Yb14MnSb11 alloyed by Ln3+ (La–Lu)
I. G.
Vasilyeva
*a,
R. E.
Nikolaev
a,
M. N.
Abdusaljamova
b and
S. M.
Kauzlarich
c
aNikolaev Institute of Inorganic Chemistry, Siberian Branch of the Russian Academy of Sciences, 3, Acad. Lavrentieva Pr., Novosibirsk 630090, Russia. E-mail: kamarz@niic.nsc.ru
bInstitute of Chemistry of the Tajik Academy of Sciences, 229/2, Aini Street, 734063 Dushanbe, Tajikistan
cDepartment of Chemistry, University of California, One Shields Ave, Davis, CA 95616, USA
First published on 15th March 2016
Abstract
Two series of crystals were prepared via Sn flux synthesis with the compositional fluxes of Yb14−xLnxMnSb11, where x = 0.1–0.9 and x = 0.4. By X-ray structural measurements and microprobe analysis, the maximum amount of Ln incorporated in the unit cell matrix were determined to be 0.37 ± 0.04 for the La–Nd and 0.45 ± 0.04 for Sm–Tm elements with solid substitution solution formation. The Ln incorporation did not change the unit cell significantly but the cell volume decreased going from the largest La–Nd to the smallest Tm–Lu cations. The Ln0.30–0.40 samples demonstrated congruent melting and their melting points increased by ∼30–50 °C compared to the pristine matrix. The temperatures were attributed to the ordered structural state due to the Ln distribution in the unit cell only through the one regular system site. Based on geometrical fitting between crystal radii of Yb2+ and Ln3+ in six-coordination, the Yb(2) sites were found to be more preferable for substitution by La–Nd, Yb(1) by Sm–Ho and Yb(3) by Tm and Lu atoms. Thermal losses as a temperature function of the alloyed by La and Lu samples were determined by a step-by-step heating procedure with analysis of the vapor condensate deposited on the viewing window of the chamber. This experiment demonstrated a high mobility of the tetrahedral Mn and Sb along with Yb ions in the Yb14MnSb11 matrix with incongruent sublimation beyond 1300 °C and a decrease of the thermal weight losses by half if the matrix was alloyed by La. Occupation of the Yb sites by Ln atoms varied the geometry of the MnSb4 tetrahedron as well as electron properties and bonding in this structural fragment, and these changes are considered in the context of the coupling between chemical structure and thermal stability of the compounds. The improved thermal stability due to increasing the total ionic state of the alloyed samples was found to possibly be a useful factor for the long-time use of these materials for space applications.
Introduction
The compound Yb14MnSb11 is of interest as a thermoelectric material for space power applications due to its high efficiency compared with that of Si–Ge without a significant change in the electronic or thermal transport properties up to 1000 °C.1–3 All the physical measurements showed that Yb14MnSb11 does not decompose or change phase within the temperature range needed for deep space power generation.1 However, in recent years, it has been found that Yb14MnSb11 degrades at 1000 °C in a vacuum with a loss of volatile component Yb and the unacceptably high sublimation are today critical factors restricting practical applications of the material.4–6 In the search of ways to suppress high sublimation, we studied the coupling between chemical structure and thermodynamic stability of Yb14MnSb11.An expected strategy to improve efficiency for applications of Yb14MnSb11 is to consider mixed cations in the Yb14−xLnxMnSb11 compounds. Doping of Yb14MnSb11 by Ln3+ might be a way to improved thermal stability due to replacing Yb2+ by Ln3+ with the vapor pressures at 1000 °C being ten orders of magnitude lower than that of Yb, and La, Gd and Lu showed the least vapor pressure. The change should reduce the total vapor pressure under the alloyed solids and therefore their sublimation rate. In recent years, the solid solutions with Ln3+ = La, Ce, Gd, Tb–Ho, Tm and Lu have received substantial attention with an emphasis on optimization of the thermoelectric properties through tuning of the carrier concentration of the matrix.7–12 Alloying by Ln improved these properties of Yb14MnSb11; however, no data were reported on how the dopant influences the thermal stability.
Thermodynamics, as is known, is the most reliable tool for scientific predictions of stability, but no experimental thermodynamic data, including those on gas phase species and their pressures, were found in the literature for Yb14−xLnxMnSb11. In this case, one can start with the study of high-temperature behavior of the compounds controlling melting temperature, which is a quantitative measure of thermodynamic stability. However, a special experimental technique is required to get reliable data of this type for Yb14−xLnxMnSb11 presenting refractory and evaporating incongruently before their melting. We present an original photoemission thermal analysis technique combined with the comprehensive diagnostics of solid and gaseous intermediates and final products. The technique was developed specially for refractory and incongruently sublimating compounds to determine melting point and vapor evolving from the heated sample and condensation on the window of the apparatus (the most cold collector).13–15
In the present study, we report the synthesis of the Yb14−xLnxMnSb11 (Ln = La–Lu) compounds and characterization of their thermodynamic stability and kinetic lability focused on measurements of melting point (m.p.) and thermal weight losses related to given temperatures. Because the melting point is connected with the bond length–bond-strengths relations of the complex Ca14AlSb11, with a structure consisting of a variety of distinct structural units, the thermal data obtained allowed for finding the structural fragment responsible for thermodynamic instability most efficiently. This information may be useful to look broadly on the problem of sublimation suppression ensuring of the long-time use of the Yb14MnSb11 material for aerospace applications.
Experimental section
The previous studies on the Yb14−xLnxMnSb11 solid solutions showed that a limited amount of rare earth in the matrix was found to be between 0.03 and 0.8 although the value of x = 0.40 was given most often.7–12 To estimate the Ln maximum amount introduced into the matrix, we synthesized via the Sn flux two series of the solid solutions Yb14−xLnxMnSb11 with Ln = La–Lu except Ce and Eu. The first series started from a nominal amount of dopant varying by 0.1, 0.3, 0.5, 0.7 and 0.9; the second one was based on the composition Yb13.6Ln0.4MnSb11. The Yb14−xLnxMnSb11 crystals with a given amount of Ln were grown from a molten Sn flux in a glassy carbon crucible sealed in fused silica and heated to 1000 °C, followed by cooling to 700 °C at a 2 °C h−1 rate and centrifugation for 5 minutes according to published procedures.16 Massive agglomerates were obtained in both series from which small single crystals were isolated for further characterization. With an optical microscope, two groups of crystals, perfect and imperfect, with extended defects, were selected for each the Ln system.The crystals were analyzed using a JXA-8100 (JEOL, Japan) Electron Probe Micro-analyzer equipped with a wavelength-dispersive spectrometer. Elemental intensities for Yb, Mn, Sb and Ln were determined relative to single crystal standards using YbPO4 and LnPO4 for rare earth elements, SnO2 for Sn, metallic Sb for Sb, and Al-garnet for Mn. About 20 points of quantitative data were collected for the major phase of each crystal and converted to crystal-chemical formulas by assuming 26 atoms per formula unit. Averages and standard deviations were calculated to be ±0.04, which were consistent with the 3σ criteria. Only 3–5 points were collected for minor phases resulting only in a formula without standard deviation.
XRD patterns of several crystals crushed were obtained using a PhilipsPW1830 detector and graphite-monochromatic CuKα radiation. The lattice parameters and volumes were calculated by treatment of experimental data using the Rietveld method with the PCW2.3 program and reference sample Yb14MnSb11 (PDF: 89-783) with parameters a = 16.578(4) Å and c = 21.897(8) Å.
The thermal analysis apparatus was able to work over the wide temperature range of 25–2400 °C, under static helium pressure in chamber 0.1–7.0 bar and with heating rates 1000–3000 °C min−1.13 Open sample holder (Mo crucible) forced on the W/W–Re (20%) thermocouple and placed inside a W-heater outputted a water-cooled chamber. An infrared photodiode mounted on an optical microscope recorded the emitted thermal radiation of a sample through the optical quartz window as curves in dU/dτ–T coordinates, wherein evaporation, melting and boiling processes, as well as high-velocity structural transitions maintained themselves as peaks. In addition, visual observation under a microscope for heated samples was possible as well as determining the composition and amount of the vapor, solid intermediates and final products. This provided a reliable interpretation of the sample state and thermal processes occurring. The technique was more than once used in the study of thermal stability of different types of compound evaporation under quasi-equilibrium conditions in the discrimination of temperature ranges studying both intermediate stages of the thermal decomposition and short exposures of samples to the highest temperatures.13–15
The melting point (m.p.) was measured under conditions of the highest helium pressure, the highest rate of uninterrupted heating to provide the vapor–solid quasi-equilibrium in the open holder due to the “pressure piston” effect. It prevented the vapor leakage from the holder in the chamber and the initial composition remained constant up to the end of heating without decomposition. Thermal losses were measured with the discontinuous heating. In this case, the sample heating to a desired temperature was stopped followed by characterization of solid and gas-condensed products, and then the same sample was heated to another temperature.
To get a high degree of reliability in the thermal data, special care was given to the validity of the melting point measurement. All statistical (instrumental and methodical) errors of the thermal analysis were minimized by standardization of the experimental conditions due to calibration of the apparatus with certified reference materials: Cu (1085 °C), Au (1064 °C), Pd (1554 °C), Pt (1772 °C) and sapphire (2050 °C). Calibration was presented as a corresponding mathematical linear polynomic equation that allows measuring temperature with 1.5% accuracy. To minimize the reproducibility (random) errors we focused on the sample quality and estimated contribution of imperfections (second phases, spatial chemical inhomogeneity, poor microstructure) in dispersion of the measured values. We repeated every measurement several times to obtain undistorted temperature values.
Results and discussion
The Ln amount was determined by EMPA for all the Yb14−xLnxMnSb11 crystals of the first series and the results are presented in Fig. 1. One can observe that the Ln amount increased with the amount in the flux but crystals from the same batch often showed composition scatter (for example, between 0.11 and 0.30) and marked differences in the secondary phases content; in this case, the more credible values were reported. Moreover, the general essence of the data coincides with the maximum Ln content grouped around 0.37 ± 0.04 for the La–Nd and 0.45 ± 0.04 for Sm–Tm elements per formula unit. The results agreed well with those known from the literature obtained for samples prepared via the Sn flux with identical conditions.7–12 A variable chemical content between 0.4 and 0 was observed for the Lu-doped crystals that at first was hard to explain.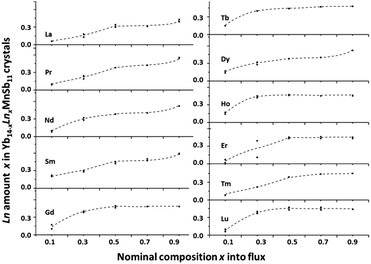 | ||
| Fig. 1 Ln content x in Yb14−xLnxMnSb11 crystals versus synthetic content x = 0.1–0.9. Composition error fits into the size of the points. | ||
For crystals with Pr, Nd, Sm and Dy prepared from the flux with x > 0.7, the solubility was found to be higher than 0.6 Ln per formula unit. It seems that in this case, the greater Yb nonstoichiometry occurred because a high level of Yb-containing secondary phases in the samples and any metastable phases with other point defects and additional sites in the lattice suitable to be filled by Ln atoms were formed. For these crystals, the abnormally high unit cell volume (≫1%) and melting points (>30 °C) were also observed supporting the hypothesis that the structural perturbation from the Ln3+ substitution is important.
To eliminate the secondary phase effect, the second series of the samples with x = 0.4, being close to the maximum Ln solubility but lying within the homogeneity range, were grown. For samples looked perfect and microstructure analysis showed only trace amounts of secondary phases, which were undetectable by XRD. The composition repeatability and chemical homogeneity of these alloyed crystals taken randomly from the same batch are presented in Table 1.
| Electron microprobe composition |
|---|
| Yb13.58(6)La0.42(4)Mn1.04(2)Sb10.83(3) |
| Yb13.62(5)La0.38(5)Mn1.05(2)Sb11.10(5) |
| Yb13.62(5)La0.36(5)Mn1.05(2)Sb11.10(5) |
| Yb13.66(4)Pr0.34(4)Mn1.01(2)Sb10.84(4) |
| Yb13.70(4)Pr0.30(2)Mn1.01(1)Sb10.77(3) |
| Yb13.66(5)Pr0.34(6)Mn1.01(1)Sb10.70(4) |
| Yb13.65(6)Nd0.35(3)Mn1.05(2)Sb10.93(4) |
| Yb13.63(5)Nd0.37(2)Mn1.05(2)Sb10.85(4) |
| Yb13.69(5)Nd0.31(3)Mn1.04(2)Sb10.78(3) |
| Yb13.71(5)Sm0.29(2)Mn1.12(2)Sb11.04(5) |
| Yb13.65(6)Sm0.35(7)Mn1.13(2)Sb11.03(4) |
| Yb13.67(7)Sm0.33(5)Mn1.12(2)Sb10.99(5) |
| Yb13.50(7)Gd0.50(2)Mn1.10(2)Sb10.93(6) |
| Yb13.53(6)Gd0.47(4)Mn1.10(2)Sb10.82(4) |
| Yb13.51(6)Gd0.49(2)Mn1.10(1)Sb10.83(5) |
| Yb13.54(7)Tb0.46(2)Mn1.12(2)Sb10.90(5) |
| Yb13.53(5)Tb0.47(2)Mn1.08(2)Sb10.84(6) |
| Yb13.54(6)Tb0.46(2)Mn1.08(2)Sb10.87(5) |
| Yb13.56(4)Dy0.44(3)Mn1.11(1)Sb11.19(3) |
| Yb13.55(6)Dy0.45(2)Mn1.12(2)Sb11.17(4) |
| Yb13.57(3)Dy0.43(2)Mn1.12(1)Sb11.20(4) |
| Yb13.57(5)Ho0.43(4)Mn1.12(1)Sb10.84(6) |
| Yb13.55(5)Ho0.45(1)Mn1.11(1)Sb10.89(4) |
| Yb13.55(5)Ho0.45(1)Mn1.11(2)Sb10.86(5) |
| Yb13.55(5)Er0.45(2)Mn1.11(2)Sb10.90(6) |
| Yb13.55(3)Er0.45(2)Mn1.11(2)Sb10.86(5) |
| Yb13.61(11)Er0.39(11)Mn1.09(2)Sb10.80(5) |
| Yb13.55(4)Tm0.45(2)Mn1.10(2)Sb10.80(6) |
| Yb13.54(5)Tm0.46(1)Mn1.11(1)Sb10.72(5) |
| Yb13.72(18)Tm0.28(17)Mn1.10(2)Sb10.81(5) |
| Yb13.69(6)Lu0.31(4)Mn1.12(2)Sb10.86(4) |
| Yb13.74(15)Lu0.26(16)Mn1.11(1)Sb10.84(5) |
| Yb13.94(5)Lu0.06(2)Mn1.11(2)Sb10.81(5) |
The absence of secondary phases and a good compositional reproducibility between three crystals within a 0.04 standard deviation and their inner homogeneity are summarized in Table 1. In this series, the average amount of Ln incorporated into Yb14MnSb11 was found to be 0.35(4) Ln per formula unit for the La–Sm crystals and 0.46(4) for the Gd–Tm crystals. It can be noted that the amounts were similar to the amounts of Ln found in the first series and to all the crystals prepared via the Sn flux by other authors. We believe that these values are within the limits of experimental error and can be taken as a limiting solubility of the Ln elements in the Yb14MnSb11 lattice at 700 °C knowing that the flux was quenched in air at this temperature.
The standard uncertainty was higher for some crystals with Sm, Tm, Er and especially with Lu wherein some crystals from the same batch contained 0.2–0.4 Lu per formula and some crystals were missing Lu. The same chemical anomaly of the Yb14−xLuxMnSb11 solid solutions was observed by other authors.10 This may be explained by the smallest Lu3+ radius as compared with Yb2+. The Lu atom being even inside the smallest of the 6-coordinated Yb sites might move quite freely and therefore the 14-1-11 structure can become unstable and prone to rearrangement and changes of the Lu coordination number.
The slight difference in the solubility limit between the large and small Ln cations forced focus on the structural changes produced by doping. All the crystals from the second series were found to be isostructural to the Ca14AlSb11 structural type describing the space group I41/acd with eight formula units. Yb14MnSb11, has a large unit cell consisting of 14 Yb2+ cations with four octahedral Yb sites surrounded by six Sb atoms, a distorted [MnSb4]9− tetrahedron, a Sb37− linear trimer, and four isolated Sb3− anions. This structure, as is known, is a highly tunable, and partial substitution of each from the three of these elements allows the fundamental parameters (the carrier concentration, mobility, effective mass, and lattice thermal conductivity) to be modified with the rational optimization of zT.1 The high enough hole concentration (∼1021 cm−3) of Yb14MnSb11 can be reduced by the valence imbalance using the substitution of Ln3+ for Yb2+ and the compensation mechanism of the heterovalent isomorphism for the high-temperature p-type thermoelectric material Yb14MnSb11 is accepted to be general for all Ln elements according to many studies.7–9,11,17 The Ln3+ donates an additional electron, moves the Fermi level closer to the band edge and reduces the initial hole concentration by one hole per formula unit (electronic effect). For Yb13.6La0.4MnSb11, as an example, the 15% enhancement of zT at 1200 K compared with Yb14MnSb11 was found due to increase of Seebeck coefficient and electrical resistivity; moreover, the change disorder from locating La on the Yb site had a small effect on the thermal conductivity and the carrier mobility.9
At the same time, replacing an Yb2+ with a Ln3+ cation increased the lattice parameters of the alloyed crystals relative to the pristine matrix due to a reduction in the distortion of the [MnSb4]9− tetrahedron increasing its bond lengths and angles (steric effect). The changes of the lattice parameters of the alloyed samples of the second series relative to the pristine Yb14MnSb11 were less than 1%, almost the same as mentioned earlier for the similar alloyed solid solutions.7–9 The tendency to decrease the unit cell volume of the Yb13.6Ln0.4MnSb11 crystals going from La to Lu is because of the change of the Ln crystal radius, but the dependence was far from linear, as observed in Fig. 2. There are three groupings of rare earth elements with large, middle and small radii and the dependence may be explained by the Ln distribution among the different Yb sites. No special structure refinement of the alloyed crystals was carried out here, but numerous data from the previous studies give assurance to assume that large La, Pr and Nd atoms (≤3% difference in size with Yb2+) by analogy with Ce atoms8 preferentially occupying the more distorted, least coordinated Yb(2) sites with the largest volume according to Hirshfeld surface analysis of chemical bonding in Yb14MnSb11.2 The middle atoms Sm–Ho (5–11% difference in size) prefer to substitute on the Yb(1), as it was found experimentally in the case with Tb, Dy and Ho.11 Then, the Yb(3) with the smallest volume may favor the smaller Tm–Er cations (<13% difference) and this idea was supported by other experiments establishing that Yb(3) is indeed more favorable to small cations.2,17 For the smallest Lu ion (difference >14%), even the smallest octahedral site may be very large to maintain the structure type and in this case some surprises in the Lu content, its distribution in the matrix and melting point were quite expected.
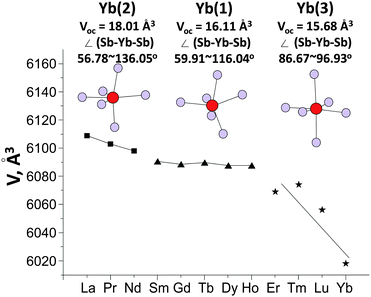 | ||
| Fig. 2 Unit cell volume of Yb13.6Ln0.4MnSb11 crystals with crystallographically distinct Yb(2), Yb(1) and Yb(3) sites versus the Ln radius. | ||
According to the relationship of the MnSb4 tetrahedron with the four Yb sites,2,8,11,17 the La–Nd dopants in the Yb(2) sites positioned close to MnSb4 tetrahedron result in an increase in the ionic bond strength inside this structural fragment. The change in the ionic character of MnSb4 occurs to a lesser extent in the case of Sm–Ho atoms in the Yb(1) and the Er–Tm in Yb(3) positions located farther from the tetrahedron. The structural stability of Yb14−xLnxMnSb11, as it is known, is determined by the strength of the bonds between the structural fragment MnSb4 and the Yb atoms and then the ionic addition from the tetrahedron to the total binding energy between atoms in the 14-1-11 structure must maintain the crystals more stable and increase their melting point.
A precise procedure determining the melting point as a measure of the thermodynamic stability of Yb14MnSb11 crystals alloyed with large and small Ln cations was realized by uninterrupted heating to full melting with a 3000 °C min−1 rate under about 7 bar of helium pressure and rapid cooling of the melt. To be sure that a “pressure piston” was really obtained, the thermal losses for the samples with La, Gd and Lu were examined by determination of Yb, Ln, Mn, Sb in the vapor condensate by AES ICP. For the homogeneous crystals without visible extended defects, the losses were within 0.5–0.7 mass% demonstrating conservation of the pristine composition without decomposition until melting. For imperfect crystals with the minor phases and residual Sn flux, the losses increased up to 1–3% due to their decomposition/evaporation. Then, Sn appeared in the vapor condensate and melting of the major phase dropped up to 25–30 °C (the measurement error was ±1.5%).
Fig. 3 demonstrates typical elemental maps of perfect and imperfect crystals together, with heating curves recording up to the samples full melt. Peaks of small intensity appeared at about 1220 °C and 1470 °C due to melting/decomposition of MSnx and YbMn2Sb2 when their contents were more than 1%. Both the indicators, Sn in the vapor condensate and dropping melting temperature allowed us to come close to a correct determination of the desired thermal parameters relating them only to exactly phase pure crystals. For these crystals, no effects other than melting were detected on the experimental heating curves (Fig. 3, mid-position). This allowed us to attribute the measured melting temperature to the pristine 14-1-11 structure of the tested crystals, being sure that no solid change phase happened over this short time (one to two minutes).
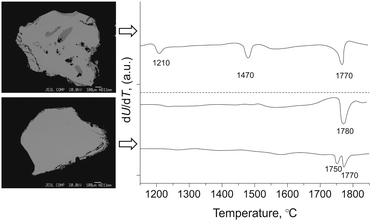 | ||
| Fig. 3 Composition maps and heating curves for the imperfect (top) and perfect (bottom) crystals for Yb13.7La0.3MnSb11 (upper curve) and Yb13.6La0.4MnSb11 (lower curve). | ||
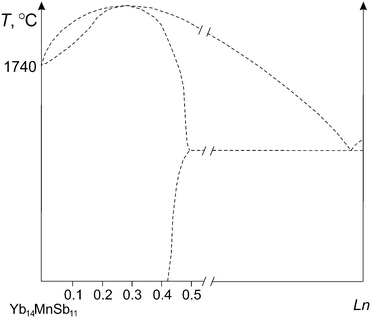
The precise measurement of the sample melting point was difficult and the main cause of the scattered data was a mixture of the crystals with different composition taken from the same batch. To eliminate this factor, the melting procedure was performed with 10–12 random crystals and the values with overall maximum uncertainty in ±5 °C were taken as melting points of the perfect crystals. It can be noted that heating curves in this case were composed of one peak, indicating congruent melting of the crystals. At the same time, heating curves of the crystals from the first series with lower (Ln0.10, Ln0.20, Ln0.28) and greater (Ln0.46 and Ln0.48) compositions had a two-peak form and were sometimes badly resoluble suggesting incongruent melting that is typical of solid solutions. The composition variability of the crystals from the same batch was the main obstacle to determine exactly which composition melted congruently but it should be close to x = 0.3 for La–Nd and x = 0.4 for others. Based on the thermal experiment, one can easily suggest a general type of the hypothetical T–x diagram of the Yb14MnSb11–Ln system (except Lu) with an irrational maximum of the engaged liquidus and solidus curves related to compositions named above, which is shown in Fig. 4. This type of the T–x diagram is acceptable because with really low (∼1%) alloy content solid solutions should be formed only with Ln rather than with any binary Ln–Sb phase. In accordance with the crystal-chemical concept, the solid solutions that melted congruently should be the maximum ordered that is realized if the Ln atom is distributed in the unit cell only through the one regular system crystallographic sites. In this case, the stabilization effect of the structure type 14-1-11 appeared due to heterovalent isomorphic substitution with Ln.
It can be noted that the ordering effect of the Yb14−xLnxMnSb11 was also detected by measuring other properties. For the Ce0.32 sample with Ce occupancy, only the Yb(2) position was typical of ferromagnetic ordering, whereas for the Ce0.45 sample with Ce on the Yb(2) and Yb(4) sites, the ferromagnetic ordering temperature decreased and the effective paramagnetic moments increased abnormally.8 Atoms11 Ho0.40 and Dy0.48 were distributed only in Yb(1) sites, whereas Ho0.45 atoms took both Yb(1) and Yb(3) positions showing an abnormal saturation moment that was almost 2 μB larger than expected.
Fig. 5 demonstrates for all the series of rare earth elements changes in the melting points measured with a high reliability on the crystals having the maximum ordered composition. One can observe again three groups of crystals distinguished significantly by melting point and these results support the correlation with crystallographically distinct Yb sites. This thermal experiment showed that melting point correlated well with order as follows: a highly ordered structure obtained to a high melting point and disorder provides a low melting point. An increase in thermodynamic stability of the solid solutions Yb13.6Ln0.4MnSb11, especially for the La–Nd elements, is clearly defined here. These elements in Yb(2) sites shifted the melting point temperature upward considerably more than other rare earth elements of smaller size. It is worth noting that the improved of thermoelectrical properties shown above for Yb13.6La0.4MnSb11 was supported here additionally by enhanced thermodynamic stability. It will also be so for Ce solid solutions, with magnetic properties that are found to be very attractive.8,10,13
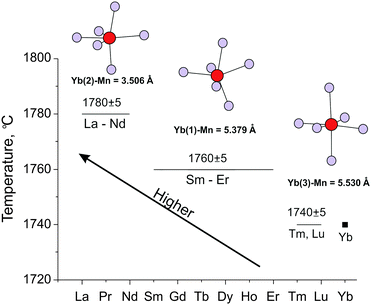 | ||
| Fig. 5 Melting points of Yb13.7Ln0.3MnSb11 (La–Nd) and Yb13.6Ln0.4MnSb11 (Sm–Tm) crystals with crystallographically distinct Yb(2), Yb(1) and Yb(3) sites versus the Ln radius. | ||
The congruent melting of the crystals, as shown above, is realized if no volatilization processes occur before melting. Although, numerous physical measurements up to 1100 °C demonstrate the Yb14MnSb11 stability without decomposition and the phase change,1–3 large mass losses of Yb14MnSb11 at 1000 °C in vacuum was found due to the Yb volatilization4–6 and today vapor pressure of the compounds becomes a critical factor.
We started with a search for the structural fragment in the Yb14MnSb11 cell that might be converted to vapor being the first. To estimate the structural dynamics of the 14-1-11 compound, results of two methods predicting the mobility of atoms and the structural stability were considered. High mobility of the Mn and Sb atoms in the MnSb4 tetrahedron as Yb bound with it without any structural transition up to 900 K was deduced from the Debye equation (the vibrational displacements).9 In crystal-chemical terms, this tetrahedron with the small Mn cation, screened well by four larger Sb anions, has no tendency to association and being isolated. It should show a marked volatility resulting in sublimation with decomposition of the compound. The decomposition was supported by direct observation of solid near-surface Yb4Sb3 layers during the Yb14MnSb11 sublimation process.4–6
To clarify the process, we studied the thermal stability of Yb14−xLaxMnSb11 by heating the samples, condensing the escaping gas and characterizing both these vapor and solid products in detail. The process was studied in an open crucible with the vapor condensation on the viewport window. A large amount of the vapor condensate is a serious factor decreasing the sensitivity of the photodiode, in recording through the window, towards the sample transitions on the heating curves. Therefore, the heating rate and the helium pressure in the chamber were chosen so as to measure, with high reliability, any transitions of the sample and the vapor amount and 3000 °C min−1 and 7 bar of He in the chamber were found to be the best conditions. To provide good reproducibility of results concerning the vapor composition and amount as temperature functions in the 1100–1800 °C interval, a special standard procedure with the same heating rate, temperature, helium pressure and limited gas exchange in the chamber was used for all the samples. This procedure involved heating to a desired temperature, opening of the chamber to analyze the vapor condensate and repeat heating of the same sample to another temperature. Analysis on the Yb, Mn, Sb, and Sn elements was performed by ICP AES after washing the vapor condensate from the window by a hot acid solvent. It can be noted that additional Mn amounts produced by the secondary phase MnSnx decomposition were insignificant here and the scatter of the results due to non-controlled composition of tested crystals taken from the same batch fit within ∼15%. The vapor composition in atomic terms is presented in Table 2.
| Weight of crystal | Temperature, °C and vapor composition |
|---|---|
| La0.37 6.93 mg | 1395 → 1580 → 1790 |
| No vapor → YbMn0.4Sb0.1 → YbMn0.4Sb0.6 | |
| La0.37 6.79 mg | 1575 → 1796 |
| YbMn0.33Sb0.4 → YbMn0.2Sb0.44 | |
| La0.37 5.06 mg | 1796 |
| YbMn0.2Sb0.7 | |
| Lu0.30 5.69 mg | 1450 → 1597 → 1787 |
| YbMn5Sb0.3 → YbMn0.5Sb0.4 → YbMn0.4Sb0.6 | |
| Lu0.30 4.0 mg | 1587 → 1797 |
| YbMn0.35Sb0.28 → YbMn0.31Sb0.15 | |
| Lu0.30 4.41 mg | 1800 |
| YbMn0.35Sb0.2 |
According to Table 2, as expected, the La and Lu elements were absent in the vapor and no condensate was observed up to 1350 °C under these conditions (meaning the 7 atm of He and the 3000 °C min−1 heating rate) against previous conditions wherein sublimation was observed at 1000 °C in high vacuum. The temperature-dependent onset evaporation under these conditions (pressure or vacuum, rapid polythermal or static isothermal heating) was additional proof of the incongruent sublimation of Yb14−xLnxMnSb11 with decomposition. Above 1350 °C, the weight losses always including the Mn, Sb, and Yb species, increased for all the crystals but differently than demonstrated in Fig. 6. Herein, the general tendency to improved thermal stability of Yb14MnSb11 alloyed by Ln3+ is best shown.
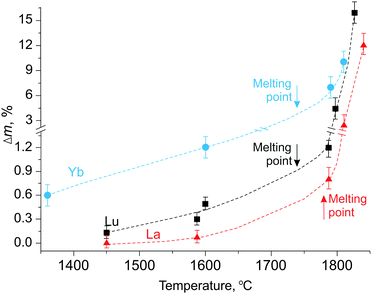 | ||
| Fig. 6 Thermal losses under 7 bar inert gas in a chamber as a function of temperature for pristine and alloyed Yb14MnSb11 by La and Lu crystals. | ||
We believe that the data obtained in this study is a serious base for correct formulation of future tensimetric experiments making the sublimation of Yb14−xLuxMnSb11 a controllable process, whereas increasing both the thermodynamic and kinetic stability of Yb14MnSb11 due to doping by the largest La–Nd ions opens many interesting directions of research and technological applications.
Conclusions
Boundary of isomorphic substitution of Yb2+ for Ln3+ in the Yb14−xLnxSb11 (La–Lu) solid solutions was determined to be 0.37 ± 0.04 for La–Nd, 0.45 ± 0.04 for Sm–Tm and between 0 and 0.3 for Lu using X-ray diffraction and microprobe analysis. Inside the homogeneous range of the solid solutions, compositions about Ln0.30 (La–Nd) and Ln0.4 (Sm–Tm) were found to be congruently melting. This was attributed to their ordered state with the dopant distribution through the one regular system of crystallographic sites. Occupation of the Yb positions as close as possible and far from MnSb4 tetrahedrons resulted in a progressive transformation from the covalent state into an ionic one inside the tetrahedrons. This ionic addition to the total binding energy between atoms in the Yb14−xLnxMnSb11 structure made the crystals more stable and increased their melting points by 30–50 °C. The data obtained herein demonstrate that the evaporation of Yb14MnSb11 at elevated temperatures is provided by mobile Mn, Sb and Yb atoms and the thermal losses may be decreased in halve by doping the matrix with La. It may be a challenge for providing long term stability of the material for space power applications.Acknowledgements
This study was supported by the International Science & Technology Center (ISTC), #Project T-2067. We express appreciation to Dr N. G. Naumov and Dr M. S. Tarasenko for their assistance in some of the structural experiments.References
- S. R. Brown, S. M. Kauzlarich, F. Gascoin and G. J. Snyder, Chem. Mater., 2006, 18, 1873–1877 CrossRef CAS.
- S. Kastbjerg, C. A. Uvarov, S. M. Kauzlarich, E. Nishibori, M. A. Spackman and B. B. Iversen, Chem. Mater., 2011, 23, 3723–3730 CrossRef CAS.
- E. S. Toberer, A. F. May and G. J. Snyder, Chem. Mater., 2010, 22, 624–634 CrossRef CAS.
- J. A. Paik, E. Brandon, T. Caillat, R. Ewell and J. P. Fleurial, Proceedings of Nuclear and Emerging Technologies for Space, 2011 (NETS-2011), Albuquerque, 2011, pp. 616–622 Search PubMed.
- J. A. Nesbitt, E. J. Opila and M. V. Nathal, J. Electron. Mater., 2012, 41, 1267–1270 CrossRef CAS.
- J. A. Nesbitt, J. Electron. Mater., 2014, 43, 3128–3137 CrossRef CAS.
- J. H. Roudebush, J. Grebenkemper, Y. Hua, N. Kazem, M. N. Abdusalyamova and S. M. Kauzlarich, J. Solid State Chem., 2014, 211, 206–211 CrossRef CAS.
- J. H. Grebenkemper and S. M. Kauzlarich, APL Mater., 2015, 3, 041503 CrossRef.
- E. S. Toberer, S. R. Brown, T. Ikeda, S. M. Kauzlarich and G. J. Snyder, Appl. Phys. Lett., 2008, 93, 062110 CrossRef.
- C. Yu, Y. Chen, H. Xie, G. J. Snyder, C. Fu, J. Xu, X. Zhao and T. Zhu, Appl. Phys. Express, 2012, 5, 031801 CrossRef.
- J. H. Grebenkemper, M. N. Abdusalyamova, F. Makhmudov and S. M. Kauzlarich, Magnetic Remanence in Yb14−xRExMnSb11 (RE = Tb, Dy, Ho) Single Crystals, private report.
- B. C. Sales, P. Khalifah, T. P. Enck, E. J. Nagler, R. E. Sykora, R. Jin and D. Mandrus, Phys. Rev. B: Condens. Matter Mater. Phys., 2005, 72, 205207 CrossRef.
- J. I. Gibner and I. G. Vasilyeva, J. Therm. Anal., 1998, 53, 151–160 CrossRef.
- I. G. Vasilyeva and R. E. Nikolaev, J. Alloys Compd., 2008, 452, 89–93 CrossRef CAS.
- A. V. Utkin, N. I. Baklanova and I. G. Vasilyeva, J. Solid State Chem., 2013, 201, 256–261 CrossRef CAS.
- I. R. Fisher, T. A. Wiener, S. L. Bud'ko, P. C. Canfield, J. Y. Chan and S. M. Kauzlarich, Phys. Rev. B: Condens. Matter Mater. Phys., 1999, 59, 13829 CrossRef CAS.
- H. Kim, P. Klavins and S. M. Kauzlarich, Chem. Mater., 2002, 14, 2308–2316 CrossRef CAS.
| This journal is © The Royal Society of Chemistry 2016 |

