 Open Access Article
Creative Commons Attribution 3.0 Unported Licence
New garnet structure phosphors, Lu3−xYxMgAl3SiO12:Ce3+ (x = 0–3), developed by solid solution design†
Haipeng
Ji
ab,
Le
Wang
*c,
Maxim S.
Molokeev
 de,
Naoto
Hirosaki
b,
Zhaohui
Huang
*a,
Zhiguo
Xia
f,
Otmar M.
ten Kate
b,
Lihong
Liu
b and
Rongjun
Xie
*b
aNational Laboratory of Mineral Materials, Beijing Key Laboratory of Materials Utilization of Nonmetallic Minerals and Solid Wastes, School of Materials Science and Technology, China University of Geosciences (Beijing), Beijing 100083, China. E-mail: huang118@cugb.edu.cn
bSialon Group, National Institute for Materials Science, 1-1 Namiki, Tsukuba 305-0044, Japan. E-mail: XIE.Rong-Jun@nims.go.jp
cCollege of Optical and Electronic Technology, China Jiliang University, Hangzhou 310018, China. E-mail: calla@cjlu.edu.cn
dLaboratory of Crystal Physics, Kirensky Institute of Physics, SB RAS, Krasnoyarsk 660036, Russia
eDepartment of Physics, Far Eastern State Transport University, Khabarovsk, 680021, Russia
fThe Beijing Municipal Key Laboratory of New Energy Materials and Technologies, School of Materials Sciences and Engineering, University of Science and Technology Beijing, Beijing 100083, China
First published on 26th February 2016
Abstract
New garnet phosphors, Lu3−xYxMgAl3SiO12:Ce3+ (x = 0–3), which can be efficiently excited by blue light and emit the yellow-orange light, were developed using the solid solution design strategy combining the chemical unit substitution and the cation substitution. Crystal structures of the four compounds were reported for the first time via the Rietveld refinement of their powder XRD patterns. All phosphors show the general cubic garnet structure with the space group Ia![[3 with combining macron]](https://www.rsc.org/images/entities/char_0033_0304.gif) d. The specific occupancy of Lu/Y, Al/Mg, Al/Si and O atoms in different positions was identified. The evolution of cell parameters and Y/Lu/Ce–O bond lengths were identified. Photoluminescence properties were evaluated on aspects of emission/excitation spectra, internal/external quantum efficiency and thermal emission stability. Under the 450 nm blue light excitation, the phosphors exhibit bright yellow color emission, peaking in the 575–597 nm spectral range. The internal and external quantum efficiency can reach 83% and 58%, respectively. The emission red-shift in response to the Y/Lu ratio variation was discussed in relation to the local structure evolution. The phosphors are relatively promising to act as wavelength converter of blue light in white light emitting diodes.
d. The specific occupancy of Lu/Y, Al/Mg, Al/Si and O atoms in different positions was identified. The evolution of cell parameters and Y/Lu/Ce–O bond lengths were identified. Photoluminescence properties were evaluated on aspects of emission/excitation spectra, internal/external quantum efficiency and thermal emission stability. Under the 450 nm blue light excitation, the phosphors exhibit bright yellow color emission, peaking in the 575–597 nm spectral range. The internal and external quantum efficiency can reach 83% and 58%, respectively. The emission red-shift in response to the Y/Lu ratio variation was discussed in relation to the local structure evolution. The phosphors are relatively promising to act as wavelength converter of blue light in white light emitting diodes.
Introduction
Nowadays, white light emitting diodes (wLEDs) hold an increasing share in the lighting market, and are regarded as a more efficient technology to transform electricity into light compared with the conventional lighting bulbs/lamps, thus enabling a significant reduction in the carbon dioxide emission worldwide. In the current solid state lighting market, the predominant technical path to achieve white light output relies on the phosphor-converted white light emitting diodes (pc-wLEDs) based on a blue LED plus down-conversion phosphor materials.1 The typical “blue GaN LED + yellow (Y,Gd)3(Al,Ga)5O12:Ce3+ phosphor” model yields cool white light with relatively high correlated color temperature (>4000 K), which satisfies the outdoor lighting purpose. However, for indoor lighting and other occasions where high color rendering index (CRI) and low correlated color temperature (CCT) are needed, warmer white light from wLEDs is more desired. Therefore, several other packaging options such as “blue LED + green/orange(red) phosphors” and “near-UV LED + blue/green/red phosphors” are proposed, with the aim of producing white light with high CRI and low CCT. Since the near-UV InGaN LEDs still need significant improvements to achieve efficiency comparable to that of blue LEDs, the development of new phosphors that are well excitable by blue light is more urgent than the ones excitable by near-UV light.In this paper, we report four new phosphors that have their maximum excitation wavelength at 450–470 nm and exhibit an intense yellow color emission. The compositions, Lu3−xYxMgAl3SiO12:Ce3+ (x = 0–3), were developed by the solid solution design strategy starting from Lu3Al5O12:Ce3+. The solid solution design is an efficient route to develop new phosphors with diverse composition creations. The commonly used solid solution design method concentrates on the cation/anion substitution2–6 and the chemical unit substitution.7–9 The benefits vary from the red/blue-shift tuning of the peaking emission,2,4 the bi-model band emission,3,9 to the improved structural rigidity10 or anti-moisture stability.11 For example, the Sr/Ca substitution in Ca3(PO4)2:Eu2+ is observed to red-shift the emission from violet-blue to yellow where unique two emission bands can co-exist with tunable relative intensity.3,4 The Sr/Ba substitution in Ba2SiO4:Eu2+ is able to optimize the valence band of the host lattice and thus, enhance the structural rigidity and improve the thermal emission stability.10
Compared with the other strategies for discovering/developing new phosphors, such as the combinatorial chemistry screening,12 or the single-particle-diagnosis approach,13,14 the solid solution design does not fully grant “novel” phosphors; in most cases, “new phosphors” or “phosphors with optimized compositions” are obtained. However, compared with the combinatorial chemistry screening strategy, the solid solution design approach eliminates the need for massive preparation of the phosphor library, making the composition design more targeted. Moreover, the solid solution design needs no such extra special instruments, which are significantly relied on in the single-particle-diagnosis method, in order to characterize the composition/structure/luminescence of an interesting particle but only in the size of several micrometers. Furthermore, the new phosphor creations developed by the solid solution design always exhibit predictable optical properties, making them more reliable to achieve desired performances. Besides, based on our experience, it is worth noting that, actually, one can also get “novel” phosphors with composition and crystal structure absolutely different from the “parent” phosphors using the solid solution design between two non-isostructural compounds.2 For example, Ba2Ca(PO4)2:Eu2+ is a cyan emitting phosphor compound developed by the solid solution design method between the non-isostructural violet light-emitting Ca3(PO4)2:Eu2+ and Ba3(PO4)2:Eu2+ with its crystal structure remaining unsolved.2
In this paper, the solid solution design will be simultaneously processed in two different manners, combining the chemical unit substitution and the cation substitution. Firstly, by substitution of the Mg2+–Si4+ pair for the Al3+–Al3+ pair in Lu3Al5O12:Ce3+, we designed the phosphor phase of Lu3(MgAl)(Al2Si)O12:Ce3+. This process can also be regarded as chemical units of MgO6/SiO4 replacing AlO6/AlO4 polyhedra, respectively. Then, the Lu atoms are gradually substituted by bigger Y atoms, forming a series of (Lu3−xYx)(MgAl)(Al2Si)O12:Ce3+ phosphors (x = 0–3). Crystal structures of these four phosphors were refined via the Rietveld method and reported for the first time; their photoluminescence properties, on aspects of excitation/emission spectra, quantum efficiency, and thermal emission stability, were characterized regarding their potential application in blue LED chip based wLED lighting. Furthermore, the red-shift tuning of the emission was discussed and correlated with the local coordinating environment evolution around Ce3+ in this series.
Experimental
Synthesis
Powder phosphor samples with the composition formula (Lu3−xYx)MgAl3SiO12:Ce3+ (x = 0–3) were prepared by firing the homogeneously-ground mixtures of high purity (>99.9%) Lu2O3, Y2O3, MgO, Al2O3, SiO2, and CeO2 under reducing H2 (5%)–N2 (95%) flow at 1450 °C for 5 h. All samples were doped with 6 atom% (nominal) Ce3+. Phosphor compositions quoted hereafter are their nominal ones.Characterization
Powder XRD data were collected on an X-ray diffractometer (Smartlab, Rigaku, Tokyo, Japan) with CuKα radiation (λ = 1.54056 Å), operating at 45 kV and 200 mA and using a step size of 0.02° with a scan speed of 8° per minute over the 2θ range 15–120°. Crystal structure refinements employing the Rietveld method were implemented using the TOPAS software.15 Photoluminescence spectra were recorded on a fluorescence spectrophotometer (F-4500, Hitachi Ltd, Tokyo, Japan) using a 200 W Xe-lamp as an excitation source. The calculation of the internal and external quantum efficiencies of the phosphor sample can be easily found elsewhere in our previous publications.16,17 A combined setup including a Xe-lamp, a Hamamatsu MPCD-7000 multichannel photodetector and a computer controlled heater was used to evaluate the temperature-dependent photoluminescence. The phosphor powder was loaded on a circular plate which was heated to the test temperature and held at that temperature for 5–10 min to guarantee a uniform temperature distribution between the surface and the interior of the sample.Results and discussion
General crystal structure
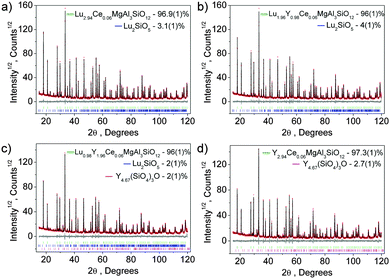
Although we notice that the crystal structure refinement of Lu3MgAl3SiO12 was tried recently by others,18 their structural report is not ideal; for example, the sum occupancy of an identical site even fails to be 1. The composition of Y3MgAl3SiO12:Ce3+ has been previously mentioned in a study on Y3Al5−2y(Mg,Si)yO12:Ce (y = 0–2)19 but its crystal structure was not refined. Therefore, we would like to report our refinement results of the crystal structure of Lu3MgAl3SiO12, as well as that of its three analogue compounds, Lu3−xYxMgAl3SiO12:Ce3+ (x = 1–3). Almost all peaks of the four XRD patterns can be well indexed by a cubic cell (Ia![[3 with combining macron]](https://www.rsc.org/images/entities/char_0033_0304.gif) d) with parameters close to Lu3Al5O12; only a small amount (wt < 4%) of Lu2SiO5 and/or Y4.67(SiO4)3O impurities was observed in some of the patterns.
d) with parameters close to Lu3Al5O12; only a small amount (wt < 4%) of Lu2SiO5 and/or Y4.67(SiO4)3O impurities was observed in some of the patterns.
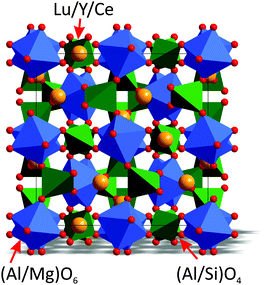
The crystal structure of Lu3Al5O1220 was taken as a starting model for the Rietveld refinements. In garnets with the general formula A3B2C3O12, atoms A, B and C occupy the positions 24c, 16a, and 24d, respectively.21 In our refinements, the C site was occupied by Al3+/Si4+ ions, the B site was occupied by Al3+/Mg2+ ions, and the A site was occupied by Lu3+/Y3+/Ce3+ with fixed occupancies according to their nominal chemical formulas. The observed (black), calculated (red), and difference (gray) XRD profiles for the refinements are shown in Fig. 1. The main parameters of the processing are provided in Table 1. Coordinates of atoms are listed in Table 2 and the main bond lengths are provided in Table S1 (ESI†). Crystallographic information files (CIF) of the four samples are given in the ESI.† Crystal structures of Lu3−xYxMgAl3SiO12:Ce3+ show the general cubic garnet structure, as illustrated in Fig. 2. By saying “general garnet structure”, we intend to distinguish it from an inverse garnet structure; a typical example for such structure is Ca3Sc2Si3O12.
| x | Phases | Weight (%) | Space group | Cell parameters (Å, °), V (Å3) | R wp, Rp (%), χ2 | R B (%) |
|---|---|---|---|---|---|---|
| 0 | Lu3MgAl3SiO12:Ce | 96.9(1) |
Ia![[3 with combining macron]](https://www.rsc.org/images/entities/char_0033_0304.gif) d d |
a = b = c = 11.95958(6), V = 1710.60(3) | 10.37, 7.71, 1.29 | 1.88 |
| Lu2SiO5 | 3.1(1) | C2/c | a = 14.275(1), b = 6.6734(6), c = 10.369(1), β = 122.097(6), V = 836.8(1) | 3.90 | ||
| 1 | Lu2YMgAl3SiO12:Ce | 96(1) |
Ia![[3 with combining macron]](https://www.rsc.org/images/entities/char_0033_0304.gif) d d |
a = b = c = 11.99518(6), V = 1725.92(3) | 12.02, 8.88, 1.45 | 1.73 |
| Lu2SiO5 | 4(1) | C2/c | a = 14.304(3), b = 6.695(2), c = 10.402(3), β = 122.10(2), V = 843.8(4) | 3.12 | ||
| 2 | LuY2MgAl3SiO12:Ce | 96(1) |
Ia![[3 with combining macron]](https://www.rsc.org/images/entities/char_0033_0304.gif) d d |
a = b = c = 12.0257(1), V = 1739.14(5) | 11.81, 8.75, 1.43 | 1.62 |
| Lu2SiO5 | 2(1) | C2/c | a = 14.337(6), b = 6.711(3), c = 10.408(6), β = 122.10(3), V = 848.3(8) | 2.87 | ||
| Y4.67(SiO4)3O | 2(1) | P63/m | a = b = 9.4062(8), c = 6.7256(9), V = 1739.14(5) | 11.81, 8.75, 1.43 | 4.49 | |
| 3 | Y3MgAl3SiO12:Ce | 97.3(1) |
Ia![[3 with combining macron]](https://www.rsc.org/images/entities/char_0033_0304.gif) d d |
a = b = c = 12.0589(1), V = 1753.57(4) | 14.04, 10.65, 1.60 | 1.96 |
| Y4.67(SiO4)3O | 2.7(1) | P63/m | a = b = 9.4062(8), c = 6.7256(9), V = 1739.14(5) | 5.08 | ||
| x | y | z | B iso | Occupancy | |
|---|---|---|---|---|---|
| Lu3MgAl3SiO12:Ce | |||||
| Lu | 0 | 1/4 | 1/8 | 0.54 (4) | 0.98 |
| Ce | 0 | 1/4 | 1/8 | 0.54 (4) | 0.02 |
| Al1 | 0 | 1/4 | 3/8 | 0.43 (6) | 2/3 |
| Si1 | 0 | 1/4 | 3/8 | 0.43 (6) | 1/3 |
| Al2 | 0 | 0 | 0 | 0.20 (7) | 1/2 |
| Mg2 | 0 | 0 | 0 | 0.20 (7) | 1/2 |
| O | −0.0310 (3) | 0.0546 (3) | 0.1532 (3) | 0.39 (9) | 1 |
| Lu2YMgAl3SiO12:Ce | |||||
| Lu | 0 | 1/4 | 1/8 | 0.56 (5) | 0.6533333 |
| Y | 0 | 1/4 | 1/8 | 0.56 (5) | 0.3266667 |
| Ce | 0 | 1/4 | 1/8 | 0.56 (5) | 0.02 |
| Al1 | 0 | 1/4 | 3/8 | 0.45 (7) | 2/3 |
| Si1 | 0 | 1/4 | 3/8 | 0.45 (7) | 1/3 |
| Al2 | 0 | 0 | 0 | 0.20 (8) | 1/2 |
| Mg2 | 0 | 0 | 0 | 0.20 (8) | 1/2 |
| O | −0.0323 (3) | 0.0535 (3) | 0.1536 (3) | 0.7 (1) | 1 |
| LuY2MgAl3SiO12:Ce | |||||
| Lu | 0 | 1/4 | 1/8 | 0.64 (5) | 0.3266667 |
| Y | 0 | 1/4 | 1/8 | 0.64 (5) | 0.6533333 |
| Ce | 0 | 1/4 | 1/8 | 0.64 (5) | 0.02 |
| Al1 | 0 | 1/4 | 3/8 | 0.61 (6) | 2/3 |
| Si1 | 0 | 1/4 | 3/8 | 0.61 (6) | 1/3 |
| Al2 | 0 | 0 | 0 | 0.29 (7) | 1/2 |
| Mg2 | 0 | 0 | 0 | 0.29 (7) | 1/2 |
| O | −0.0327 (3) | 0.0524 (3) | 0.1530 (2) | 0.70 (9) | 1 |
| Y3MgAl3SiO12:Ce | |||||
| Y | 0 | 1/4 | 1/8 | 0.51 (6) | 0.98 |
| Ce | 0 | 1/4 | 1/8 | 0.51 (6) | 0.02 |
| Al1 | 0 | 1/4 | 3/8 | 0.49 (7) | 2/3 |
| Si1 | 0 | 1/4 | 3/8 | 0.49 (7) | 1/3 |
| Al2 | 0 | 0 | 0 | 0.43 (8) | 1/2 |
| Mg2 | 0 | 0 | 0 | 0.43 (8) | 1/2 |
| O | −0.0326 (3) | 0.0519 (3) | 0.1538 (2) | 0.59 (9) | 1 |
Structure evolution and polyhedral distortion
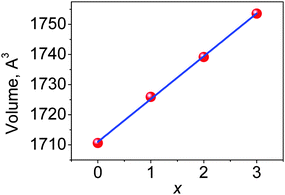
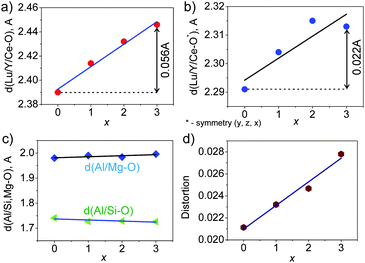
A practically linear increase of the cell volume V per x, as shown in Fig. 3, proves that the bigger Y ions are gradually incorporated in the compounds replacing Lu according to the designed chemical compositions. Moreover, the increase of d(Lu/Y–O) bond lengths with increasing x (Fig. 4(a and b)) also evidences the incorporation of Y ions in these compositions. Meanwhile, the nearly unchangeable bond lengths, d(Al/Mg–O) and d(Al/Si–O), as shown in Fig. 4(c), suggest that the Al/Si and Al/Mg ratios at respective sites in these compounds stay constant, which is in agreement with the designed chemical formulas. Moreover, it should be noted that the two groups of d(Lu/Y/Ce–O) bond lengths exhibit different rates of increase (Fig. 4(a and b)) with variation in x, and this leads to the deformation of the (Lu/Y/Ce)O8 polyhedron.The displacement of CeO8 can be in the form of symmetric/asymmetric stretching (breathing), bending, and/or twisting modes,22 leading to different degrees of CeO8 polyhedral distortion. In this Lu3−xYxMgAl3SiO12:Ce3+ series, the distortion is believed to mainly originate from the breathing of the Ce–O bonds. Thus, a polyhedral distortion index (D) can be introduced, calculated using the following equation:10,23
 | (1) |
Considering the local coordination environment around the Ce3+ ion in these compounds, one can find that a CeO8 polyhedron is simultaneously coordinated by six (Al/Si)O4 tetrahedra through nodes and edges (Fig. 5a), by four (Al/Mg)O6 octahedra through edges (Fig. 5b), and by four (Lu/Y)O8 square antiprisms through edges (Fig. 5c).
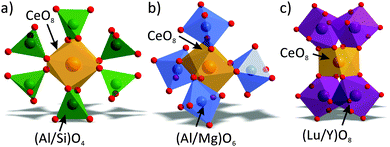 | ||
| Fig. 5 Local coordination environment around CeO8 in the crystal structure of Lu3−xYxMgAl3SiO12:Ce3+ compounds. | ||
The d(Al/Mg–O) and d(Al/Si–O) bond lengths are kept almost constant, and supposedly, (Al/Si)O4 and (Al/Mg)O6 remain rigid with different x; thus, they should not have a significant influence on the geometry of the CeO8 polyhedron. Only (Lu/Y)O8 enlarges with x and can then affect the Ce–O bond lengths in CeO8. This proposed model, as illustrated in Fig. 6, clearly shows the shrinkage of the CeO8 polyhedron with increasing Y3+ concentration in these compounds. Therefore, the decrease in d(Ce–O) bond lengths results in stronger crystal field splitting of the 5d orbital of Ce3+, which accounts for the red-shift of the emission in the compounds where Lu3+ was substituted by bigger Y3+. Reportedly, the red-shifted emission in the Ce3+ doped garnet was also observed in the case of a larger trivalent cation substitution in Y3Al5O12:Ce3+, such as Tb3+ or La3+ doping substituting for Y3+.
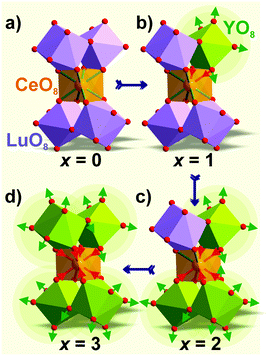 | ||
| Fig. 6 Shrinkage mechanism of the CeO8 polyhedron with Y3+ substituting Lu3+ in Lu3−xYxMgAl3SiO12:Ce3+: x = 0 (a), x = 1 (b), x = 2 (c), and x = 3 (d). | ||
Photoluminescence spectra
The as-prepared phosphor samples show bright yellow color emission under daylight, as shown in Fig. 7. As expected for a host with a general garnet structure, the lowest Ce3+ 4f–5d absorption transition is in the blue spectral region, leading to green to yellow color emission, which is readily serviceable in the practical blue LED chip based pc-wLED fabrication. The successful preparation of the artificial (Lu3−xYx)MgAl3SiO12:Ce3+ garnet phosphors suggests that a lot of more solid solution composition creations can be expected and developed within the garnet structure, by using this solid solution strategy. | ||
| Fig. 7 Digital images of the (Lu3−xYx)MgAl3SiO12:Ce3+ phosphors. From left to right, x is equal to 0, 1, 2, and 3, respectively. | ||
The photoluminescence emission (PL) spectra of the Lu3−xYxMgAl3SiO12:Ce3+ phosphors under λex = 450 nm are shown in Fig. 8. All phosphors exhibit a broad asymmetric emission band attributed to the spin-allowed 5d–4f transitions of Ce3+. The emission maxima are peaking at 575, 588, 594, and 597 nm, respectively. At the same doping concentration of Ce3+, an increasing Y3+/Lu3+ ratio is seen to induce a red-shift of the emission peak from yellow to yellowish-orange. Moreover, the peak intensity and the integrated intensity of the emission bands gradually decrease at the same time. The full-width at half-maximum (FWHM) values of the emission bands are 137 nm, 140 nm, 144 nm, and 147 nm, respectively.
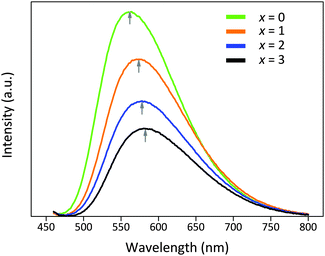 | ||
| Fig. 8 Emission spectra of Lu3−xYxMgAl3SiO12:Ce3+ (x = 0–3) phosphors under λex = 450 nm. The maximum emission wavelengths gradually red-shift as indicated by the vertical arrows. | ||
Photoluminescence–structure relationship
The energy structure of Ce3+ ions with 4f1 configuration consists of a 2F5/2 ground state and a 2F7/2 excited state, which arise from the spin–orbit coupling of the 2F term. In a garnet structure, the crystal field (CF) splits these two states further into three (levels #1–3) and four (levels #4–7) energy levels, respectively.24,25 In general, the two group sublevels, 2F5/2 and 2F7/2, are separated by about 2000–2500 cm−1; however in garnets, a recent ab initio embedded cluster calculation shows that the splitting is much larger and is slightly smaller than 4000 cm−1.25Meanwhile, the 5d1 excited state configuration of Ce3+ will be split into 2–5 components by the crystal field, with the splitting number depending on the crystal field symmetry. Therefore, the Ce3+ emission is strongly affected by the host lattice through (1) the centroid shift induced by the nephelauxetic effect, (2) the splitting of the 4f level by spin–orbit coupling, and (3) the splitting of the 5d orbital by the crystal field. Within a cubic symmetry, the Ce3+ 5d1 splits into two sublevels: a 3-fold degenerate level at higher energy (named 2T2g) and a 2-fold degenerate level at lower energy (named 2Eg).26,27 In case the cubic symmetry is distorted, the 3-fold and 2-fold levels can be further split into five sublevels (dyz, dzx, dx2y2, dxy, and dz2).28 Only the transition from the lowest crystal-splitting component of the 5d levels to the 2F5/2 and 2F7/2 ground states gives irradiative emission; emission from higher 5d levels only possibly occurs with a very large energy difference between these 5d levels, so no relaxation towards the lower 5d level takes place. A broad 5d–4f band emission, instead of a narrow line emission like a 4f–4f transition, is observed in Lu3−xYxMgAl3SiO12:Ce3+ phosphors due to the fact that 5d electrons are more delocalized than 4f electrons, and moreover, the local specific coordination environment around Ce3+ is diverse and can be different from the average coordinating situation suggested by the XRD pattern refinement. Therefore, the red-shifting of the peaking wavelength and the broadening of the emission band suggests a stronger crystal field strength (due to the shrinkage of the CeO8 polyhedron as explained in Fig. 6) and there are more diverse local coordination environments around Ce3+ in the Y3+ substituted solid solution phosphors. This also explains the emission bands being more asymmetric.
The emission band of Ce3+ in garnets can be usually fitted into two Gaussian-type components, corresponding to the transition from the 5d level to the two 2F5/2 and 2F7/2 ground states; however, our such attempts gave unsatisfactory fitting results, suggesting that a simple fitting of two Gaussian-type components would fail to explain the emission. Two main reasons may account for this: firstly, the large splitting of 4f states into seven sublevels in the garnet requires more complex deconvolution of its emission; and secondly, Y/Lu substitution in the crystal generates variation in the coordination of Ce3+ and the emission energy between different Ce3+ ions. A detailed study of the Ce3+ energy level positions is interesting but beyond the scope of the present work.
If one sees the normalized emission spectra (Fig. S1, ESI†), with increasing Y3+/Lu3+ ratio, the phosphor shows gradually more and more emission in the >700 nm red spectrum region; however, as the human eye has almost no sensitivity in the >700 nm region, this part of the emission would seldom contribute to the lumen output of fabricated wLEDs. Therefore, for application in pc-wLEDs, Lu3−xYxMgAl3SiO12:Ce3+ with high Lu ratio is preferred.
It is interesting to see that the four phosphors exhibit slightly different photoluminescence excitation (PLE) spectra. As seen in Fig. 9, their PLE spectra consist of two main broad excitation bands located in the 390–520 nm and 300–390 nm regions; they are attributed to lower-energy and higher-energy excitation transitions from the 4f level to the 2Eg and 2T2g levels, respectively.29 The excitation maximum is located in the 450–470 nm range with a slight red-shift in response to larger x, matching well with the emission of commercial blue GaN LEDs. The position of the lowest Ce3+ 4f15d0–4f05d1 absorption transition in Y3MgAl3SiO12:Ce3+ is at lower energy compared to that in Lu3MgAl3SiO12:Ce3+, which indicates a stronger crystal field on Ce3+ in the Y analogue.30 The structure–photoluminescence relationship affecting the energy level of the Ce3+ ion in different symmetries is depicted in Fig. 10.
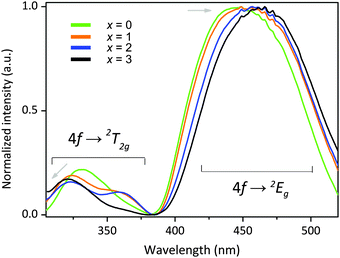 | ||
| Fig. 9 Excitation spectra of Lu3−xYxMgAl3SiO12:Ce3+ (x = 0–3) phosphors monitored at their respective emission maxima. | ||
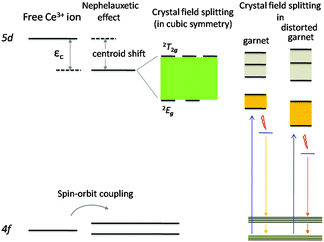 | ||
| Fig. 10 Energy level scheme for a free Ce3+ ion and the Ce3+ ion occupying an ideal cubic symmetry and that doped in different garnet structures. | ||
Although the excitation energy of the 4f–2Eg peak shifts to lower energies with increasing Y3+/Lu3+, the excitation energy of the 4f–2T2g peak shifts to higher energies. Generally, a red-/blue-shift of the excitation spectra may originate from a changing crystal field splitting or centroid shift.31 Variation in the centroid shift will lead to a shift of all excited 5d energy levels in the same direction with a specific amount; therefore, the centroid shift should not be considered as the main cause for the red-shift of the excitation transitions of this series of garnet phosphors. Instead, stronger crystal field splitting of the 5d energy level of Ce3+ with increasing x mainly induced the redshift of the transition from the lowest 5d level to 4f level.
The Commission Internationale de I'Eclairage (CIE) chromaticity diagram of the four phosphors under an excitation of 450 nm blue light is shown in Fig. 11. The color coordinates are calculated to be (0.48, 0.51), (0.50, 0.49), (0.51, 0.48) and (0.52, 0.47), respectively, locating in the yellow-orange region. If one draws a line between the excitation source (450 nm in this case) and the CIE chromaticity coordinates, this line will intersect with the blackbody radiation curve, and the intersection node roughly suggests the CCT value. As seen, these garnet phosphors, when combined with blue chip LEDs, can potentially give single phosphor converted wLEDs with relatively low CCTs, ranging from ∼3500 to ∼2500 K. The above analysis results suggest that the Lu3−xYxMgAl3SiO12:Ce3+ phosphors have great potential for application in blue chip pumped wLEDs to achieve relatively warm white light emission.
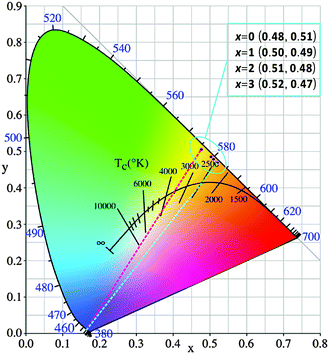 | ||
| Fig. 11 Color coordinates of Lu3−xYxMgAl3SiO12:Ce3+ (x = 0–3) under λex = 450 nm in the CIE chromaticity diagram. | ||
Quantum efficiency
The development of new phosphors, firstly, requires a fit between the excitation of the phosphor and the emission of a LED chip. Then, the wavelength conversion efficiency becomes the second most important criterion for potential application in wLEDs. Therefore, we measured the absorption and the internal and external quantum efficiencies of Lu3−xYxMgAl3SiO12:Ce3+ (x = 0–3) phosphors, the results of which under 450 nm excitation are listed in Table 3. The highest efficiency is obtained with the Lu3MgAl3SiO12:Ce3+ phosphor; the internal and external quantum efficiencies are determined to be 83% and 58%, respectively. The QE might be improved by further optimization of synthesis and composition.| Phosphor | Absorption (%) | IQE (%) | EQE (%) |
|---|---|---|---|
| Lu3MgAl3SiO12:Ce3+ | 69.7 | 83.4 | 58.2 |
| Lu2YMgAl3SiO12:Ce3+ | 71.7 | 68.6 | 49.2 |
| LuY2MgAl3SiO12:Ce3+ | 63.2 | 61.4 | 38.9 |
| Y3MgAl3SiO12:Ce3+ | 62.6 | 48.1 | 30.1 |
Temperature-dependent photoluminescence
Currently, the commercial pc-wLEDs generally utilize a direct-coating model, where the phosphor is dispersed in a polymer matrix and then coated on a LED chip. Heat will be generated at the p–n junction of a common in work LED chip, and this heat will increase the phosphor layer temperature to 120–150 °C.32,33 At such temperature, the emission intensity of phosphor gets decreased; therefore, it will be of practical interest to evaluate the temperature-dependent emission of the newly identified phosphors. Fig. 12 shows the emission spectra of Lu3−xYxMgAl3SiO12:Ce3+ (x = 0–3) under λex = 450 nm as recorded over the test temperature range 30–200 °C. All the four phosphors show decreasing emission intensity with increasing temperature due to the thermal quenching effect. When the temperature is increased to 100 °C (150 °C), the intensity of the x = 0–3 samples becomes 82% (68%), 74% (56%), 70% (52%), and 65% (46%) of that at 30 °C. Therefore, among these phosphors, Lu3MgAl3SiO12:Ce3+ exhibits the best thermal resistance ability of emission, with its thermal quenching temperature (at which the emission intensity decreases by 50% of its initial value), T0.5, being higher than 150 °C. Moreover, as seen from Fig. 12, the peaking wavelength of the emission spectra stays almost constant, suggesting the less possibility of color emission variation when applied in a wLED.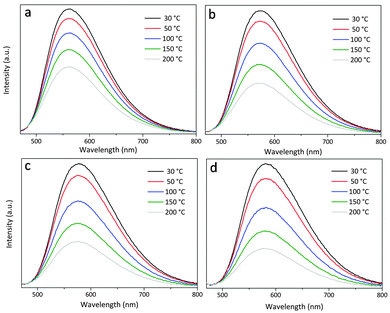 | ||
| Fig. 12 Emission spectra of Lu3−xYxMgAl3SiO12:Ce3+ (x = 0–3) under λex = 450 nm as recorded over the test temperature range 30–200 °C. | ||
Conclusions
New garnet phosphors, Lu3−xYxMgAl3SiO12:Ce3+ (x = 0–3), were developed for the blue LED pumped white light emitting diodes, by the solid solution design strategy. Phase pure samples can be obtained by sintering at 1450 °C for 5 h. All samples show the general cubic garnet structure with the space group Ia![[3 with combining macron]](https://www.rsc.org/images/entities/char_0033_0304.gif) d. Lu/Y/Ce, Mg/Al, and Al/Si occupy the positions 24c, 16a, and 24d, forming the (Lu/Y/Ce)O8 square antiprism, (Mg/Al)O6 octahedron, and (Al/Si)O4 tetrahedron, respectively. With the bigger Y3+ ions substituting Lu3+, the unit cell enlarges and the (Lu/Y–O) bond lengths increase but with different growth rates. Additionally, the CeO8 polyhedron has joint edges with (Lu/Y)O8 polyhedra, and the enlargement of (Lu/Y)O8 with x leads to shrinkage of CeO8, and consequently, decreasing d(Ce–O). This should be the reason for the stronger crystal field splitting around Ce3+ and the red-shift of the peaking emission wavelength. Moreover, the distortion of the (Lu/Y/Ce)O8 square antiprism becomes larger and this increases the diversity of local coordination environments of Ce3+, which explains why the FWHM values of the emission bands become bigger. The new phosphors are excited efficiently at 450 nm and emit yellow color with relatively high luminescence intensity, room temperature quantum efficiency, and thermal resistance ability, making them very promising candidates for application in practical wLEDs.
d. Lu/Y/Ce, Mg/Al, and Al/Si occupy the positions 24c, 16a, and 24d, forming the (Lu/Y/Ce)O8 square antiprism, (Mg/Al)O6 octahedron, and (Al/Si)O4 tetrahedron, respectively. With the bigger Y3+ ions substituting Lu3+, the unit cell enlarges and the (Lu/Y–O) bond lengths increase but with different growth rates. Additionally, the CeO8 polyhedron has joint edges with (Lu/Y)O8 polyhedra, and the enlargement of (Lu/Y)O8 with x leads to shrinkage of CeO8, and consequently, decreasing d(Ce–O). This should be the reason for the stronger crystal field splitting around Ce3+ and the red-shift of the peaking emission wavelength. Moreover, the distortion of the (Lu/Y/Ce)O8 square antiprism becomes larger and this increases the diversity of local coordination environments of Ce3+, which explains why the FWHM values of the emission bands become bigger. The new phosphors are excited efficiently at 450 nm and emit yellow color with relatively high luminescence intensity, room temperature quantum efficiency, and thermal resistance ability, making them very promising candidates for application in practical wLEDs.
Acknowledgements
This work was partly supported by the National Natural Science Foundation of China (Grant No. 51511130035, 51272259, 61575182, 51572232 and 51561135015) and the Russian Foundation for Basic Research (Grant No. 15-52-53080). H. J. thanks the China Scholarship Council (CSC) for providing a scholarship to support his study in NIMS.References
- M. Mikami, H. Watanabe, K. Uheda, S. Shimooka, Y. Shimomura, T. Kurushima and N. Kijima, IOP Conf. Ser.: Mater. Sci. Eng., 2009, 1, 012002 CrossRef.
- H. Ji, Z. Huang, Z. Xia, M. S. Molokeev, V. V. Atuchin, M. Fang and Y. Liu, J. Phys. Chem. C, 2015, 119, 2038–2045 CAS.
- H. Ji, Z. Huang, Z. Xia, M. S. Molokeev, V. V. Atuchin and S. Huang, Inorg. Chem., 2014, 53, 11119–11124 CrossRef CAS PubMed.
- H. Ji, Z. Huang, Z. Xia, M. S. Molokeev, V. V. Atuchin, M. Fang and S. Huang, Inorg. Chem., 2014, 53, 5129–5135 CrossRef CAS PubMed.
- W. B. Im, Y. Fourré, S. Brinkley, J. Sonoda, S. Nakamura, S. P. DenBaars and R. Seshadri, Opt. Express, 2009, 17, 22673–22679 CrossRef CAS PubMed.
- W.-Y. Huang, F. Yoshimura, K. Ueda, Y. Shimomura, H.-S. Sheu, T.-S. Chan, H. F. Greer, W. Zhou, S.-F. Hu, R.-S. Liu and J. P. Attfield, Angew. Chem., Int. Ed., 2013, 52, 8102–8106 CrossRef CAS PubMed.
- Z. Xia, C. Ma, M. S. Molokeev, Q. Liu, K. Rickert and K. R. Poeppelmeier, J. Am. Chem. Soc., 2015, 137, 12494–12497 CrossRef CAS PubMed.
- K. A. Denault, N. C. George, S. R. Paden, S. Brinkley, A. A. Mikhailovsky, J. Neuefeind, S. P. DenBaars and R. Seshadri, J. Mater. Chem., 2012, 22, 18204–18213 RSC.
- Z. Xia, Y. Zhang, M. S. Molokeev, V. V. Atuchin and Y. Luo, Sci. Rep., 2013, 3, 3310 Search PubMed.
- K. A. Denault, J. Brgoch, M. W. Gaultois, A. Mikhailovsky, R. Petry, H. Winkler, S. P. DenBaars and R. Seshadri, Chem. Mater., 2014, 26, 2275–2282 CrossRef CAS.
- W. B. Im, N. George, J. Kurzman, S. Brinkley, A. Mikhailovsky, J. Hu, B. F. Chmelka, S. P. DenBaars and R. Seshadri, Adv. Mater., 2011, 23, 2300–2305 CrossRef CAS PubMed.
- W. B. Park, S. P. Singh and K.-S. Sohn, J. Am. Chem. Soc., 2014, 136, 2363–2373 CrossRef CAS PubMed.
- N. Hirosaki, T. Takeda, S. Funahashi and R.-J. Xie, Chem. Mater., 2014, 26, 4280–4288 CrossRef CAS.
- T. Takeda, N. Hirosaki, S. Funahshi and R.-J. Xie, Chem. Mater., 2015, 27, 5892–5898 CrossRef CAS.
- TOPAS V4.2: General profile and structure analysis software for powder diffraction data – User's Manual, Bruker AXS, Karlsruhe, Germany, 2008 Search PubMed.
- L. Wang, X. Wang, T. Takeda, N. Hirosaki, Y.-T. Tsai, R.-S. Liu and R.-J. Xie, Chem. Mater., 2015, 27, 8457–8466 CrossRef CAS.
- X.-J. Wang, L. Wang, T. Takeda, S. Funahashi, T. Suehiro, N. Hirosaki and R.-J. Xie, Chem. Mater., 2015, 27, 7689–7697 CrossRef CAS.
- Y. Shi, G. Zhu, M. Mikami, Y. Shimomura and Y. Wang, Dalton Trans., 2015, 44, 1775–1781 RSC.
- M. C. Maniquiz, K. Y. Jung and S. M. Jeong, J. Electrochem. Soc., 2010, 157, H1135–H1139 CrossRef CAS.
- F. Euler and J. A. Bruce, Acta Crystallogr., 1965, 19, 971–978 CrossRef CAS.
- B. V. Mill, G. Ronniger and Y. K. Kabalov, Russ. J. Inorg. Chem., 2014, 59, 1208–1213 CrossRef CAS.
- L. Seijo and Z. Barandiarán, Opt. Mater., 2013, 35, 1932–1940 CrossRef CAS.
- W. Baur, Acta Crystallogr., Sect. B: Struct. Crystallogr. Cryst. Chem., 1974, 30, 1195–1215 CrossRef CAS.
- H. Przybylińska, A. Wittlin, C.-G. Ma, M. G. Brik, A. Kamińska, P. Sybilski, Y. Zorenko, M. Nikl, V. Gorbenko, A. Fedorov, M. Kučera and A. Suchocki, Opt. Mater., 2014, 36, 1515–1519 CrossRef.
- L. Seijo and Z. Barandiaran, Phys. Chem. Chem. Phys., 2014, 16, 3830–3834 RSC.
- P. Dorenbos, J. Lumin., 2002, 99, 283–299 CrossRef CAS.
- P. Dorenbos, Phys. Rev. B: Condens. Matter Mater. Phys., 2002, 65, 235110 CrossRef.
- X. Gong, J. Huang, Y. Chen, Y. Lin, Z. Luo and Y. Huang, Inorg. Chem., 2014, 53, 6607–6614 CrossRef CAS PubMed.
- J. Ueda, K. Aishima and S. Tanabe, Opt. Mater., 2013, 35, 1952–1957 CrossRef CAS.
- A. A. Setlur, W. J. Heward, Y. Gao, A. M. Srivastava, R. G. Chandran and M. V. Shankar, Chem. Mater., 2006, 18, 3314–3322 CrossRef CAS.
- J. Zhong, W. Zhuang, X. Xing, R. Liu, Y. Li, Y. Liu and Y. Hu, J. Phys. Chem. C, 2015, 119, 5562–5569 CAS.
- H. Ji, Z. Huang, Z. Xia, M. S. Molokeev, M. Chen, V. V. Atuchin, M. Fang, Y. G. Liu and X. Wu, J. Am. Ceram. Soc., 2015, 98, 3280–3284 CrossRef CAS.
- V. Bachmann, C. Ronda and A. Meijerink, Chem. Mater., 2009, 21, 2077–2084 CrossRef CAS.
Footnote |
| † Electronic supplementary information (ESI) available: Crystallographic information files (CIF) of the Lu3−xYxMgAl3SiO12:Ce3+ (x = 1–3) samples, main bond lengths of the compounds, and normalized emission spectra of the phosphors. See DOI: 10.1039/c6tc00089d |
| This journal is © The Royal Society of Chemistry 2016 |

