Spray coated ultrathin films from aqueous tungsten molybdenum oxide nanoparticle ink for high contrast electrochromic applications†
Haizeng
Li
ab,
Jingwei
Chen
b,
Mengqi
Cui
b,
Guofa
Cai
b,
Alice Lee-Sie
Eh
b,
Pooi See
Lee
*b,
Hongzhi
Wang
*a,
Qinghong
Zhang
c and
Yaogang
Li
*c
aState Key Laboratory for Modification of Chemical Fibers and Polymer Materials, College of Materials Science and Engineering, Donghua University, Shanghai 201620, P. R. China. E-mail: wanghz@dhu.edu.cn; Fax: +86-021-67792855; Tel: +86-021-67792881
bSchool of Materials Science and Engineering, Nanyang Technological University, 639798, Singapore. E-mail: pslee@ntu.edu.sg
cEngineering Research Center of Advanced Glasses Manufacturing Technology, Ministry of Education, College of Materials Science and Engineering, Donghua University, Shanghai 201620, P. R. China. E-mail: yaogang_li@dhu.edu.cn; Fax: +86-021-67792855; Tel: +86-021-67792526
First published on 16th November 2015
Abstract
Ultrathin tungsten molybdenum oxide nanoparticle films were fabricated from aqueous ink by a spray coating technique. With the in situ heating of the hot plate during the spray coating process, the detrimental effects of oxygen vacancies on electrochromic (EC) materials could be eliminated. The spray coated ultrathin films exhibit higher contrast than the drop casted films, which would provide a versatile and promising platform for energy-saving smart (ESS) windows, batteries, and other applications.
Assembly technologies would substantially affect the physicochemical properties and, ultimately, the performance of thin films.1 Thus, the development of compliant fabrication of films is critical to the emerging electronics technology. Recently, EC devices have attracted increased attention due to their capability of tuning down energy consumption with their application in ESS windows. Therefore, a lot of research has been actively explored to obtain high performance EC films through various methods, including the Langmuir–Blodgett technique,2 filtration,3 spin coating,4,5 layer-by-layer deposition,6,7 electrodeposition,8 the anodic growth method,9–11 hydrothermal techniques,12–14 and drop casting.15,16 However, each of these methods mentioned above has one or more characteristic drawbacks, including complicated processes and high energy consumption, leading to the inconvenience of large area fabrication. The spray process has been proven to be a versatile and facile method to fabricate electrodes, and is considered to be one of the most promising film fabrication techniques. This is widely applied because the spray process can be done at high production speed and is compatible with large-scale electrode fabrication.17,18
Recently, molybdenum doped tungsten oxide has attracted much attention because it could exhibit a broadened optical absorption band.19,20 Besides, higher electrochromic efficiencies are expected as a result of enhanced electron intervalence transfer between Mo5+ and W6+ states, in addition to Mo5+, Mo6+ and W5+, W6+ transitions.21,22 Thus, a spray coating technique was utilized to prepare molybdenum doped tungsten oxide films due to their enhanced EC performance.23,24 However, the few reports regarding spray coated molybdenum doped tungsten oxide films had paid too much attention to the molecular precursors and finally the films were of bulk structures, which would greatly increase the diffusion paths of lithium ions in the active materials. To solve these issues, it is attractive to spray pre-formed tungsten molybdenum oxide nanoparticle ink, which could produce nanoparticle films and thus greatly shorten the diffusion paths of lithium ions in the EC materials and facilitate intimate contacts between EC materials and the electrolyte/current collector. The investigation into spray coating pre-formed tungsten molybdenum oxide provides potential insights into the ion transport mechanism and needs to be actively explored.
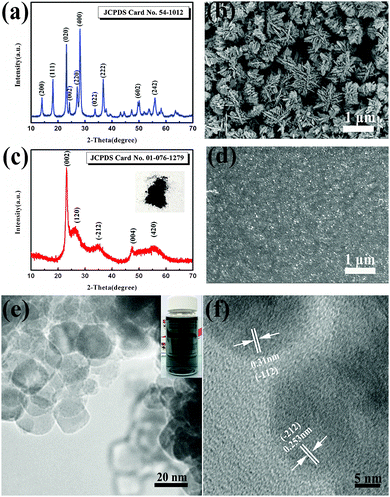
In this study, we firstly designed a facile chemical method to synthesize doped tungsten oxide nanoparticles with ultrasmall sizes by adding MoO3 in a typical synthesis procedure of pure tungsten oxide. In the typical synthesis of pure tungsten oxide, hydrated tungsten oxide was prepared via a hydrothermal method (see the experimental section). Fig. 1(a) shows the X-ray powder diffraction (XRD) pattern of the pure hydrated tungsten oxide powder. All peaks of the as-prepared powder can be well indexed to the orthorhombic phase of WO3·0.33H2O (JCPDS Card No. 54-1012). The FE-SEM picture (Fig. 1(b)) shows that the sample has a cluster structure composed of nanoplates with a thickness of about 30 nm. The formation of the nanoplates could be attributed to the natural layered structure of the hydrated tungsten oxide25 and the presence of ethylene glycol (EG) as explained in our previous report.12 The average size of the nanoplate clusters is estimated to be 1 μm, which would increase the diffusion paths of intercalation ions in the solid phase and thus lead to a slow response. Moreover, the big sizes of the nanoplate clusters make it difficult to get uniform ink and films. As mentioned above, the doping with molybdenum will not only improve the EC performance, but will also increase the crystalline disorder and affect the grain growth.19–24 In this case, molybdenum oxide was utilized to obtain doped tungsten oxide with smaller dimensions under the same hydrothermal conditions. Thus, the desired nanoparticulate tungsten molybdenum oxide can be synthesized via this novel and facile wet chemical doping method. Fig. 1(c) shows the XRD pattern of the as-synthesized powder. The optical photo of the as-prepared powder shows a dark blue color, which suggests the nonstoichiometric nature of the material and the existence of oxygen vacancies.4,26–28 From the XRD pattern, it is confirmed that the as-synthesized powder is tungsten molybdenum oxide (W0.71Mo0.29O3−x) with a monoclinic phase. The obvious broadened reflection peaks imply smaller crystalline sizes of the particles. The FE-SEM image (Fig. 1(d)) shows that the nanoplate clusters could be changed to nanoparticles upon the addition of MoO3 with a drastic reduction in cluster size, in agreement with the XRD results. The TEM image (Fig. 1(e)) of the tungsten molybdenum oxide reveals that the nanoparticles with nearly spherical shapes possess an average diameter of 20 nm. The distances between the adjacent lattice fringes were measured to be 0.31 and 0.253 nm, corresponding to the lattice spacing of the (−112) and (−212) planes. As shown in the inset of Fig. 1(e), the uniform ink exhibits a pale-blue color, which is typically related to the presence of oxygen vacancies.4,26–28
In addition to XRD and TEM analyses, X-ray photoelectron spectroscopy (XPS) is used to identify the stoichiometry of the doped nanoparticles as shown in Fig. 2. The XPS survey spectra shown in Fig. 2(a) indicate that the elements W, Mo, O exist in tungsten molybdenum oxide nanoparticles without other impurities. Corresponding high-resolution Mo 3d and W 4f XPS spectra are used to identify the stoichiometry of the doped nanoparticles and are shown in Fig. 2(b and c). From the Mo 3d XPS spectrum (Fig. 2b), it is found that Mo6+ and Mo5+ ions coexist in the nanoparticles. The Mo5+ peaks (centered at 234.8 and 231.6 eV) are as obvious as the Mo6+ peaks (centered at 236.1 and 232.9 eV), suggesting a significant sub-stoichiometry for the doped nanoparticles. The W 4f XPS core-level spectrum of the nanoparticles exhibits three peaks corresponding to W 4f7/2, W 4f5/2 and W 5p3/2, which are located at 35.5 eV, 37.7 eV and 41.3 eV, indicating that W in the doped nanoparticles is at its highest oxidation state (W6+). These results reveal that Mo was introduced into the WO3 lattice accompanied by the emergence of oxygen vacancies. The introduced Mo in the WO3 lattice will highly increase the structural disorder, which could prevent the preferred orientation growth and thus nanoparticles with small sizes could be prepared.
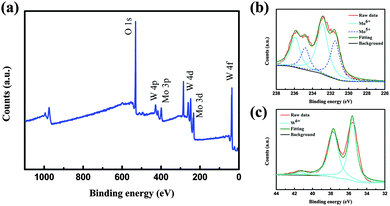 | ||
| Fig. 2 (a) XPS survey spectrum of tungsten molybdenum oxide nanoparticles. (b) Mo 3d XPS spectrum. (c) W 4f XPS spectrum. | ||
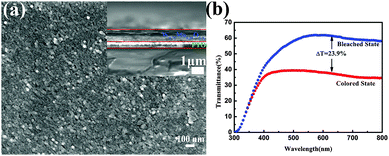
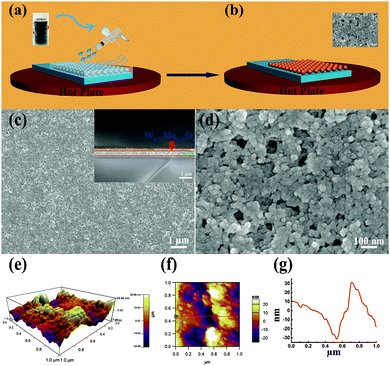
To investigate the electrochromic performance of the as-prepared W0.71Mo0.29O3−x nanoparticles, the pale-blue ink was drop casted on FTO glass to form an EC film with a thickness of around 1 μm (see Fig. 3(a)). Due to the detrimental effects of oxygen vacancies in EC materials,29 the drop casted film shows a low modulation range (23.9%) even though there is a lot of active material on the film. To eliminate the detrimental effects of oxygen vacancies, a facile in situ oxidization with heating of the hot plate during the spray coating process was utilized as the scheme illustrated in Fig. 4 (a)and (b). An ink containing W0.71Mo0.29O3−x nanoparticles is deposited as a continuous film on FTO glass using the spray coating technique (Fig. 4(a)). Subsequent removal of DI water and in situ oxidization with heating of the hot plate could induce the self-assembly of the W0.71Mo0.29O3 film (Fig. 4(b)). The pale yellow film, the Mo 3d XPS spectrum of the spray coated film and the drop casted film reveal that the oxygen vacancies have been eliminated (see Fig. S1 and S2 in the ESI†). Fig. 4(c) and (d) exhibit the surface morphology and a cross-sectional view of the as-prepared spray coated W0.71Mo0.29O3 film. W0.71Mo0.29O3 nanoparticles are clearly seen with porous structures. The cross-section image (inset in Fig. 4(c)) shows that the thickness of the as-prepared spray coated W0.71Mo0.29O3 film is around 200 nm, which is obviously thinner than that of the drop casted film (which is around 1 μm) and previous reports.11,12 The surface roughness of the film is also shown in Fig. 4, with amplitude of 60 nm for the region investigated. EDS (Energy Dispersive Spectroscopy) mapping of molybdenum and tungsten atoms was conducted and is shown in Fig. S3 (ESI†). The uniform signal coverage of the elements across the selected area confirms that the spray coated film consists of tungsten molybdenum oxide.
The EC phenomenon of the spray coated W0.71Mo0.29O3 film was investigated via an optical modulation test and characterization results are shown in Fig. 5(a). The digital photographs shown in Fig. 5(a) reveal that the logo placed below the film can be seen clearly, indicating fairly good transmittance of the film. The UV-vis transmittance spectra of the spray coated W0.71Mo0.29O3 film in the colored and bleached states were measured at −1.0 V and +1.0 V, respectively (Fig. 5(a)). The transmittance of the spray coated W0.71Mo0.29O3 film at 632.8 nm is measured to be about 80% when bleached, which is much higher than that of the drop casted film (Fig. 3(b)) and our previous reports.12,13,30,31 In addition to the high transmittance of the bleached state, the spray coated W0.71Mo0.29O3 film also has a high contrast when colored at a low voltage. The contrast of the spray coated W0.71Mo0.29O3 film at 632.8 nm after applying voltage of −1.0 V is calculated to be 42.9%, which is much higher than that of the drop casted film (Fig. 3(b)) and previous reports.31–33 To quantify the EC performance, the contrast density is defined as the contrast provided per unit film thickness. It has been calculated for the drop casted film and the spray coated film using the following equation:
| Contrast density = (Tbleach − Tcolor)/D, | (1) |
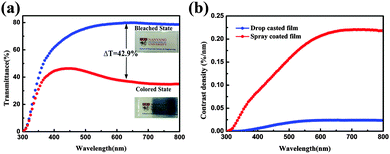 | ||
| Fig. 5 (a) UV-vis transmittance spectra of the spray coated W0.71Mo0.29O3 film in its colored and bleached state. (b) Contrast density of the spray coated film and drop casted film. | ||
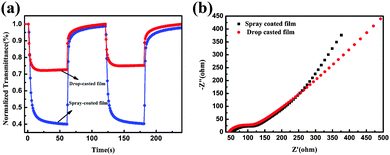
The assessment of the coloration–bleaching kinetics are vital for the evaluation of optical and electronic properties of the EC films.34 Therefore, in situ normalized transmittance changes measured at an optical wavelength of 632.8 nm were measured using the chronoamperometric (CA) technique (Fig. 6). The coloration and bleaching times are always defined as the time taken to reach 90% of the optical modulation at a 632.8 nm wavelength.35,36Fig. 6 shows the dynamic coloration/bleaching switching time for the drop casted W0.71Mo0.29O3−x film and the spray coated W0.71Mo0.29O3 film. For the drop casted film, the coloration time tc and bleaching time tb are found to be 5.5 and 7 s, respectively. Meanwhile, for the spray coated film, the coloration time tc and bleaching time tb are found to be 10 and 7.5 s, respectively. The response times of both films are all much faster than those of previous reports on pure tungsten oxide nanostructures.12,13,37–39 Electrochemical impedance spectroscopy (EIS) measurements were conducted to investigate the intrinsic reason why the spray coated film exhibited longer responsive time than the drop casted film. The Nyquist plots of both spray coated and drop casted films are shown in Fig. 6(b). The high-frequency arcs correspond to the charge-transfer impedance on the electrode/electrolyte surface. The semicircle of the spray coated film is similar to that of the drop casted film, indicating similar charge-transfer resistance. The inclined line at low frequency is related to the ion diffusion process. The line of the spray coated film exhibits a larger slope, suggesting its faster ion-diffusion process. These results demonstrate that the spray coated film possesses fast ion diffusion, and the longer responsive time of the spray coated film than that of the drop casted film can be attributed to the larger transmittance variation.
Coloration efficiency (CE) is defined by the following formulas:
| CE = ΔOD/(Q/A) | (2) |
| ΔOD = log(Tb/Tc) | (3) |
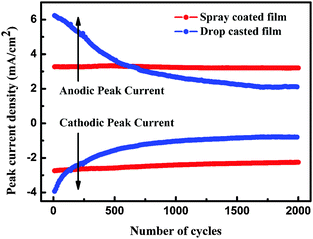
Electrochemical stability is another essential parameter for EC materials. It is well known that in an electrochromic film, the degradation of optical modulation and reversibility is induced by Li+ ion trapping.41 Thus, the electrochemical stabilities of as-prepared films were characterized by the CA technique using square potentials (between −1.0 and 1.0 V). As shown in Fig. 7, the peak current densities of the spray coated film have almost a constant value during 2000 cycles, while those of the drop casted film decreased sharply during 500 cycles, indicating the high stability of the spray coated film. In addition, the spray coated film can stably keep the nanoparticle structure after 2000 cycles, while the nanoparticles turned into a dense film after 2000 cycles for the drop casted film (see Fig. S6 in the ESI†). These results indicate that the spray coated film possesses good cycling durability.
Conclusions
In summary, a novel and facile method was used to synthesize W0.71Mo0.29O3−x nanoparticles, and an in situ oxidization spray coating technique was utilized to assemble W0.71Mo0.29O3 films. The spray coated W0.71Mo0.29O3 film shows 42.9% optical contrast at a low voltage, with 10 s coloring and 7.5 s bleaching (to 90%), and a coloration efficiency of 36.3 cm2 C−1. Such a spray coated W0.71Mo0.29O3 film demonstrates improved EC behaviors, which possess promising properties for potential applications in energy-saving smart windows and displays. Besides, due to the small size, excellent electrochemical accessibility and the facile film fabrication technique, the thin films of W0.71Mo0.29O3 nanoparticles obtained here hold tremendous promise for nano-electronics, water photo-splitting cells and batteries.Experimental section
Synthesis of precursor
All solvents and chemicals were of analytical grade and were used without further purification. The precursor solution was prepared through a modified approach based on our previously reported method.12,13,30,31 In a typical synthesis route, H2WO4 (5 g) and MoO3 (1.44 g) were added to 30 wt% H2O2 (60 mL) and heated at 95 °C with stirring. The resulting clear solution was diluted to 200 mL with equal volumes of DI water and EG, giving a concentration of 0.1 M. For comparison, a precursor solution without molybdenum doping was prepared without adding MoO3via the same method.Synthesis of WO3·0.33H2O and W0.71Mo0.29O3−x
The precursor solution (12 mL) and DI water (12 mL) were added into a 40 mL Teflon-lined stainless steel autoclave and maintained at 120 °C for 5 h. After performing the reaction, the products were collected by centrifugation, and thoroughly washed with ethanol and DI water. Then the product was redispersed in DI water to form a pale blue ink for assembly of EC films.Preparation of EC films
The obtained ink was diluted to 0.5 mg mL−1 and then 30 drops were drop-casted onto FTO glass covering 8 × 35 mm2 area to get a drop casted EC film.The spray coated film was prepared based on the methods in our previous report.42 2.5 mL diluted 0.5 mg mL−1 ink was deposited onto pre-cleaned FTO glass substrates (2.5 × 3.5 cm2) by a spray gun in a fume hood. The ink could be dried immediately after being deposited onto the substrates by heating of a hot plate. Meanwhile, the oxygen vacancies could be eliminated due to the in situ heat treatment and a pale yellow EC film could be prepared.
Characterization
X-ray diffraction (XRD, Shimadzu discover diffractometer with Cu Kα-radiation (λ = 1.5406 Å)), field-emission scanning electron microscopy (FE-SEM, JSM 7600F) and transmission electron microscopy (TEM, JEOL2010) were used to identify the morphology, structure and composition of the products, respectively. The sample roughness was measured using Atomic Force Microscopy (AFM) with a Cyphers S (Asylum Research). XPS measurements were performed on a Thermo Scientific K-Alpha spectrometer with a monochromatic Al Kα X-ray source of 1486.6 eV. The ultraviolet-visible (UV-vis) spectra were recorded on a UV-vis spectrophotometer (Shimadzu UV3600). The in situ spectro-electrochemical properties of individual films were carried out in a quartz cell at room temperature in the UV-vis spectrophotometer, and the voltage supply was from Solartron 1470E. The three-electrode cell consisted of an Ag wire as the reference electrode, a Pt wire as the counter electrode and the as-synthesized EC film as the working electrode. EIS measurement was conducted by applying an AC voltage of 5 mV over a frequency range of 0.1 Hz to 100 kHz using a Zahner electrochemical workstation (Zennium CIMPS-1). The electrolyte used in this paper was 1 M LiClO4 in PC.Acknowledgements
We gratefully acknowledge the financial support by the Natural Science Foundation of China (No. 51172042), the Specialized Research Fund for the Doctoral Program of Higher Education (20110075130001), the Science and Technology Commission of Shanghai Municipality (13JC1400200), the Shanghai Natural Science Foundation (15ZR1401200), the Program for Professor of Special Appointment (Eastern Scholar) at Shanghai Institutions of Higher Learning, the Innovative Research Team in University (IRT1221), the Program of Introducing Talents of Discipline to Universities (No. 111-2-04) and the Fundamental Research Funds for the Central Universities (2232014A3-06). The work was also supported by the Fundamental Research Funds for the Central Universities (15D310604). We are grateful to Nanyang Technological University for supporting the Special Excellent PhD International Visit Program. This work was also partially supported by Donghua University.Notes and references
- J. J. Richardson, M. Björnmalm and F. Caruso, Science, 2015, 348, aaa2491 CrossRef PubMed.
- J. Liu, J. Zheng, J. Wang, J. Xu, H. Li and S. Yu, Nano Lett., 2013, 13, 3589 CrossRef PubMed.
- L. Liang, J. Zhang, Y. Zhou, J. Xie, X. Zhang, M. Guan, B. Pan and Y. Xie, Sci. Rep., 2013, 3, 1936 Search PubMed.
- S. Cong, Y. Tian, Q. Li, Z. Zhao and F. Geng, Adv. Mater., 2014, 26, 4260 CrossRef CAS PubMed.
- S. Y. Park, J. M. Lee, C. Noh and S. U. Son, J. Mater. Chem., 2009, 19, 7959 RSC.
- M. Cui, W. S. Ng, X. Wang, P. Darmawan and P. S. Lee, Adv. Funct. Mater., 2015, 25, 401 CrossRef CAS.
- H. Ling, L. Liu, P. S. Lee, D. Mandler and X. Lu, Electrochim. Acta, 2015, 174, 57 CrossRef CAS.
- S. H. Lee, R. Deshpande, P. A. Parilla, K. M. Jones, B. To, A. H. Mahan and A. C. Dillon, Adv. Mater., 2006, 18, 763 CrossRef CAS.
- A. Ghicov, S. P. Albu, J. M. Macak and P. Schmuki, Small, 2008, 4, 1063 CrossRef CAS PubMed.
- J. Z. Ou, S. Balendhran, M. R. Field, D. G. McCulloch, A. S. Zoolfakar, R. A. Rani, S. Zhuiykov, A. P. O'Mullane and K. Kalantar-zadeh, Nanoscale, 2012, 4, 5980 RSC.
- J. Zhang, X. L. Wang, X. H. Xia, C. D. Gu, Z. J. Zhao and J. P. Tu, Electrochim. Acta, 2010, 55, 6953 CrossRef CAS.
- H. Li, G. Shi, H. Wang, Q. Zhang and Y. Li, J. Mater. Chem. A, 2014, 2, 11305 CAS.
- H. Li, J. Wang, G. Shi, H. Wang, Q. Zhang and Y. Li, RSC Adv., 2015, 5, 196 RSC.
- D. Ma, G. Shi, H. Wang, Q. Zhang and Y. Li, J. Mater. Chem. A, 2014, 2, 13541 CAS.
- W. Kang, C. Yan, X. Wang, C. Y. Foo, A. W. M. Tan, K. J. Z. Chee and P. S. Lee, J. Mater. Chem. C, 2014, 2, 4727 RSC.
- Y. Lu, L. Liu, W. Foo, S. Magdassi, D. Mandlerb and P. S. Lee, J. Mater. Chem. C, 2013, 1, 3651 RSC.
- M. Wong, R. Ishige, K. L. White, P. Li, D. Kim, R. Krishnamoorti, R. Gunther, T. Higuchi, H. Jinnai, A. Takahara, R. Nishimura and H. J. Sue, Nat. Commun., 2014, 5, 3589 Search PubMed.
- J. H. Lee, S. Yoshikawa and T. Sagawa, Sol. Energy Mater. Sol. Cells, 2014, 127, 111 CrossRef CAS.
- Y. Lin, T. Tsai, S. Hung and S. Tien, J. Solid State Electrochem., 2013, 17, 1077 CrossRef CAS.
- K. A. Gesheva and T. Ivanova, Chem. Vap. Deposition, 2006, 12, 231 CrossRef CAS.
- L. Kondrachova, B. P. Hahn, G. Vijayaraghavan, R. D. Williams and K. J. Stevenson, Langmuir, 2006, 22, 10490 CrossRef CAS PubMed.
- K. A. Gesheva, A. Cziraki, T. Ivanova and A. Szekeres, Thin Solid Films, 2007, 515, 4609 CrossRef CAS.
- J. M. O. R. de León, D. R. Acosta, U. Pal and L. Castaneda, Electrochim. Acta, 2011, 56, 2599 CrossRef.
- L. M. Manceriu, A. Rougier and A. Duta, J. Alloys Compd., 2015, 630, 133 CrossRef CAS.
- H. Zheng, J. Z. Ou, M. S. Strano, R. B. Kaner, A. Mitchell and K. Kalantar-zadeh, Adv. Funct. Mater., 2011, 21, 2175 CrossRef CAS.
- H. Cheng, T. Kamegawa, K. Mori and H. Yamashita, Angew. Chem., Int. Ed., 2014, 53, 2910 CrossRef CAS PubMed.
- K. Manthiram and A. P. Alivisatos, J. Am. Chem. Soc., 2012, 134, 3995 CrossRef CAS PubMed.
- G. Song, J. Shen, F. Jiang, R. Hu, W. Li, L. An, R. Zou, Z. Chen, Z. Qin and J. Hu, ACS Appl. Mater. Interfaces, 2014, 6, 3915 CAS.
- B. Dasgupta, Y. Ren, L. M. Wong, L. Kong, E. S. Tok, W. K. Chim and S. Y. Chiam, J. Phys. Chem. C, 2015, 119, 10592 CAS.
- D. Ma, G. Shi, H. Wang, Q. Zhang and Y. Li, J. Mater. Chem. A, 2013, 1, 684 CAS.
- D. Ma, H. Wang, Q. Zhang and Y. Li, J. Mater. Chem., 2012, 22, 16633 RSC.
- S. Vankova, S. Zanarini, J. Amici, F. Cámara, R. Arletti, S. Bodoardo and N. Penazzia, Nanoscale, 2015, 7, 7174 RSC.
- F. Zheng, H. Lu, M. Guo and M. Zhang, CrystEngComm, 2013, 15, 5828 RSC.
- D. D. Yao, R. A. Rani, A. P. O'Mullane, K. Kalantar-zadeh and J. Z. Ou, J. Phys. Chem. C, 2014, 118, 476 CAS.
- B. N. Reddy, P. N. Kumar and M. Deepa, ChemPhysChem, 2015, 16, 377 CrossRef CAS PubMed.
- C. Zhao, F. Du and J. Wang, RSC Adv., 2015, 5, 38706 RSC.
- W. Xiao, W. Liu, X. Mao, H. Zhu and D. Wang, J. Mater. Chem. A, 2013, 1, 1261 CAS.
- J. Wang, E. Khoo, P. S. Lee and J. Ma, J. Phys. Chem. C, 2009, 113, 9655 CAS.
- J. M. Wang, E. Khoo, P. S. Lee and J. Ma, J. Phys. Chem. C, 2008, 112, 14306 CAS.
- N. M. Vuong, D. Kim and H. Kim, J. Mater. Chem. C, 2013, 1, 3399 RSC.
- R. T. Wen, C. G. Granqvist and G. A. Niklasson, Nat. Mater., 2015, 14, 996 CrossRef CAS PubMed.
- J. Wang, C. Yan, W. Kang and P. S. Lee, Nanoscale, 2014, 6, 10734 RSC.
Footnote |
| † Electronic supplementary information (ESI) available. See DOI: 10.1039/c5tc02802g |
| This journal is © The Royal Society of Chemistry 2016 |

