
 Open Access Article
 This Open Access Article is licensed under a Creative Commons Attribution-Non Commercial 3.0 Unported Licence
Solid solution between lithium-rich yttrium and europium molybdate as new efficient red-emitting phosphors†
C.
Litterscheid
a,
S.
Krüger
b,
M.
Euler
c,
A.
Dreizler
c,
C.
Wickleder
*b and
B.
Albert
*a
aEduard-Zintl-Institut für Anorganische und Physikalische Chemie, Technische Universität Darmstadt, Alarich-Weiss-Straße 12, 64287 Darmstadt, Germany. E-mail: albert@ac.chemie.tu-darmstadt.de; Fax: +49-6151-16-6029; Tel: +49-6151-16-2392
bDepartment Chemie-Biologie – Anorganische Chemie, Universität Siegen, Adolf-Reichwein-Straße 2, 57068 Siegen, Germany. E-mail: wickleder@chemie.uni-siegen.de; Fax: +49-271-740-2555; Tel: +49-271-740-4217
cFG Reaktive Strömungen und Messtechnik, Maschinenbau/Center of Smart Interfaces, Technische Universität Darmstadt, Jovanka-Bontschits-Straße 2, 64287 Darmstadt, Germany
First published on 7th December 2015
Abstract
Li3.5Y1.5(MoO4)4 was synthesized in the form of phase-pure crystals. It forms a solid solution with Li3.5Eu1.5(MoO4)4. Single crystals obtained from Li2MoO4 fluxes had edge lengths of up to 0.5 mm. The crystal structures of Li3.5(Y1−xEux)1.5(MoO4)4 (x = 0, 0.1, 0.25, 0.5, 0.75 and 1) were determined in the triclinic crystal system (e.g. P![[1 with combining macron]](https://www.rsc.org/images/entities/char_0031_0304.gif) , no. 2, Z = 1; Li3.5Y1.5(MoO4)4: a = 5.1875(2) Å, b = 6.6380(2) Å, c = 10.2731(4) Å, α = 100.082(3)°, β = 100.257(2)° and γ = 111.943(2)°). All the compounds are isostructural and crystallize with a structure related to the scheelite-type structure with mixed occupancy of one cation position, while the two others are occupied by Li ions exclusively. Thermal analyses reveal stability in air up to 995 K for Li3.5Y1.5(MoO4)4; the decomposition temperature decreases with an increase in Eu-content. Spectroscopic properties (emission and excitation) were investigated in the context of the search for new thermographic phosphors. Excitation at 395 nm leads to strong red emission at 613 nm. Features of the emission spectra suggest the potential of Li3.5(Y1−xEux)1.5(MoO4)4 as red phosphor candidates for light emitting diodes. Their luminescence properties at high temperatures were also investigated.
, no. 2, Z = 1; Li3.5Y1.5(MoO4)4: a = 5.1875(2) Å, b = 6.6380(2) Å, c = 10.2731(4) Å, α = 100.082(3)°, β = 100.257(2)° and γ = 111.943(2)°). All the compounds are isostructural and crystallize with a structure related to the scheelite-type structure with mixed occupancy of one cation position, while the two others are occupied by Li ions exclusively. Thermal analyses reveal stability in air up to 995 K for Li3.5Y1.5(MoO4)4; the decomposition temperature decreases with an increase in Eu-content. Spectroscopic properties (emission and excitation) were investigated in the context of the search for new thermographic phosphors. Excitation at 395 nm leads to strong red emission at 613 nm. Features of the emission spectra suggest the potential of Li3.5(Y1−xEux)1.5(MoO4)4 as red phosphor candidates for light emitting diodes. Their luminescence properties at high temperatures were also investigated.
1. Introduction
Currently, there is a drastic change in the illumination technology due to the substitution of incandescent and discharge lamps by energy saving light emitting diodes (LEDs). The general strategy is the combination of near UV emitting Ga/InN LEDs with red, green and blue emitting phosphors.1 Numerous respective materials are available, which emit in the high energy visible range, but still there is a demand for red emitting phosphors. Eu2+ doped nitrides are very promising candidates in this context but include some disadvantages. Eu3+ doped materials are well known alternatives due to the 4f6 → 4f6 emission located in the red region typical for Eu3+ ions. The narrow line emission of Eu3+ ions gives high colour quality devices, compared to the band emission of Eu2+ ions. A remarkable drawback is, however, that direct excitation into the 4f6 states leads to inefficient emission due to parity forbidden f ↔ f transitions. A solution to this problem is the development of host lattices with complex anions, which include highly charged central atoms, e.g. tungstates and molybdates. In these cases, the charge transfer states of the complex anions are located at rather low energies, namely, in the near UV region and can thus be excited by Ga/InN LEDs. Intense Eu3+ red emission is achieved after energy transfer from CT to the 4f6 states. Moreover, these materials fulfil the requirements for luminescent materials such as high chemical and thermal stability and a suitable site for Eu3+ doping. Herein, we present a new material, Li3.5Y1.5(MoO4)4:Eu3+, which shows a strong red narrow line emission.Contrary to Li3.5RE1.5(MoO4)4, lithium rare earth metal molybdates of the general formula, LiRE(MoO4)2 (RE: La–Lu, Y), are well-known and crystallize in the tetragonal crystal system with a scheelite-type structure (Scheelite: CaWO4). They are obtained from LiF–MoO32 or Li2MoO43–6 fluxes and have been investigated for many decades, mainly as host materials for optical materials. The luminescence properties of Eu3+-doped molybdates LiRE(MoO4)2:Eu (RE: La, Gd, Lu and Y),7–9 LiEu(Mo1−xWxO4)210 and AY1−xEux(MoO4)2 (A: Li, Na, K)11–17 have been described in the literature.
When it comes to lithium rare earth metal molybdates of the general formula Li3.5RE1.5(MoO4)4, the crystal structures of only two representatives are known: Li3.5Ho1.5(MoO4)4 and Li3.5Eu1.5(MoO4)4.18,19 In addition, Li3.5Y1.5(MoO4)4 was found to crystallize from Li2(MoO4)2–LiY(MoO4)2 flux, but its structure has not been determined.20 Its d values resemble that of a compound that was (wrongly) described to be a triclinic modification of LiY(MoO4)2.21
We will now describe for the first time the crystal structures of several red-emitting phosphors (Fig. 1) in the system Li3.5(Y1−xEux)1.5(MoO4)4 with x = 0, 0.1, 0.25, 0.5, 0.75, 1 and discuss their thermal stability and luminescence properties.
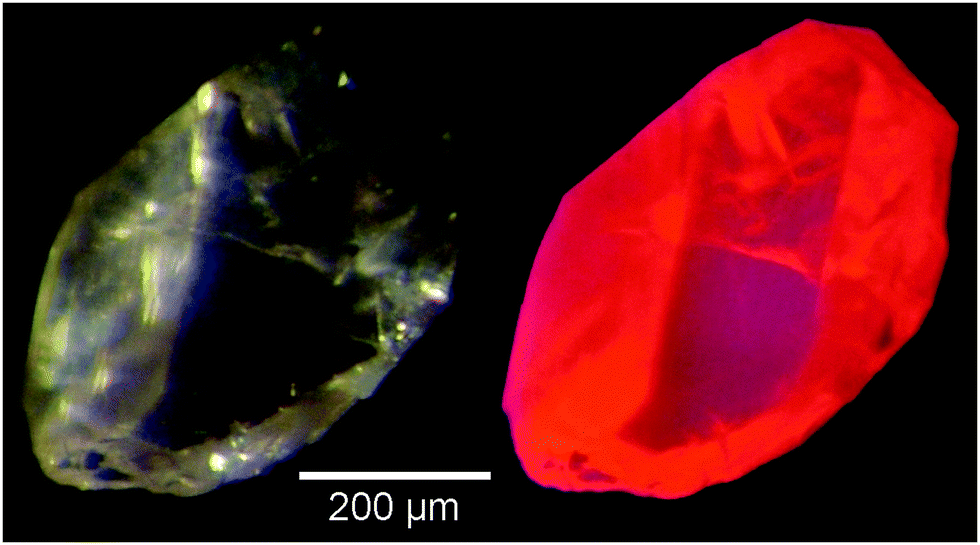 | ||
| Fig. 1 Crystal of Li3.5Eu1.5(MoO4)4 under day light (left) and UV light (right). | ||
2. Experimental
Synthesis and crystallization
Lithium carbonate (Merck, PA), molybdenum trioxide (Alpha Aesar, 99.95%) and rare-earth oxides Y2O3 and Eu2O3 (Chempur, 99.99%) were used as starting materials. A mixture of Li2CO3, RE2O3 (1−x Y2O3 + x Eu2O3) and MoO3 powders in the molar ratio of Li![[thin space (1/6-em)]](https://www.rsc.org/images/entities/char_2009.gif) :RE:Mo = 36:2:21 were first ground in an agate mortar and then transferred to a platinum crucible. The mixtures were heated in air from room temperature to 1373 K (100 K h−1), maintained for six hours at the maximum temperature to homogenize the melt, then cooled to 1023 K at 100 K h−1 and to 773 K at 2 K h−1. The melting point of pure Li2MoO4 is 978 K,22 but the solidification of the flux described here must take place below 957 K according to the decomposition temperatures observed for some of the products obtained (see below). Finally, the samples were quenched to room temperature. The Li2MoO4-flux was dissolved in hot water.
:RE:Mo = 36:2:21 were first ground in an agate mortar and then transferred to a platinum crucible. The mixtures were heated in air from room temperature to 1373 K (100 K h−1), maintained for six hours at the maximum temperature to homogenize the melt, then cooled to 1023 K at 100 K h−1 and to 773 K at 2 K h−1. The melting point of pure Li2MoO4 is 978 K,22 but the solidification of the flux described here must take place below 957 K according to the decomposition temperatures observed for some of the products obtained (see below). Finally, the samples were quenched to room temperature. The Li2MoO4-flux was dissolved in hot water.
Thermal analyses
Differential thermal analysis (DTA) and thermogravimetric analyses (TGA) were performed using an STA 409 EP instrument (Netzsch, Selb, Germany). The samples were heated from 293 K to 1073 K in air (5 K min−1).X-ray powder diffraction
Data were collected at room temperature using a powder diffractometer with transmission geometry (Stadi P, Stoe, Darmstadt, Germany, PSD detector, Ge monochromator, CuKα1: λ = 1.54056 Å, and flat plate sample holder). Phase analyses and the refinements of the lattice parameters were performed using the TOPAS program.23Single crystal diffractometry
Intensity data were measured on an image plate diffraction system (IPDS, Stoe, Darmstadt, Germany, MoKα: λ = 0.71073 Å) at ambient temperatures. Numerical absorption corrections were applied using the X-RED and X-SHAPE software.24 Structure refinements were performed using the SHELX-9725 suite in the WinGX26 framework. The normalized atomic coordinates of the isostructural compound Li3.5Ho1.5(MoO4)418 were taken as starting values for all the least squares refinements.Photoluminescence spectroscopy
Emission and excitation spectra of crystalline powders were acquired using a Fluorolog3 spectrofluorometer (Model Fl3-22, Horiba Jobin-Yvon, Bensheim, Germany) equipped with a 450 W xenon lamp, double Czerny–Turner monochromators, which allow a resolution down to 0.05 nm, and the photomultiplier detection equipment R928P with a photon counting system. A liquid Helium closed-cycle cryostat was used to perform measurements at 10 K. Emission spectra were corrected for the photomultiplier sensitivity and excitation spectra were corrected for the lamp intensity.Quantum yield was measured using a Fluorolog3 spectrofluorometer with an additional Ulbricht sphere; reflection intensities were corrected.
3. Results and discussion
Samples of Li3.5(Y1−xEux)1.5(MoO4)4 with x = 0, 0.1, 0.25, 0.5, 0.75 and 1 were obtained from high-temperature reactions in Li2MoO4 fluxes as single crystals. X-ray powder diffraction patterns (Fig. 2) of the crushed products show that mostly single-phase Li3.5(Y1−xEux)1.5(MoO4)4 samples were obtained (except for 2% of the side product LiEu(MoO4)2 in one of the samples; its main reflection is marked with an asterisk). | ||
| Fig. 2 X-ray powder diffraction patterns of Li3.5(Y1−xEux)1.5(MoO4)4 (a) x = 0.00, (b) x = 0.10, (c) x = 0.25, (d) x = 0.50, (e) x = 0.75 and (f) x = 1.00 (the asterisk marks the main reflection of LiEu(MoO4)2, see text). | ||
Thermal analyses reveal that Li3.5(Y1−xEux)1.5(MoO4)4 are stable up to 995 K, which makes them suitable materials for light emitting diodes. The decomposition temperatures according to DTA depend remarkably on their composition (Fig. 3). For undoped Li3.5Y1.5(MoO4)4, a decomposition temperature of 995 K was measured, which is a bit lower than was reported earlier (1008 K).20 With an increase in Eu3+-substitution, the decomposition temperature decreases to 957 K for Li3.5(Y0.25Eu0.75)1.5(MoO4)4. The decomposition of Li3.5Eu1.5(MoO4)4 takes place at 958 K and no weight changes were observed in the TGA traces.
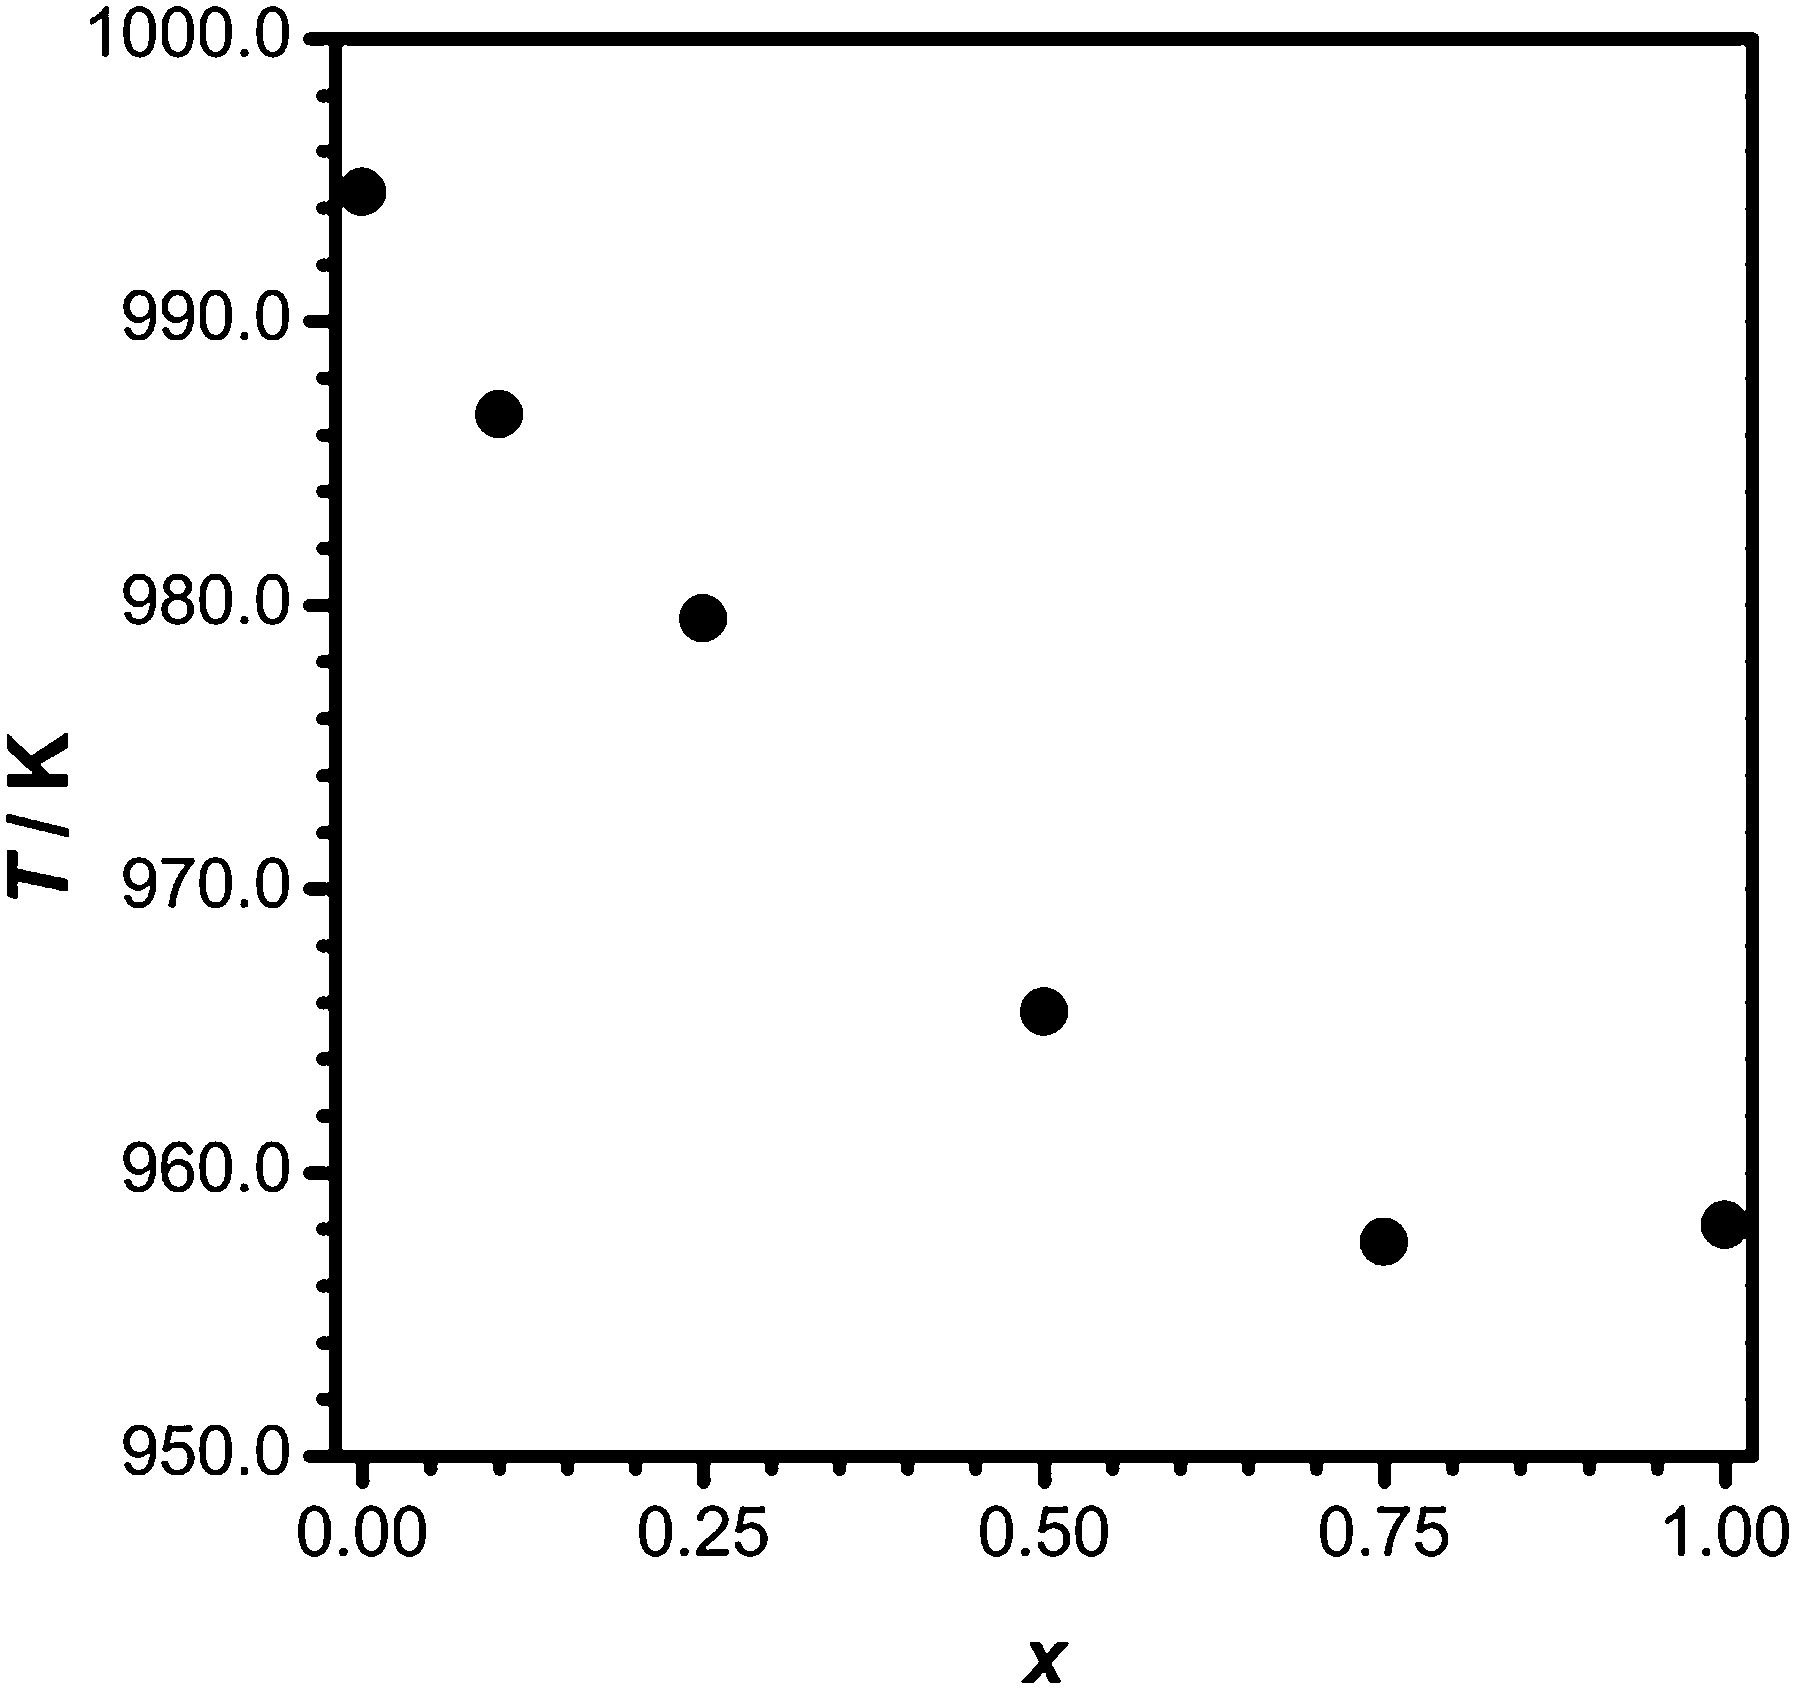 | ||
| Fig. 3 Decomposition temperatures of Li3.5(Y1−xEux)1.5(MoO4)4. | ||
X-ray powder diffraction investigations of the residues obtained after the DTA/TGA experiments showed that the samples decompose and form Li2MoO4 and LiY1−xEux(MoO4)2 (eqn (1)).
| 2Li3.5(Y1−xEux)1.5(MoO4)4 → 3LiY1−xEux(MoO4)2 + 2Li2MoO4 | (1) |
| Formulae | x | a/Å | b/Å | c/Å | α/° | β/° | γ/° | V/Å3 |
|---|---|---|---|---|---|---|---|---|
| Li3.5Y1.5(MoO4)4 | 0.00 | 5.1875(2) | 6.6380(2) | 10.2731(4) | 100.082(3) | 100.257(2) | 111.943(2) | 311.36(2) |
| Li3.5Y1.35Eu0.15(MoO4)4 | 0.10 | 5.1944(2) | 6.6500(2) | 10.2825(4) | 100.086(3) | 100.273(3) | 111.931(2) | 312.62(2) |
| Li3.5Y1.125Eu0.375(MoO4)4 | 0.25 | 5.1993(2) | 6.6615(2) | 10.2876(4) | 100.100(2) | 100.300(2) | 111.914(2) | 313.59(2) |
| Li3.5Y0.75Eu0.75(MoO4)4 | 0.50 | 5.2107(3) | 6.6850(4) | 10.3025(7) | 100.106(4) | 100.362(4) | 111.879(4) | 315.82(4) |
| Li3.5Y0.375Eu1.125(MoO4)4 | 0.75 | 5.2198(2) | 6.7057(3) | 10.3141(4) | 100.116(3) | 100.396(3) | 111.860(2) | 317.69(2) |
| Li3.5Eu1.5(MoO4)4 | 1.00 | 5.2283(3) | 6.7253(3) | 10.3267(6) | 100.116(4) | 100.450(3) | 111.840(3) | 319.49(3) |
Fig. 4 demonstrates the linear increase of the unit cell volume with an increase in x. The pseudo-binary system Li3.5Y1.5(MoO4)4–Li3.5Eu1.5(MoO4)4 thus forms a solid solution, and the lattice parameters follow Vegard's law. x values obtained from the powder data agree well with the expected Eu content according to the original sample weight.
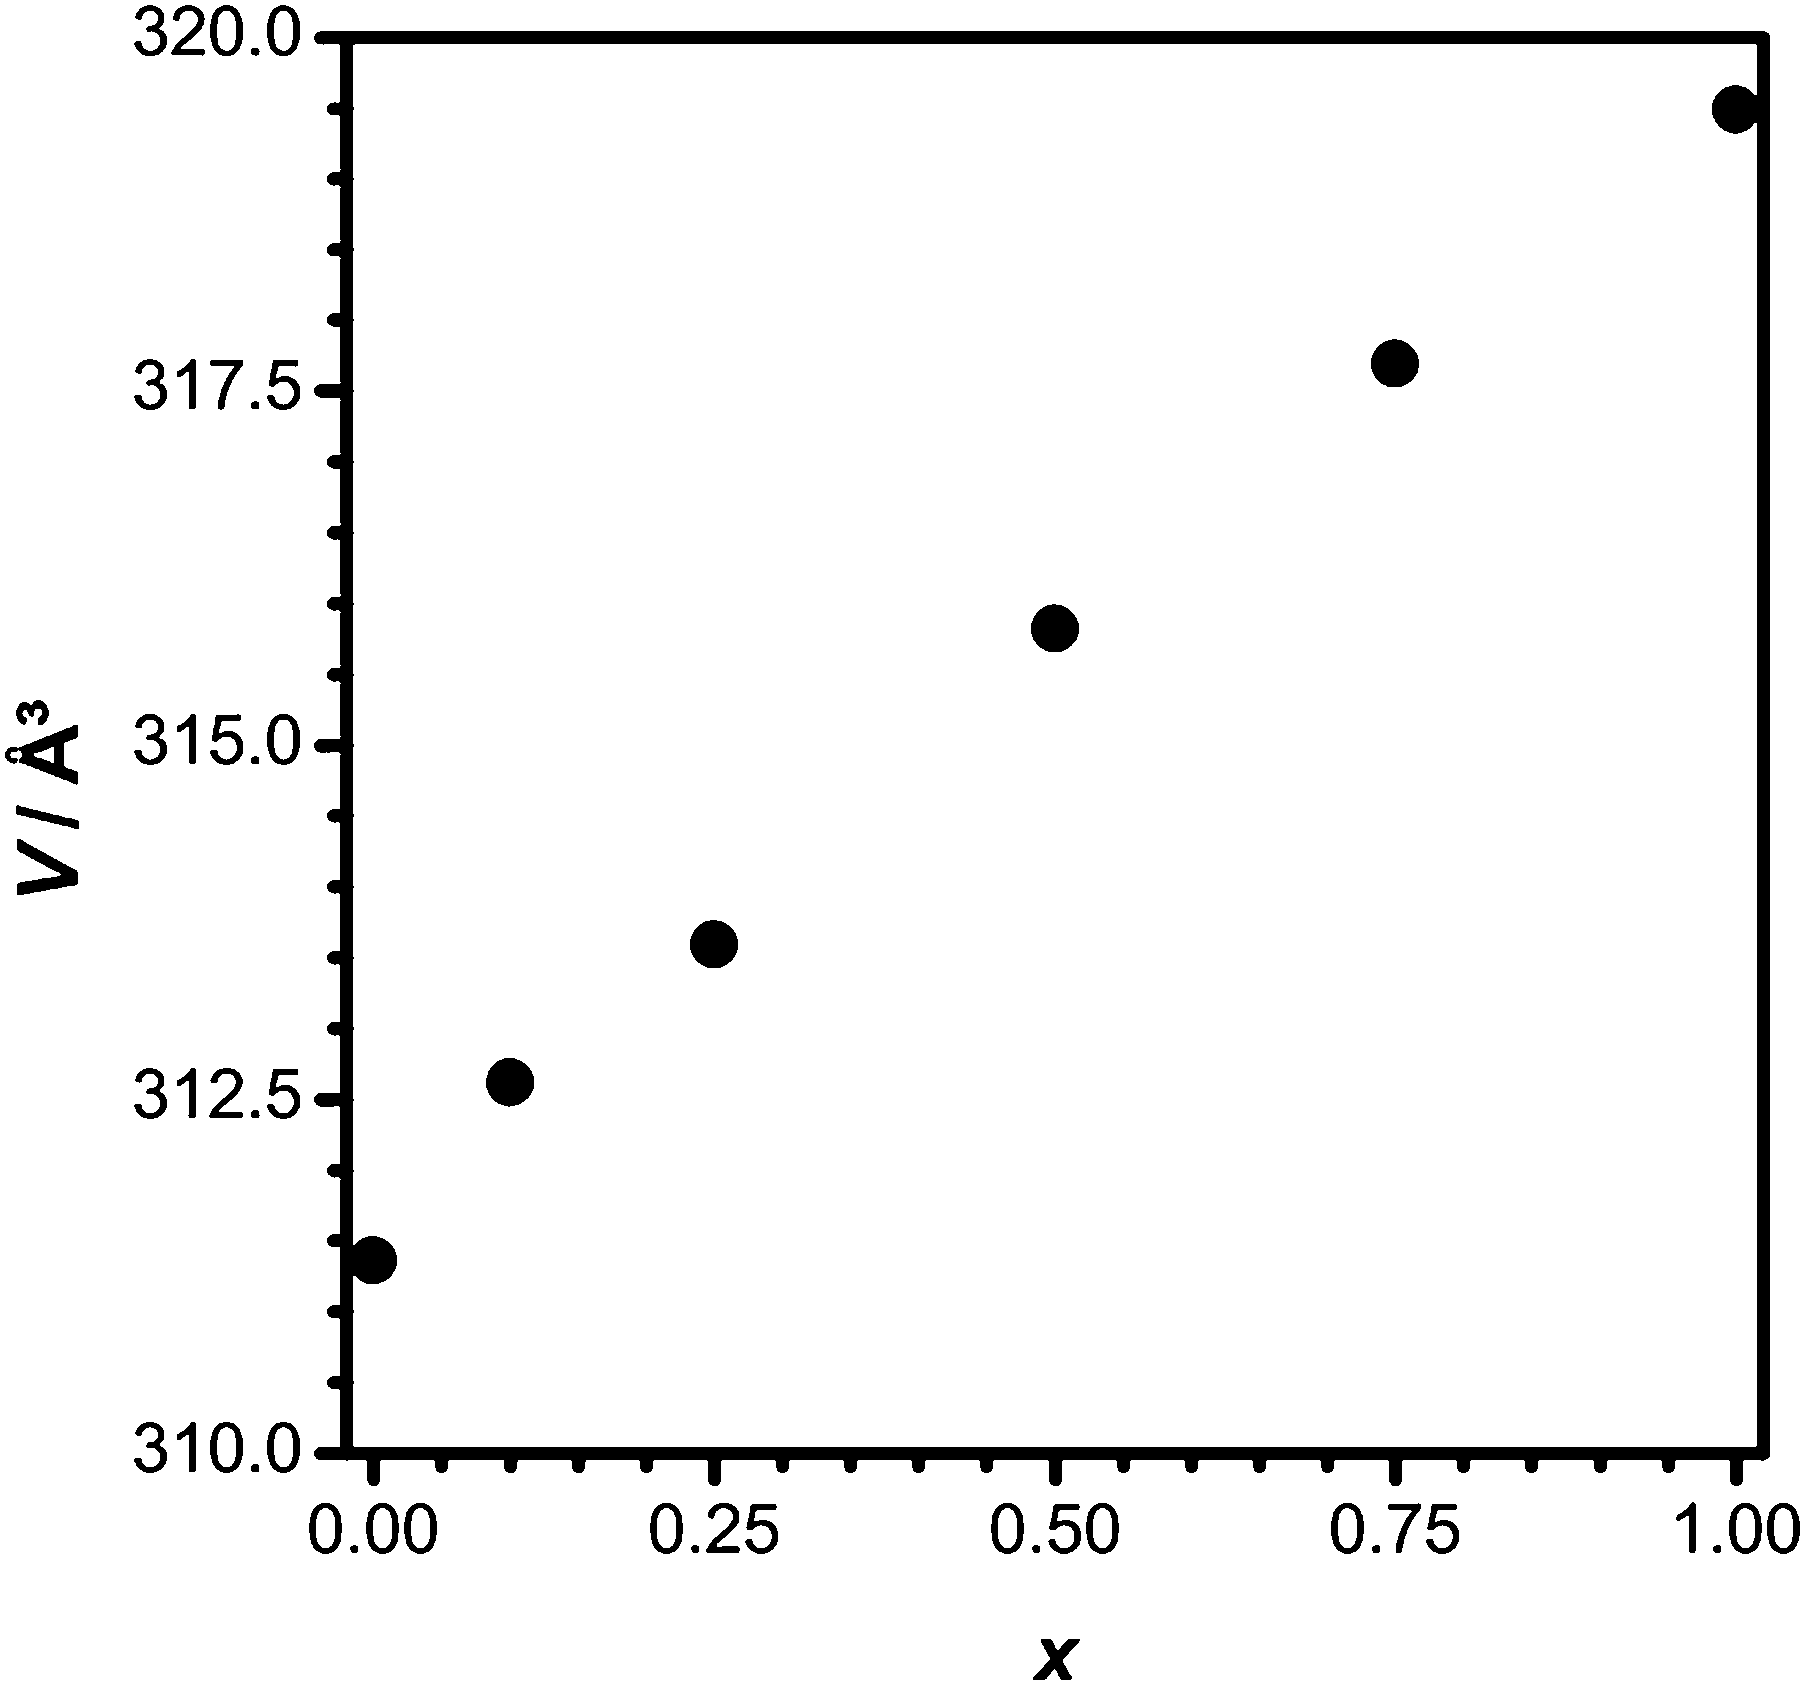 | ||
| Fig. 4 V/x dependence of Li3.5(Y1−xEux)1.5(MoO4)4. | ||
The color of the crystals changes from colorless for the pure yttrium-compound to light pinkish for the pure europium-compound.
The crystal structures of Li3.5(Y1−xEux)1.5(MoO4)4 with x = 0, 0.1, 0.25, 0.5, 0.75 and 1.0 were refined based on single-crystal data (Table 2). They consist of layers of isolated [MoO4] tetrahedra and distorted [MO8] square antiprisms (M: 25% Li + 75% RE with RE = Y1−xEux) (Fig. 5). The arrangement of the [MO8] (RE1 and Li1 site) and [MoO4] polyhedra is similar to that in scheelite. The layers are perpendicular to (001). Additional Li atoms are placed on the Li2 and Li3 sites (Wyckoff position 1a) in between the layers. Li2 is coordinated by four oxygen atoms, which form a rectangle. The coordination sphere of the lithium ions on the Li3 site is that of a distorted octahedron of oxygen atoms. The ratio of Li1 and RE1 on the substitutionally disordered M1 site was found to be very close to 1:3 by refining the occupancies. In a later refinement cycle, these values were fixed to ensure charge balance. The positional and anisotropic displacement parameters of Li1 and RE1 atoms were constrained to be identical.25 The final atomic coordinates and displacement parameters are reported in the supplementary material (Tables S1a–S2f, ESI†), as well as selected interatomic distances and angles (Table S3a–f and Fig. S1–S5, ESI†).
| Composition | Li3.5Y1.5 (MoO4)4 | Li3.5Y1.35Eu0.15 (MoO4)4 | Li3.5Y1.125Eu0.375 (MoO4)4 | Li3.5Y0.75Eu0.75 (MoO4)4 | Li3.5Y0.375Eu1.125 (MoO4)4 | Li3.5Eu1.5 (MoO4)4 |
|---|---|---|---|---|---|---|
| Molecular weight | 797.42 | 806.87 | 821.06 | 844.7 | 868.35 | 891.99 |
| Crystal system | Triclinic | |||||
| Space group |
P (no. 2) |
|||||
| Lattice parameters | (From powder XRD data) | |||||
| a/Å | 5.1875(2) | 5.1944(2) | 5.1993(2) | 5.2107(3) | 5.2198(2) | 5.2283(3) |
| b/Å | 6.6380(2) | 6.6500(2) | 6.6615(2) | 6.6850(4) | 6.7057(3) | 6.7253(3) |
| c/Å | 10.2731(4) | 10.2825(4) | 10.2876(4) | 10.3025(7) | 10.3141(4) | 10.3267(6) |
| α/° | 100.082(3) | 100.086(3) | 100.100(2) | 100.106(4) | 100.116(3) | 100.116(4) |
| β/° | 100.257(2) | 100.273(3) | 100.300(2) | 100.362(4) | 100.396(3) | 100.450(3) |
| γ/° | 111.943(2) | 111.931(2) | 111.914(2) | 111.879(4) | 111.860(2) | 111.840(3) |
| Unit cell volume/Å3 | 311.36(2) | 312.62(2) | 313.59(2) | 315.82(4) | 317.69(2) | 319.49(3) |
| Z | 1 | |||||
| Absorp. coeff./mm−1 | 10.92 | 10.93 | 10.99 | 11.03 | 11.09 | 11.15 |
| Density (calculated) | 4.253 | 4.286 | 4.348 | 4.441 | 4.539 | 4.636 |
| Crystal colour | Colorless | Colorless | Colorless | Light pink | Light pink | Light pink |
| Crystal shape | Block | Block | Block | Block | Prism | Prism |
| Crystal size/mm3 | 0.40·0.35·0.30 | 0.27·0.22·0.15 | 0.47·0.34·0.21 | 0.42·0.32·0.22 | 0.29·0.22·0.09 | 0.35·0.20·0.07 |
| F(000) | 365 | 369 | 374 | 383 | 392 | 401 |
| Temperature/K | 293(2) | 293(2) | 293(2) | 293(2) | 293(2) | 293(2) |
| Diffractometer | STOE IPDS 2, Mo-Kα, λ = 0.71073 Å, graphite monochromator | |||||
| Absorption correction | Numerical24 | |||||
| Theta range/° | 2.09–30.35 | 2.09–30.44 | 2.09–30.39 | 3.41–30.27 | 2.08–30.28 | 2.08–30.40 |
| Reflections collected | 6526 | 6695 | 6726 | 6489 | 6524 | 6873 |
| Independent reflections | 1867 (Rint = 0.0966) | 1893 (Rint = 0.0937) | 1899 (Rint = 0.1144) | 1868 (Rint = 0.1052) | 1884 (Rint = 0.0715) | 1931 (Rint = 0.0654) |
| Independent reflections I > 2σ(I) | 1700 | 1636 | 1728 | 1534 | 1579 | 1566 |
| Index ranges | −7 ≤ h ≤ 7 | −6 ≤ h ≤ 7 | −7 ≤ h ≤ 7 | −7 ≤ h ≤ 7 | −7 ≤ h ≤ 7 | −7 ≤ h ≤ 7 |
| −9 ≤ k ≤ 9 | −9 ≤ k ≤ 9 | −9 ≤ k ≤ 9 | −8 ≤ k ≤ 9 | −9 ≤ k ≤ 9 | −9 ≤ k ≤ 9 | |
| −14 ≤ l ≤ 14 | −14 ≤ l ≤ 14 | −14 ≤ l ≤ 14 | −14 ≤ l ≤ 14 | −14 ≤ l ≤ 14 | −14 ≤ l ≤ 14 | |
| Parameters | 106 | 106 | 106 | 106 | 106 | 106 |
| R indices/all data | R 1 = 3.81% | R 1 = 4.29% | R 1 = 3.71% | R 1 = 4.30% | R 1 = 3.79% | R 1 = 3.70% |
| wR2 = 9.35% | wR2 = 7.85% | wR2 = 8.72% | wR2 = 8.18% | wR2 = 7.25% | wR2 = 6.70% | |
| R indices/I > 2σ(I) | R 1 = 3.41% | R 1 = 3.55% | R 1 = 3.38% | R 1 = 3.44% | R 1 = 3.06% | R 1 = 2.91% |
| wR2 = 9.12% | wR2 = 7.59% | wR2 = 8.54% | wR2 = 7.88% | wR2 = 7.02% | wR2 = 6.50% | |
| Goodness-of-fit on F2 | 1.118 | 1.088 | 1.105 | 1.055 | 1.082 | 1.046 |
| Weighting scheme | A = 0.0458; B = 0.2597 | A = 0.0272; B = 0.5208 | A = 0.0264; B = 0.4439 | A = 0.0301; B = 0 | A = 0.0263; B = 0.7076 | A = 0.0330; B = 0 |
| 1.639 | 1.810 | 1.635 | 1.849 | 1.693 | 1.903 | |
| Largest diff. peak and hole/e Å−3 | −1.354 | −1.299 | −1.417 | −1.391 | −1.801 | −2.105 |
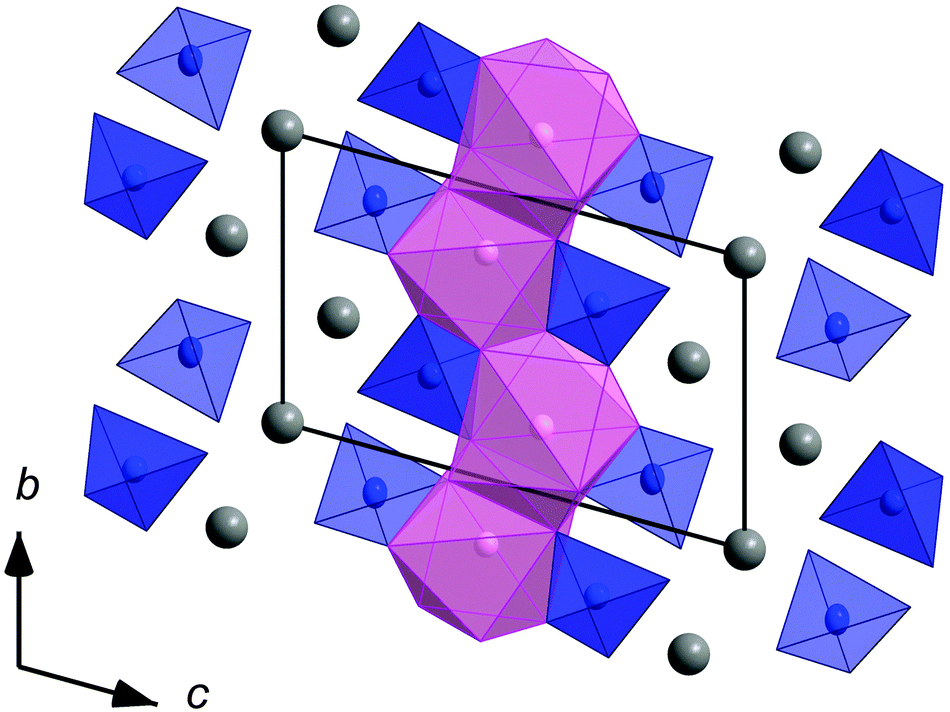 | ||
| Fig. 5 Crystal structure of Li3.5(Y1−xEux)1.5(MoO4)4 (blue: [MoO4] tetrahedra, pink: [MO8] polyhedra (M: 75% RE + 25% Li; RE: Y1−xEux) and grey: Li). | ||
All the samples of the solid solution show bright red emission, which is typical for Eu3+ phosphors. Luminescence measurements were performed on the unsubstituted material (x = 1) and on that with 10% doping concentration (x = 0.1). The room temperature emission and excitation spectra of the latter are shown in Fig. 6, while the emission and excitation spectra of both compounds at 10 K are depicted in Fig. 7 and 9, respectively. An enlargement of the emission spectrum at 10 K of Li3.5(Y0.9Eu0.1)1.5(MoO4)4 is shown in Fig. 8.
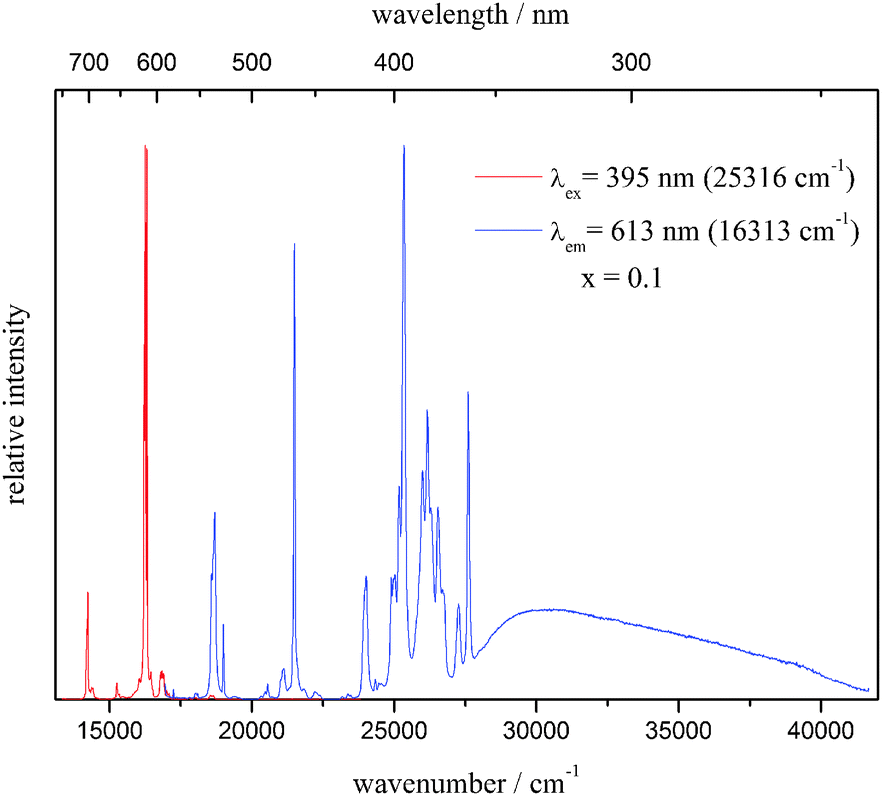 | ||
| Fig. 6 Emission (left, red line) and excitation (right, blue line) of Li3.5(Y0.9Eu0.1)1.5(MoO4)4 at room temperature. | ||
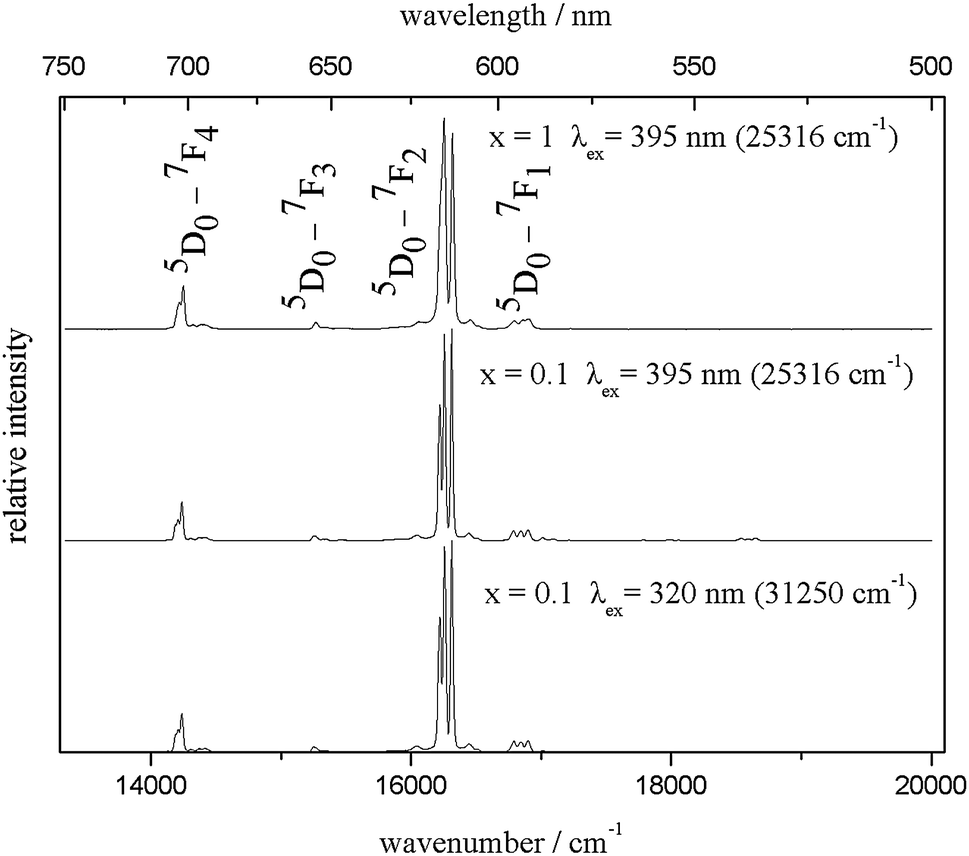 | ||
| Fig. 7 Emission spectra of Li3.5(Y1−xEu0.1)1.5(MoO4)4 for x = 1 (top) and x = 0.1 (middle and bottom) measured at 10 K. | ||
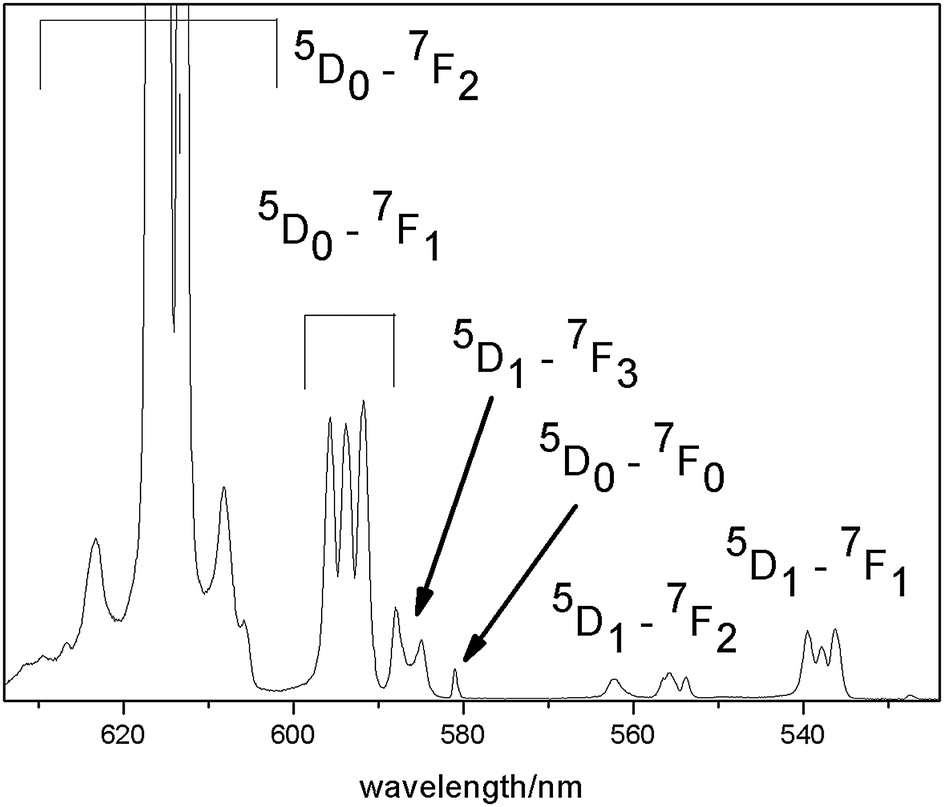 | ||
| Fig. 8 Enlargement of the emission spectrum of Li3.5(Y0.9Eu0.1)1.5(MoO4)4 at 10 K, λex = 395 nm. | ||
 | ||
| Fig. 9 Excitation spectra of Li3.5(Y1−xEu0.1)1.5(MoO4)4 for x = 1 (top) and x = 0.1 (bottom) at 10 K, λem = 613 nm. | ||
The shape of the emission spectra at 10 K (Fig. 7) is remarkable because only the 5D0 → 7F2 transition has a considerable contribution, while 5D0 → 7F1,3,4 are rather weak and 5D0 → 7F0 is only visible with extremely low intensity (Fig. 8). This feature can be explained due the low site symmetry occupied by the Eu ions (point group Ci). In general, 5D0 → 7F0 are observed only for Cnv, Cn, or Cs symmetry, because this transition is strictly forbidden according to the Judd-Offelt theory and only becomes partly allowed due to J-mixing.26 In the present case, this observation might be explained by mixing of charge-transfer states into the wave functions of the 4f6 configuration.27
While in general, 5D0 → 7F1 can be taken to be constant in intensity, the so called hypersensitive transition 5D0 → 7F2 is mainly influenced by the environment. The ratio I(5D0 → 7F2)/I(5D0 → 7F1) can be used to determine the degree of the asymmetry of the Eu side.28 In the present case, this ratio was determined to be 11.3 for Li3.5Eu1.5(MoO4)4 and 12.2 for Li3.5(Y0.9Eu0.1)1.5(MoO4)4. This high ratio can be explained by the low Eu site symmetry. It should be mentioned that the high intensity of 5D0 → 7F2 relative to the other transitions depicts the excellent color quality of these materials. As it is obvious from Fig. 8, 5D0 → 7F1 splits into three Stark levels, which led to the conclusion that the Eu ions occupy only one site, as described above. However, a small shoulder can be observed at about 598 nm. Therefore, it cannot be excluded that an extremely small amount of Eu3+ ions are also located at another site. Moreover, some very weak emission transitions starting from the 5D1 state could be observed even at 10 K (Fig. 8).
The low temperature excitation spectra (Fig. 9) consist of two different features. At energies lower than approximately 27500 cm−1, 4f6 → 4f6 line transitions are observed, which can be assigned to 7F0 → 5D1 at 525.8 nm, 7F0 → 5D2 at 465.2 nm and 7F0 → 5L6 at 395.2 nm. The second feature is a broad band starting at approximately 28290 cm−1 (354 nm), which can be assigned to the charge-transfer excitation O2− → Mo6+. After excitation into this CT state, no CT emission was observed, but only Eu3+ emission, which is identical to that detected after direct Eu excitation (Fig. 7, middle and bottom). This observation proves the high efficiency of the energy transfer process CT → Eu3+. The ratios of the integrated excitation intensities detecting Eu emission I(CT)/I(Eu) are determined to be 1.23 for x = 1 and 5.48 for x = 0.1. The reason for this observation may not be the more intense energy transfer efficiency for the doped material, but the higher excitation probability of the CT transitions compared to Eu excitation due to the lower Eu concentration.
Quantum yield measurements of direct Eu excitation of the 10% doped material gave the remarkable value of 44%, and this may be explained by the low vibrational quenching processes in these compounds. The quantum yield of Eu emission after CT excitation is, however, decreased to 22%. Obviously, there are some other pathways to quench the excitation energy.
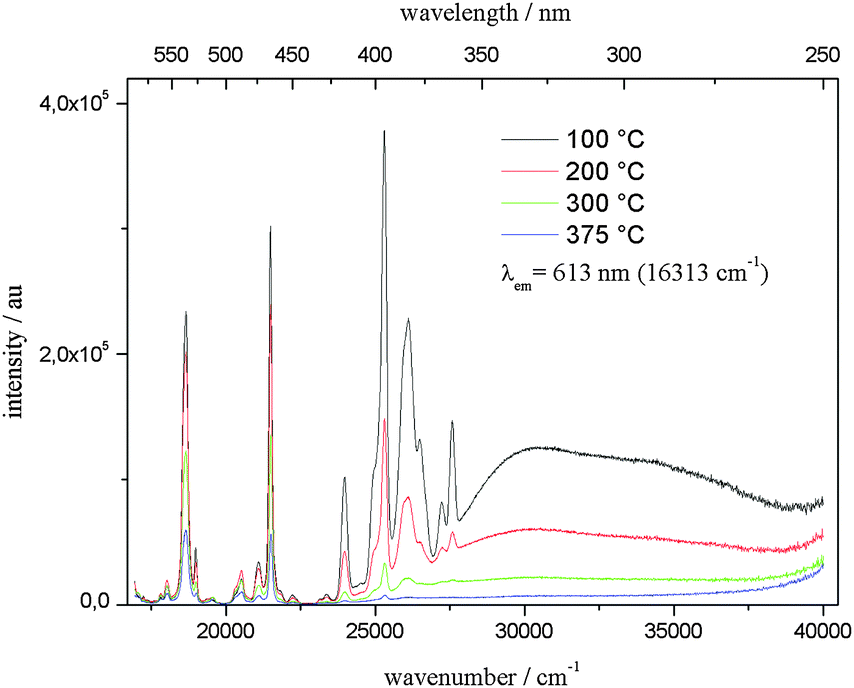
For applications of phosphors, it is important to investigate their thermal stability and the change in their luminescence properties at elevated temperatures because of the working temperatures of LEDs at 150–200 °C.29 Therefore, the optical behavior at temperatures up to 375 °C was investigated. Fig. 10 depicts the temperature-dependent emission spectra. The emission intensity at 100 °C is approximately 70% of that at room temperature, while it drops to approximately 10% at 375 °C.
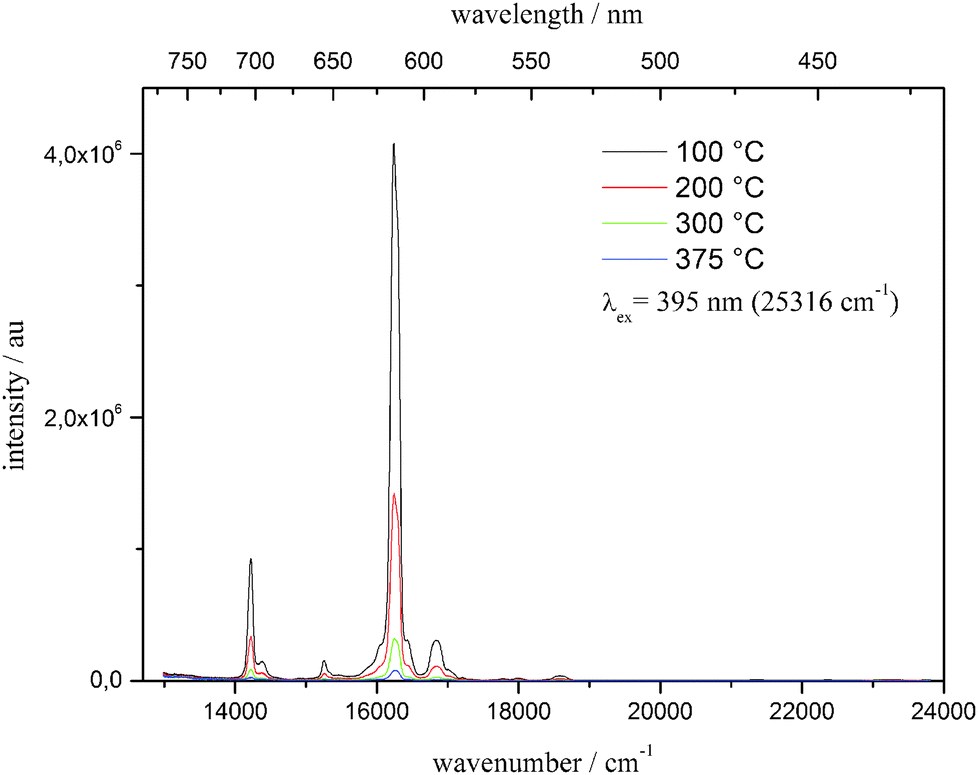 | ||
| Fig. 10 Temperature-dependent emission spectra of Li3.5(Y0.9Eu0.1)1.5(MoO4)4 between 100 and 375 °C, λex = 395 nm. | ||
The high-temperature excitation spectra are shown in Fig. 11. While the intensities of the 4f–4f excitation bands at high temperatures are, again, lowered to a rather large extent (at 375 °C to about 25% compared to that at room temperature), it is remarkable that the CT excitation band is nearly completely quenched at 375 °C. Obviously, the amount of vibrational radiationless relaxation is more efficient for the latter that for the 4f–4f excitation. This can be explained by the large increase in the Eu–O distances of the CT state compared to that of the ground state, which probably leads to coupling between the vibrational states of the excited and the ground state, which is not the case for the excited 4f states with comparable internuclear distances of excited and ground states.
 | ||
| Fig. 11 Temperature-dependent excitation spectra of Li3.5(Y0.9Eu0.1)1.5(MoO4)4 between 100 and 375 °C, λex = 613 nm. | ||
4. Conclusions
Crystals of the red-emitting phosphor Li3.5(Y1−xEux)1.5(MoO4)4 with x = 0, 0.1, 0.25, 0.5, 0.75 and 1 have been successfully synthesized via flux synthesis. Solid solutions in the pseudo-binary system of Y- and the Eu-compounds were observed and investigated for the first time. The crystal structures of Li3.5(Y1−xEux)1.5(MoO4)4 were determined. The fact that CT excitation followed by efficient energy transfer yielded intense red Eu3+ emission and also high color quality due to the large intensity of 5D0 → 7F2 transitions with respect to the other intensities shows the qualification of these materials for future light-emitting diodes.Acknowledgements
Financial support of the Deutsche Forschungsgemeinschaft (AL536/14-1, DR374/16-1) and the Darmstadt Graduate School of Excellence Energy Science and Engineering is gratefully acknowledged. We would like to thank Dipl.-Ing. Dennis Henge for DTA/TGA measurements.Notes and references
- P. Pust, P. J. Schmidt and W. Schnick, Nat. Mater., 2015, 14, 454–458 CrossRef CAS PubMed
.
- U. Kolitsch, Z. Kristallogr., 2001, 216, 449–454 CAS
- Y. W. Wei, Y. J. Chen, Y. F. Lin, X. H. Gong, Z. D. Luoand and Y. D. Huang, J. Alloys Compd., 2009, 484, 529–534 CrossRef CAS
- X. Huang and G. Wang, J. Alloys Compd., 2009, 475, 693–697 CrossRef CAS
- X. Huang, Z. Hu, Z. Lin and G. Wang, J. Cryst. Growth, 2005, 276, 177–181 CrossRef CAS
- V. Volkov, C. Cascales, A. Kling and C. Zaldo, Chem. Mater., 2005, 17, 291–300 CrossRef CAS
- L. Yi, X. He, L. Zhou, F. Gong, R. Wang and J. Sun, J. Lumin., 2010, 130, 1113–1117 CrossRef CAS
- A. V. Zaushitsyn, V. V. Mikhailin, A. Yu. Romanenko, E. G. Khaikina, O. M. Basovich, V. A. Morozov and B. I. Lazoryak, Inorg. Mater., 2005, 41, 766–770 CrossRef CAS
- X. Zhou, T. Zhou, Y. Li and Q. Feng, J. Rare Earths, 2012, 30, 315–319 CrossRef CAS
- J. P. M. Van Vliet and G. Blasse, J. Solid State Chem., 1988, 76, 160–166 CrossRef CAS
- Y. Li and X. Liu, J. Lumin., 2014, 151, 52–56 CrossRef CAS
- L. Li, J. Zhang, W. Zi, S. Gan, G. Ji, H. Zou and X. Xu, Solid State Sci., 2014, 29, 58–65 CrossRef CAS
- G. Benoît, J. Véronique, A. Arnaud and G. Alain, Solid State Sci., 2011, 13, 460–467 CrossRef
- Z. Wang, H. Liang, M. Gong and Q. Su, Mater. Lett., 2008, 62, 619–622 CrossRef CAS
- Z. Wang, H. Liang, M. Gong and Q. Su, Opt. Mater., 2007, 29, 896–900 CrossRef CAS
- Z. Wang, H. Liang, M. Gong and Q. Su, J. Alloys Compd., 2007, 432, 308–312 CrossRef CAS
- T. Kimand and S. Kang, J. Lumin., 2007, 122–123, 964–966 Search PubMed
- E. N. Ipatova, R. F. Klevtsova, L. P. Solov'eva and P. V. Klevtsov, J. Struct. Chem., 1982, 23, 418–422 CrossRef
- D. Zhao, J. Zhu, P. Liang, H. Chang and R. He, Acta Crystallogr., Sect. E: Struct. Rep. Online, 2012, 68, i14 CAS
- L. P. Kozeeva and P. V. Klevtsov, Izv. Acad. Nauk SSSR, Neorg. Mater., 1972, 8, 1328–1329 CAS
- Y. Le Page and P. Strobel, Acta Crystallogr., Sect. B: Struct. Crystallogr. Cryst. Chem., 1980, 36, 1919–1920 CrossRef
- M. Moser, D. Klimm, S. Ganschow, A. Kwasniewski and K. Jacobs, Cryst. Res. Technol., 2008, 43, 350–354 CrossRef CAS
- Bruker AXS Topas 4.2, 4.2; Karlsruhe, Germany, 2009.
- Program X-AREA, X-RED, Stoe&Cie; Darmstadt, Germany, 2009; Program X-SHAPE, Stoe&Cie; Darmstadt, Germany, 2009.
- G. Sheldrick, Acta Crystallogr., Sect. A: Found. Crystallogr., 2008, 64, 112–122 CrossRef CAS PubMed
- L. Farrugia, J. Appl. Crystallogr., 2012, 45, 849–854 CrossRef CAS
- K. Binnemans, Coord. Chem. Rev., 2015, 295, 1–45 CrossRef CAS
- X. Y. Chen and G. K. Liu, J. Solid State Chem., 2005, 178, 419–428 CrossRef CAS
-
C. Ronda, Luminescence – From Theory to Applications, Wiley-VCH, Weinheim, 2008 Search PubMed
Footnote |
| † Electronic supplementary information (ESI) available: Atomic coordinates and displacement parameters of Li3.5(Y1−xEux)1.5(MoO4)4 (x = 0, 0.1, 0.25, 0.5, 0.75, 1) (Tables S1a–S2f), selected interatomic distances and angles (Table S3a–f and Fig. S1–S5). Further details of the crystal structure investigation may be obtained from Fachinformationszentrum Karlsruhe, 76344 Eggenstein-Leopoldshafen, Germany [E-mail crysdata@fiz-karlsruhe.de; Web: http://www.fiz-karlsruhe.de/request_for_deposited_data.html; Fax: (+49)7247-808-666] upon quoting the CSD numbers for Li3.5(Y1−xEux)1.5(MoO4)4 (x = 0.00: 427655; x = 0.10: 427656; x = 0.25: 427657; x = 0.50: 427658; x = 0.75: 427659; x = 1.00: 425893). See DOI: 10.1039/c5tc02515j |
| This journal is © The Royal Society of Chemistry 2016 |