A single fluorescent probe for multiple analyte sensing: efficient and selective detection of CN−, HSO3− and extremely alkaline pH†
Jianbin
Chao
*a,
Zhiqing
Li
ab,
Yongbin
Zhang
a,
Fangjun
Huo
a,
Caixia
Yin
c,
Yuhong
Liu
ab,
Yingqi
Li
b and
Juanjuan
Wang
d
aResearch Institute of Applied Chemistry, Shanxi University, Taiyuan 030006, P. R. China. E-mail: chao@sxu.edu.cn; Fax: +86-351-701-6048; Tel: +86-351-701-7838
bSchool of Chemistry and Chemical Engineering, Shanxi University, Taiyuan 030006, China
cInstitute of Molecular Science, Shanxi University, Taiyuan, 030006, China
dScientific Instrument Center, Shanxi University, Taiyuan, 030006, China
First published on 18th April 2016
Abstract
A simple tailor-made water-soluble broadly emitting (500–650 nm) fluorescent probe 3-methyl-2-(N-ethylcarbazole-3vinyl)-benzothiazolium iodide (IECBT) for the selective and sensitive detection of multiple analytes, including CN−, HSO3− and extremely alkaline pH, is designed and synthesized via the ethylene bridging of 3-formyl-N-ethylcarbazole and 2,3-dimethyl benzothizolium iodide, which is a useful fluorescent probe for monitoring these analytes at extremely low concentrations quantitatively. CN− and HSO3− are expected to undergo 1,4-addition reactions with the C-4 atom in the ethylene group of IECBT. This water-soluble fluorescent probe exhibits excellent sensitivity and selectivity toward CN− in DMSO, which also results in a prominent fluorescence ratiometric change and a color change. The high selectivity and sensitivity of IECBT toward HSO3− and extremely alkaline pH over other coexisting species in water are also observed. The titration experiments show that it features a remarkably large Stokes shift and good stability towards CN−, HSO3− or extremely alkaline pH with a significant fluorescence turn-off response. Importantly, we demonstrate that IECBT can be used for the real-time sensing and bioimaging of CN−, HSO3− or extremely alkaline pH in living samples.
1. Introduction
The development of new synthetic chromophores/probes for the efficient detection of various chemically, environmentally, and biologically significant species has witnessed a surge over the past few years.1 Especially, the recognition and sensing of anions have been of considerable interest because of their critical impact on physiological and environmental systems.2 Various anions have different roles and importance.3 Among various anions, cyanide (CN−) is one of the most concerning anions because it is an extremely toxic anion and can directly lead to the death of organisms.4 However, cyanide salts are still used as industrial materials in plastics production, gold mining, and other fields.5 Bisulfite (HSO3−) is another important ion which has been widely used as an antimicrobial agent, an enzyme inhibitor, and an antioxidant in food, beverages, and pharmaceutical products.6 Unfortunately, extensive intake of HSO3− would lead to harmful effects in tissue, cells, and biomacromolecules, causing asthmatic attacks and allergic reactions in some individuals.7 Many reports have appeared in the literature describing the detection of either CN− or HSO3− ions,8 but examples of a sensor which can detect both anions are relatively less known. Notably, intracellular pH plays a vital role in cell biology including receptor-mediated signal transduction, calcium regulation, ion transport, and homeostasis.9 Therefore, monitoring pH in live cells is highly desirable for better understanding of physiological and pathological processes.10 Recently, many excellent pH-dependent fluorescent probes with near neutral11 or acidic response behavior12 have been exploited for applications in biological systems. Nevertheless, little research is reported on the development of extremely alkaline pH probes.13 Undoubtedly, design of multiple analyte responsive probes for the rapid, efficient, and selective detection of CN−, HSO3−, and extremely alkaline pH is important and attractive because of their wide range of applications.Fluorometry has attracted much more attention over many other methods for CN−, HSO3−, and pH detection due to its simplicity, noninvasiveness, high sensitivity, excellent specificity, and fast response time.14 In particular, fluorescence imaging provides high spatial and temporal observation of CN−, HSO3−, and pH changes in live samples15 with the combination of fluorescent probes and confocal laser scanning microscopy. As a versatile probe technique, a ratiometric sensor for CN− detection has attracted significant attention as an alternative to first-generation intensity probes due to its sensitivity and the built-in correction for avoiding environmental effects. Moreover, to the best of our knowledge, few fluorescent probes have been reported for rapid detection of HSO3− in 100% aqueous media16 and little attention is paid to the fluorescent pH probes functioning in the extremely alkaline pH range (pH > 9). Hence, a pressing need exists to develop a fluorescent probe satisfying the multiple criteria of multiple analyte response, performing in 100% aqueous media and showing live-cell permeability for monitoring CN−, HSO3−, and extremely alkaline pH in biological systems.
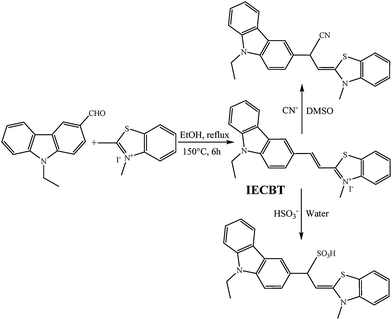
In the present work, we report a single water-soluble broadly emitting (500–650 nm) fluorescent probe (IECBT), which can respond to CN−, HSO3− and extremely alkaline pH, via the ethylene bridging of 3-formyl-N-ethylcarbazole as an electron donor (D) and 2,3-dimethyl benzothizolium iodide as an electron acceptor (A). The D–π–A structure type is frequently adopted as a fluorophore to construct intramolecular charge transfer (ICT) fluorescent probes displaying a large Stokes shift.17 Here, CN− and HSO3− are expected to undergo 1,4-addition reactions with the C-4 atom in the ethylene group, which is activated by the electron-withdrawing feature of the positively-charged benzothizolium fragment. In DMSO media, the ratiometric probe IECBT not only displays high sensitivity and selectivity toward CN− ions, but also exhibits two well-separated emission peaks before and after CN− addition (Δλ = 199 nm), which favors fluorescence resolution. On the other hand, the supernal selectivity and sensitivity of IECBT are achieved toward HSO3− ions and alkaline pH in water. Importantly, IECBT features a remarkably large Stokes shift, good stability and rapid response to CN−, HSO3− and extremely alkaline pH, which are highly desirable for a fluorescent probe to achieve reliable and sensitive fluorescence detection. Fluorescence CN− and HSO3− imaging in living cells by IECBT is also successfully applied. Last but not least, laser scanning confocal microscopy of Escherichia coli cells indicates that IECBT could image alkaline pH value fluctuations in biological systems.
2. Experimental section
2.1 Materials and methods
IECBT was synthesized in our own laboratory. Unless otherwise stated, all reagents were purchased from commercial suppliers and used without further purification. Twice-distilled water was used throughout all experiments. Reactions were carried out using the magnetic stirrers and monitored by thin layer chromatography (TLC). Absorption spectra were measured using a UV-757CRT spectrophotometer (Shanghai Precision & Scientific Instrument Co., Shanghai, China) in a 4.5 mL (1 cm in diameter) cuvette with 2 mL of solution. Fluorescence measurements were conducted on a Hitachi F-7000 fluorescence spectrophotometer. NMR spectra were recorded on a Bruker instrument (AVANCE III HD) with TMS as the internal standard in DMSO-d6, with 600 MHz for 1H NMR and 150 MHz for 13C NMR, respectively. Mass spectra were acquired using an Agilent Accurate-Mass-Q-TOF MS 6520 system equipped with an electrospray ionization (ESI) source (Agilent, USA).2.2 Synthesis of 3-methyl-2-(N-ethylcarbazole-3vinyl)-benzothiazolium iodide (IECBT)
3-Formyl-N-ethylcarbazole (0.141 g, 0.5 mmol) and 2,3-dimethyl benzothizolium iodide (0.167 g, 0.5 mmol) were heated in dry ethanol (5 mL) at 150 °C for 6 h under reflux with vigorous stirring. The reaction was cooled to room temperature and the precipitate was collected by filtration, washed with diethyl ether, and dried in vacuo. IECBT was obtained as an orange solid in 55% yield (0.169 g). As depicted in Scheme 1, IECBT was easily synthesized in a one-step reaction, and the purification was simple. 1H NMR (DMSO-d6, δ/ppm): 8.947 (s, 1H), 8.430 (m, 2H), 8.243 (m, 3H), 8.063 (d, J = 16.2 Hz, 1H), 7.876 (m, 2H), 7.785 (t, J = 7.2 Hz, 1H), 7.741 (t, J = 7.8 Hz, 1H), 7.581 (t, J = 7.2 Hz, 1H), 7.367 (t, J = 7.2 Hz, 1H), 4.547 (d, J = 7.2 Hz, 2H), 4.377 (s, 3H), 1.386 (t, J = 7.2 Hz, 3H). 13C NMR (DMSO-d6, δ/ppm): 172.46, 151.06, 142.70, 142.51, 140.80, 129.65, 128.58, 127.86, 127.34, 125.67, 124.96, 124.58, 124.19, 123.42, 122.70, 121.09, 120.76, 116.98, 110.60, 40.54, 37.91, 36.61, 14.32. HRMS (ESI) calcd for [M]+ 355.1264, found 355.1252 (Fig. S1, ESI†).2.3 General procedure for spectral measurements
IECBT was dissolved in acetonitrile/water (4/6, v/v) medium to obtain 1.0 mM stock solutions. CN− and HSO3− solutions were prepared by dissolving potassium cyanide or sodium bisulfite in deionized water. The aqueous solutions of cations and anions for selectivity experiments and titration experiments were prepared from the corresponding hydrochloride salts or sodium salts in deionized water at an appropriate concentration. In the pH titration experiments, the slight pH variations of the solutions were achieved by adding the minimum volumes of HCl (0.5 M) or NaOH (0.25 M, 0.5 M and 1.0 M). All spectroscopic experiments were carried out at room temperature and the excitation and emission slit widths were 10 nm and 5 nm, respectively.2.4 U251 cell culture and imaging
U251 cells were cultured in DMEM containing 10% FBS (Fetal Bovine Serum) and 1% antibiotic–antimycotic solution at 37 °C in a 5% CO2/95% air incubator. One day before imaging, the cells were plated on 35 mm diameter round glass Petri dishes and allowed to adhere for 24 h. Subsequently, the cells were incubated with IECBT (10 μM) dissolved in acetonitrile/water (4/6, v/v) for 30 min at 37 °C and then washed with pre-warmed PBS (pH = 7.4) three times. Then cells were stimulated with CN− (30 μM) and HSO3− (20 μM) in their culture dish, respectively, and images were collected on a FV1000 confocal laser scanning microscope (Olympus Co., Ltd, Japan) with a 200× objective lens over 2 min.2.5 E. coli cell culture and imaging
In light of the method reported in the literature,18E. coli cells were incubated at 37 °C in Luria-Bertani (LB) culture medium (tryptone 10 g L−1, yeast extract 5 g L−1, and NaCl 10 g L−1) for 17 h in a table concentrator at 180 rpm. Then the culture was centrifuged at 5000 rpm for 5 min to collect E. coli cells. The sediment was washed with sterile water and then resuspended in solutions of different pH values (8.00, 9.89 and 11.98). Five minutes after resuspension, the probe IECBT dissolved in acetonitrile/water (4/6, v/v) was added into every tube to a final probe concentration of 20 μM. E. coli cells with the probe were incubated in a table concentrator for 2 h and then smeared on slides and observed using a ZEISS LSM 880 confocal laser scanning microscope with a 10× objective lens.3. Results and discussion
3.1 Proposed mechanism
The visible color and strong fluorescence of IECBT were due to its outstanding ICT effect from the electron-donor carbazole group to the electron-acceptor benzothiazole moiety. As illustrated in Fig. 1, 1H NMR analysis was firstly carried out to demonstrate the proposed 1,4-addition mechanism. After addition of CN− or HSO3− into the solution of IECBT, respectively, all of the 1H NMR signals shifted upfield because the nucleophilic attack of CN− or HSO3− toward C-4 disturbed the π-conjugation and weakened its electron withdrawing characteristic. Fig. 1b illustrates that the proton signals (H-a, at δ 4.377) of the methyl group connected with N+ were significantly shifted up-field to δ 3.223 after addition of CN−. And the vinyl protons at δ 8.063 (H-b) and δ 8.430 (H-c) were dramatically upfield shifted to δ 4.939 (H-b and H-c) upon cyanide addition at room temperature due to the 1,4-addition reaction. This observation clearly indicated that the cyanide anion was added to the C-4 atom in the ethylene group (Fig. 1). In addition, the formation of the IECBT–CN adduct was also confirmed by mass spectrometry analysis (ESIMS), and the peak at m/z 396.1517 (calc. = 396.1528) corresponding to [IECBT–CN + H]+ was clearly observed (Fig. S2, ESI†). Notably, from Fig. 1c, we could breezily find that the proton signals (H-b, at δ 8.063 and H-c, at δ 8.430) which prominently appeared at δ 4.484–4.375 after HSO3− addition confirmed the 1,4-addition reaction between IECBT and HSO3−, undoubtedly. Furthermore, this adduct was further characterized by MS analysis (Fig. S3, ESI†), where the peak at m/z 451.1129 (calc. = 451.1144) corresponding to [IECBT–HSO3 + H]+ was observed.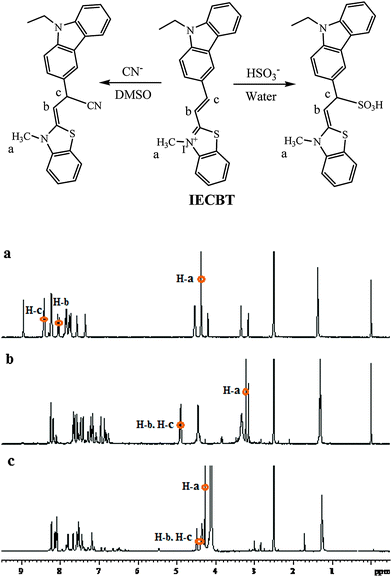 | ||
| Fig. 1 1H NMR spectra of IECBT in DMSO-d6 before (a) and after the addition of (b) KCN or (c) NaHSO3 (portion 1H NMR spectra). | ||
3.2 Investigation of spectral properties of IECBT
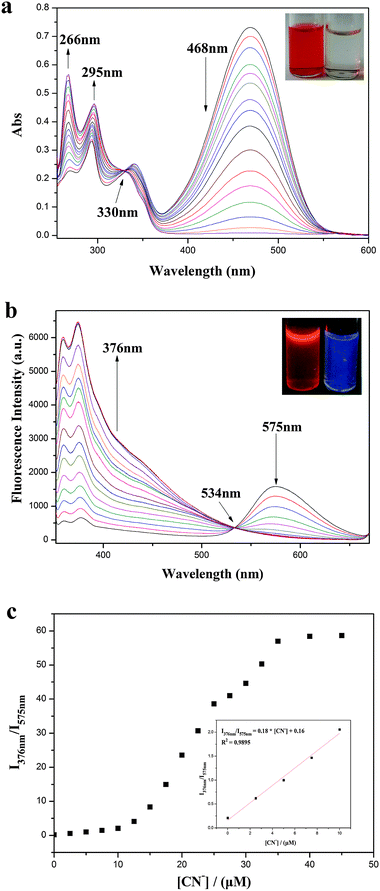
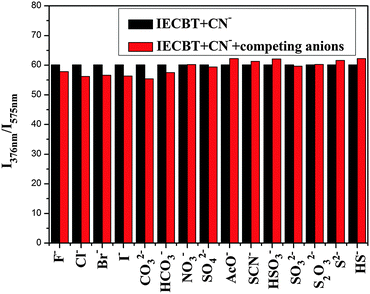
We first decided to examine the absorption spectra of IECBT (15 μM) after addition of various amounts of CN− (0–20 μM). Before that, the effect of different solvent conditions on the fluorescence properties of the system was investigated (see ESI†) (Fig. S4, ESI†). IECBT exhibited an obvious absorption peak at 468 nm (Fig. 2a). Upon addition of CN−, the absorption peak at 468 nm was gradually attenuated and a new broad band from around 260 to 300 nm was increased, suggesting that the π-conjugation was broken. As a consequence, an obvious color change in the solution from orange to colorless occurred, which could be observed easily by the naked eye (inset of Fig. 2a). Meanwhile, a clear isosbestic point was also noted at 330 nm, indicating the formation of the IECBT–CN adduct. The fluorescence response of IECBT (10 μM) toward CN− (0–45 μM) in DMSO was investigated as demonstrated in Fig. 2b. In the absence of CN−, only one peak was clearly observed at 575 nm (λex = 340 nm) with a large Stokes shift of 235 nm, which was highly desirable for a fluorescent probe because the large gap between the excitation wavelength and the emission wavelength can effectively diminish the measurement error caused by the excitation light and scattered light. However, the addition of CN− resulted in a significant decrease in emission at 575 nm and an excellent increase of the emission band centered at 376 nm, which also implied that the nucleophilic attack of CN− interrupted the π-conjugation of IECBT. Accordingly, a well-defined isoemission point at 534 nm was noticed and the fluorescence color changed from orange to deep blue (inset of Fig. 2b). Then a titration profile of the ratio of the emission intensities at 376 and 575 nm (I376/I575) to the CN− concentrations from 0 to 45 μM could be observed (Fig. 2c). The ratio value increased dramatically by >270-fold (from 0.21 to 57) with the addition of CN−. Moreover, as plotted in the inset of Fig. 2c, the signal ratio I376/I575 showed a good linearity with CN− concentration in the range of 0–10 μM [Y = 0.18X + 0.16 (R2 = 0.9895)]. The detection limit was calculated to be 0.94 μM (S/N = 3), which was below the WHO detection level. It was also worth mentioning that the shift of the two emission wavelengths was very large (ΔF = 199 nm), which contributed to the accurate measurement of the intensities of the two emission peaks, as well as resulted in a huge ratiometric value. These findings showed that IECBT was indeed a sensitive and quantitative detector of CN− ions in DMSO media. Time-dependent modulations in the fluorescence of the probe (10 μM) in the presence of CN− (17 μM) suggested that the reaction could be completed within 10 min under the experimental conditions (Fig. S5, ESI†). Thus, the detection was delayed for 10 min to ensure that the reaction between IECBT and CN− was accomplished completely.To gain insight into the degree of selectivity toward CN− ions exhibited by IECBT, we investigated the fluorescence behavior of IECBT (10 μM) in the presence of various typical potential interfering anions, such as F−, Cl−, Br−, I−, CO32−, HCO3−, NO3−, SO42−, AcO−, SCN−, HSO3−, SO32−, S2O32−, S2− and HS− (1 equiv., respectively). Remarkably, as shown in Fig. S6 (ESI†), an unperturbed effect on the intensity ratio (I376/I575) of IECBT was observed for anions, compared with that obtained for CN−. Moreover, competitive assays indicated that the coexistence of all these typical analytes (100 equiv.) had little impact on the ability of IECBT to detect CN−-ions (Fig. 3). These experiments showed that IECBT had high selectivity and strong anti-jamming capacity for CN− determination against all kinds of anions.
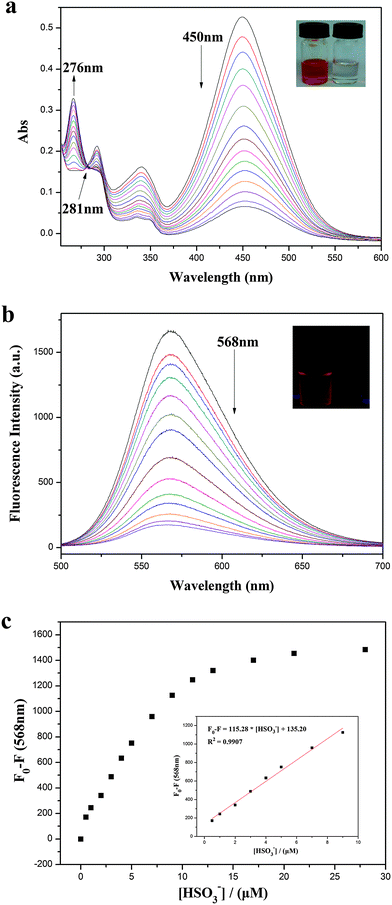
The sensing ability of IECBT for HSO3− was then studied. The reaction media, pH value, and response time were investigated to optimize the sensing conditions. The fluorescence spectral response of IECBT (10 μM) in the absence and presence of HSO3− (20 μM) at different pH values was evaluated as shown in Fig. S7 (ESI†). IECBT was stable in aqueous solution and displayed the best response for HSO3−. Thus, the distilled water was selected for the spectral studies. The reaction time between IECBT and HSO3− was estimated within 2 min to ensure complete reaction between IECBT (10 μM) and HSO3− (10 μM) (Fig. S8, ESI†). The absorption spectrum of IECBT (10 μM) showed a strong band at 450 nm (Fig. 4a). With increasing concentration of HSO3− (0–28 μM), the absorption peak at 450 nm was gradually reduced and a new absorption peak appeared at 276 nm with an isosbestic point at 281 nm. This phenomenon led to a distinguishable solution color change from croci to colorless (inset of Fig. 4a). The fluorescence spectra of IECBT (10 μM) after addition of various amounts of HSO3− (0–28 μM) are shown in Fig. 4b. As anticipated, IECBT exhibited a remarkable emission at 568 nm (λex = 465 nm) with a large Stokes shift of 103 nm. The addition of HSO3− caused a gradual decrease in emission at 568 nm with a fluorescence color change from orange to nonfluorescence (inset of Fig. 4b). A titration profile of the responses of the relative emission intensity (F0 − F) at 568 nm to the HSO3− concentrations from 0 to 28 μM could be observed (Fig. 4c). As plotted in the inset of Fig. 4c, the signal (F0 − F) at 568 nm showed a good linearity with HSO3− concentration in the range of 0.5–9 μM [Y = 115.28X + 135.20 (R2 = 0.9907)]. The detection limit was calculated to be 0.53 μM (S/N = 3). These results suggested that IECBT might be an excellent candidate for practical HSO3− analysis in aqueous media.
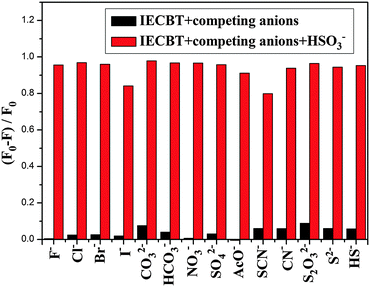
The selectivity experiments were carried out by monitoring the relative emission intensity ratio (F0 − F)/F0 of the probe in the presence of various typical interfering anions including F−, Cl−, Br−, I−, CO32−, HCO3−, NO3−, SO42−, AcO−, SCN−, CN−, S2O32−, S2− and HS− (1 equiv., respectively) as shown in Fig. S9 (ESI†). No significant responses were obtained for these anions and the (F0 − F)/F0 values varied in a limited range between −0.005 and 0.2. By contrast, treatment of IECBT with HSO3− resulted in an obvious (F0 − F)/F0 response. In addition, competition experiments of IECBT were also ascertained by various anions mentioned previously in the same environment. The signaling of IECBT toward HSO3− was not affected by the presence of 20 equiv. of coexisting species (Fig. 5). These phenomenon ulteriorly proved that IECBT could be used as an efficient signaling probe for HSO3− in aqueous media.
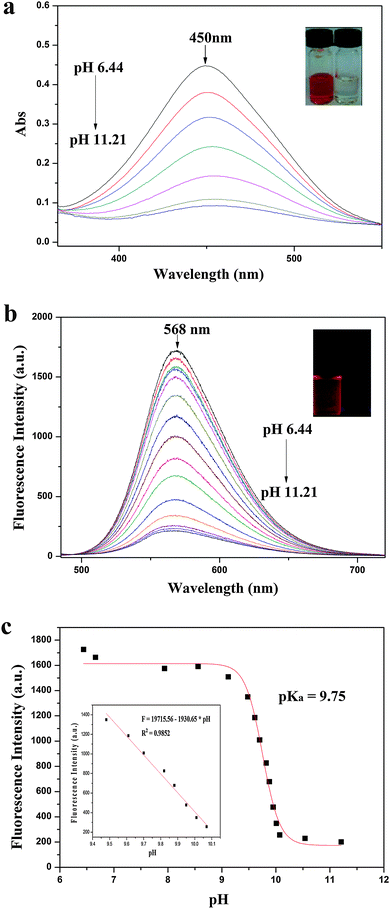
To study the optical responses of IECBT to pH, the UV-Vis absorption and fluorescence emission spectra of IECBT (10 μM) were further investigated in pure water at various pH values (pH 6.44–11.21). IECBT displayed highly sensitive responses to the pH changes. As depicted in Fig. 6a, when the pH increased from 6.44 to 11.21, the maximum absorption band at 450 nm of IECBT in aqueous media was significantly quenched. A further observation was a notable color change from orange-to-colorless with increasing pH (inset of Fig. 6a), which indicated that IECBT could serve as a visual probe for the determination of pH fluctuations. The fluorescence properties of IECBT as a function of pH are depicted in Fig. 6b. When the pH value was lower than 6.44, the IECBT solution exhibited an intense emission band centered at 568 nm (λex = 465 nm) with a large Stokes shift of 103 nm. The large Stokes shift could help to reduce the excitation interference. However, very weak red fluorescence emission was observed as the pH was increased to 11.21. Concomitantly, a notable color change from orange to nonfluorescence under ultraviolet light (inset of Fig. 6b) was observed. Fig. 6c shows the results of sigmoidal fitting of the pH-dependent emission at 568 nm, affording a pKa value of 9.75. The fluorescence intensity at 568 nm also displayed good linearity with pH in the range 9.48–10.07, according to the linear regression equation F = 19715.56 − 1930.65 × pH, with a linear coefficient of 0.9852 (inset of Fig. 6c). The stability of IECBT was tested by measuring the fluorescence response over 2 h. Fig. S10 (ESI†) depicts the time course of fluorescence intensity of the probe (10 μM) at pH 6.44, 6.66, and 9.70, respectively, which proved that IECBT could respond to the pH fluctuations within 10 min and the media were stable to light and air.
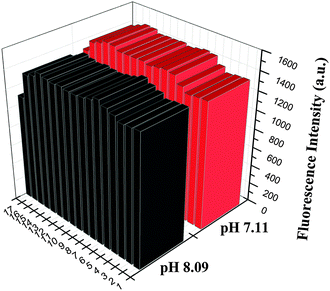
For a good pH fluorescent probe, excellent anti-interference capacity is a key factor. To confirm that IECBT could measure the pH value efficiently, the selectivity of IECBT (10 μM) to alkaline pH over metal ions was investigated at pH 7.11 and 8.09 by competition experiments, respectively. As shown in Fig. 7, physiologically ubiquitous metal ions (K+, Na+, Ca2+ and Mg2+) over their physiological concentrations did not show any obvious emission change in pH measurement. Also in the case of heavy and transition metal ions, such as Ni2+, Cr3+, Co2+, Mn2+, Zn2+, Cd2+, Al3+, Cu2+, Hg2+, Fe3+, Fe2+ and Ag+ (0.2 mM) together with IECBT, almost no adverse effect on the intensity was observed. These results revealed that IECBT showed an excellent selectivity response to alkaline pH in the presence of background metal ions.
3.3 Cell cytotoxicity assay
Since IECBT features large Stokes shifts, high selectivity, excellent sensitivity and good stability for CN−, HSO3− or extremely alkaline pH sensing, it is possible to explore its use in intracellular imaging. Before that, it is crucial to evaluate the cytotoxicity of IECBT as well as the cell viability after the addition of CN− in living cells by MTT assay (see ESI†). As shown in Fig. S11 (ESI†), the percentage of viable HeLa cells after treatment with IECBT (0, 0.1 1, 10 μM) for 24 hours was over 90%, which demonstrated that IECBT displayed low cytotoxicity to living cells. Fig. S12 (ESI†) depicts the viability of HeLa cells incubated with IECBT (10 μM) at various CN− concentrations from 0 to 30 μM. These results demonstrated that more than 80% of the cells are viable for 90 minutes, showing the low toxicity of IECBT (10 μM) after the addition of CN− (0 to 30 μM) to cultured cells under experimental conditions and inferring its potential use in the intracellular imaging of living cells.3.4 Imaging of living cells
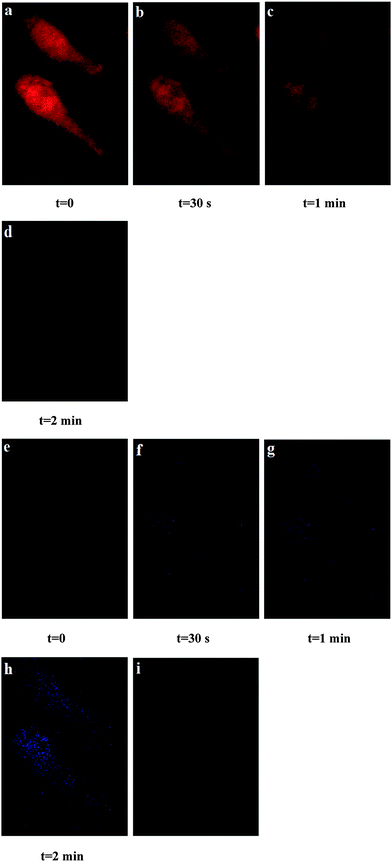
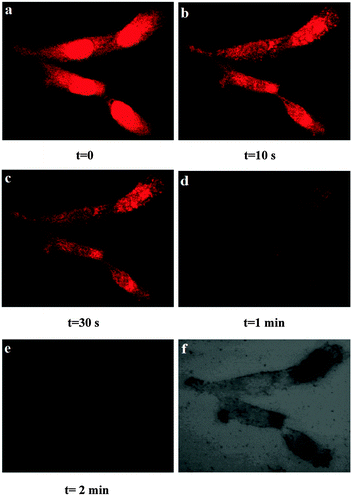
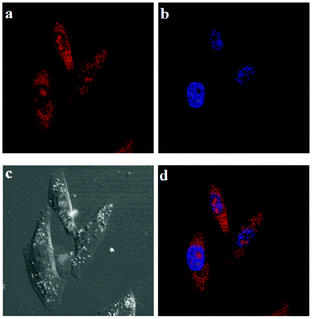
Encouraged by the aforementioned results, we further investigated the applicability of IECBT for intracellular CN− or HSO3− detection and imaging with U251 cells, respectively. Dynamic fluorescence imaging was performed to observe the reaction process between IECBT and these anions mentioned previously in real time. We used the confocal laser scanning microscope to directly visualize the fluorescence change of U251 cells incubated with IECBT at a certain concentration of CN− (30 μM) in its culture dish over time (0, 30 s, 1 min, and 2 min) (Fig. 8). The red fluorescence (500–600 nm) and blue fluorescence (425–475 nm) were captured by 488 and 405 nm lasers, respectively, and the fluorescence intensity was calculated by use of commercial software. It was obvious that the U251 cells displayed bright red fluorescence (Fig. 8a) and very faint blue fluorescence emission (Fig. 8e), initially. With extended times, the red fluorescence intensity decreased sharply (Fig. 8a–d); by contrast, the blue fluorescence intensity increased pronouncedly (Fig. 8e–h). We also explored the fluorescence change of IECBT after adding HSO3− (20 μM) in the living U251 cells over time (0, 10 s, 30 s, 1 min, and 2 min) (Fig. 9). Using excitation wavelengths at 488 nm, the images of the red channel were obtained in the 500–600 nm detection range. Fig. 9a shows that a marked red fluorescence was observed. However, extended times caused a gradual quenching (Fig. 9a–e). These cell experiments showed excellent cell membrane permeability of IECBT, and it could be used to detect CN− or HSO3− in living cells, respectively.Meanwhile, to further confirm the subcellular distributions of IECBT, a blue nucleus specific staining probe 4,6-diamidino-2-phenylindole (DAPI) was used to co-stain HeLa cells with IECBT. As shown in Fig. 10, the blue emissions were from the nuclei specific staining probe DAPI (Fig. 10b), and the red emissions which were well-dispersed in the entire cell region were generated from our probe IECBT (Fig. 10a). According to the clear cell morphology (Fig. 10c) and dual-color fluorescence imaging (Fig. 10d), we could also see very clearly that the red emissions from IECBT were well-dispersed in the entire cell region.
3.5 pH bioimaging in E. coli
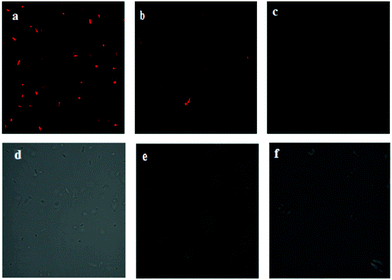
The imaging of E. coli incubated with IECBT under various pH conditions was further studied to investigate its ability to monitor pH changes in living samples. To simulate the extremely alkaline environment in E. coli, buffer solutions with pH at 8.00, 9.89 and 11.98, respectively, were used to incubate bacteria. The optical window at the red channel (500–600 nm) was chosen as a signal output. Under selective excitation at 488 nm, the E. coli cells displayed bright red fluorescence (Fig. 11a) at pH 8.00. The red fluorescence intensity dropped sharply with the pH increasing to 9.89 (Fig. 11b), and almost no fluorescence was observed when the pH increased to 11.98 (Fig. 11c). These results confirmed that IECBT was able to image pH fluctuations under extreme alkalinity in E. coli cells.4. Conclusion
In summary, we have described the facile synthesis, optical properties, and living cell or bacterial imaging applications of IECBT which is synthesized by ethylene bridging of 3-formyl-N-ethylcarbazole and 2,3-dimethyl benzothizolium iodide, a unique type of a single fluorescent probe that can detect CN−, HSO3− or extremely alkaline pH. IECBT is found to be an excellent ratiometric probe for the selective sensing of CN− in DMSO via 1,4-addition reaction. At the same time, this probe shows high selectivity and sensitivity toward HSO3− in aqueous solution based on the 1,4-addition mechanism. Also, pH titration indicates that IECBT exhibited a remarkable pH-dependent behavior with a pKa value of 9.75. Moreover, other advantageous properties of IECBT include low detection limits, fine stability, good water-solubility and large Stokes shifts towards CN−, HSO3− and pH, all of which are favorable for intracellular CN−, HSO3− or pH imaging. The application of IECBT to CN− and HSO3− imaging in live U251 cells is also achieved successfully, indicating that the probe has good cell membrane permeability and can be used to rapidly detect CN− or HSO3− in living cells, respectively. Since IECBT holds perfect properties, it is used to noninvasively measure extremely alkaline pH in E. coli cells. To our knowledge, IECBT represents the first fluorescent probe for monitoring multiple analytes such as CN−, HSO3− or extremely alkaline pH in living samples. Therefore, this work provides a promising probe for the effective detection and quantification of the extremely toxic CN− found in biological and environmental samples and HSO3− for food safety and quality control, clinical and environmental applications. What is more, it is also anticipated that IECBT is a hopeful candidate for real-time tracking of pH changes, especially under extremely alkaline conditions in the biomedical and biological fields.Acknowledgements
The work was supported by the National Natural Science Foundation of China (No. 21472118), the Shanxi Province Science Foundation for Youths (No. 2012021009-4 and 2013011011-1), the Shanxi Province Foundation for Returnee (No. 2012-007), the Taiyuan Technology Star Special (No. 12024703), the Program for the Top Young and Middle-aged Innovative Talents of Higher Learning Institutions of Shanxi (TYMIT, No. 2013802), the Talents Support Program of Shanxi Province (No. 2014401) and the Shanxi Province Outstanding Youth Fund (No. 2014021002), the Scientific and Technological Innovation Programs of Higher Education Institutions in Shanxi (20111001), and the Shanxi Province Foundation for College Students of Science and Technology Innovation projects (No. 2013328).Notes and references
- (a) G. Aragay, J. Pons and A. Merkoci, Chem. Rev., 2011, 111, 3433–3458 CrossRef CAS PubMed; (b) K. P. Carter, A. M. Young and A. E. Palmer, Chem. Rev., 2014, 114, 4564–4601 CrossRef CAS PubMed; (c) D.-G. Cho and J. L. Sessler, Chem. Soc. Rev., 2009, 38, 1647–1662 RSC; (d) M. Formica, V. Fusi, L. Giorgi and M. Micheloni, Coord. Chem. Rev., 2012, 256, 170–192 CrossRef CAS; (e) L. E. Santos-Figueroa, M. E. Moragues, E. Climent, A. Agostini, R. Martinez-Manez and F. Sancenon, Chem. Soc. Rev., 2013, 42, 3489–3613 RSC; (f) D. Sareen, P. Kaur and K. Singh, Coord. Chem. Rev., 2014, 265, 125–154 CrossRef CAS; (g) L. Yuan, W. Y. Lin, Y. N. Xie, B. Chen and S. Zhu, J. Am. Chem. Soc., 2012, 134, 1305–1315 CrossRef CAS PubMed; (h) Y. Y. Han, C. Q. Ding, J. Zhou and Y. Tian, Anal. Chem., 2015, 87, 5333–5339 CrossRef CAS PubMed; (i) A. Balamurugan and H. Lee, Macromolecules, 2015, 48, 3934–3940 CrossRef CAS.
- (a) H. J. Kim, S. Bhuniya, R. K. Mahajan, R. Puri, H. Liu, K. C. Ko, J. Y. Lee and J. S. Kim, Chem. Commun., 2009, 7128–7130 RSC; (b) J. P. Hill, N. K. Subbaiyan, F. D'Souza, Y. S. Xie, S. Sahu, N. M. Sanchez-Ballester, G. J. Richards, T. Morif and K. Ariga, Chem. Commun., 2012, 48, 3951–3953 RSC; (c) G. Sivaraman and D. Chellappa, J. Mater. Chem. B, 2013, 1, 5768–5772 RSC; (d) Q. L. Xu, C. H. Heo, G. Kim, H. W. Lee, H. M. Kim and J. Yoon, Angew. Chem., Int. Ed., 2015, 54, 1–6 CrossRef CAS PubMed; (e) H. X. Zhang, J. Liu, Y. Q. Sun, Y. Y. Huo, Y. H. Li, W. Z. Liu, X. Wu, N. S. Zhu, Y. W. Shi and W. Guo, Chem. Commun., 2015, 51, 2721–2724 RSC; (f) S. Chen, P. Huo and X. Z. Song, Sens. Actuators, B, 2015, 221, 951–955 CrossRef CAS.
- (a) M. Breugst and H. Mayr, J. Am. Chem. Soc., 2010, 132, 15380–15389 CrossRef CAS PubMed; (b) M. G. Fete, Z. Havlas and J. Michl, J. Am. Chem. Soc., 2011, 133, 4123–4131 CrossRef CAS PubMed; (c) J. J. Hettige, H. K. Kashyap, H. V. R. Annapureddy and C. J. Margulis, J. Phys. Chem. Lett., 2013, 4, 105–110 CrossRef CAS PubMed; (d) T. D. Ashton, K. A. Jolliffe and F. M. Pfeffer, Chem. Soc. Rev., 2015, 44, 4547–4595 RSC.
- (a) Cyanide in Biology, ed. B. Vennesland, E. F. Comm, J. Knownles, J. Westly and F. Wissing, Academic, London, 1981 Search PubMed; (b) K. W. Kulig, Cyanide Toxicity, U. S. Department of Health and Human Services, Atlanta, GA, 1991 Search PubMed; (c) Guidelines for Drinking-Water Quality, World Health Organization, Geneva, 1996.
- (a) H. Sun, Y. Y. Zhang, S. H. Si, D. R. Zhu and Y. S. Fung, Sens. Actuators, B, 2005, 108, 925–932 CrossRef CAS; (b) S. K. Kwon, S. Kou, H. N. Kim, X. Q. Chen, H. Hwang, S. W. Nam, S. H. Kim, K. M. K. Swamy, S. Park and J. Yoon, Tetrahedron Lett., 2008, 49, 4102–4105 CrossRef CAS; (c) S. Vallejos, P. Estévez, F. C. García, F. Serna, J. L. de la Peña and J. M. García, Chem. Commun., 2010, 46, 7951–7953 RSC.
- (a) A. Isaac, A. J. Wain, R. G. Compton, C. Livingstone and J. Davis, Analyst, 2005, 130, 1343–1344 RSC; (b) J. Xu, K. Liu, D. Di, S. Shao and Y. Guo, Inorg. Chem. Commun., 2007, 10, 681–684 CrossRef CAS; (c) L. C. de Azevedo, M. M. Reis, L. F. Motta, G. O. da Rocha, L. A. Silva and J. B. De Andeade, J. Agric. Food Chem., 2007, 55, 8670–8680 CrossRef CAS PubMed.
- (a) S. L. Taylor, N. A. Higle and R. K. Bush, Adv. Food Res., 1986, 30, 1–76 CAS; (b) R. C. Claudia and J. C. Francisco, Food Chem., 2009, 112, 487–491 CrossRef; (c) P. D. Tzanavaras, E. Thiakouli and D. G. Themelis, Talanta, 2009, 77, 1614–1619 CrossRef CAS PubMed; (d) M. Koch, R. Köppen, D. Siegel, A. Witt and I. Nehls, J. Agric. Food Chem., 2010, 58, 9463–9467 CrossRef CAS PubMed; (e) National Standards of the People's Republic of China, GB 2760-2007, 16.
- (a) N. Kumari, S. Jha and S. Bhattacharya, J. Org. Chem., 2011, 76, 8215–8222 CrossRef CAS PubMed; (b) P. B. Pati, Sens. Actuators, B, 2016, 222, 374–390 CrossRef CAS; (c) W. Xu, C. L. Teoh, J. J. Peng, D. D. Su, L. Yuan and Y. T. Chang, Biomaterials, 2015, 56, 1–9 CrossRef CAS PubMed; (d) P. Jayasudha, R. Manivannan and K. P. Elango, Sens. Actuators, B, 2015, 221, 1441–1448 CrossRef CAS; (e) Y. Q. Sun, P. Wang, J. Liu, J. Y. Zhang and W. Guo, Analyst, 2012, 137, 3430–3433 RSC.
- (a) R. Martinez-Zaguilln and R. J. Gillies, Cell. Physiol. Biochem., 1996, 6, 169–184 CrossRef; (b) M. Lakadamyali, M. J. Rust, H. P. Babcock and X. Zhuang, Proc. Natl. Acad. Sci. U. S. A., 2003, 100, 9280–9285 CrossRef CAS PubMed; (c) X. Liu, Y. Xu, R. Sun, Y. Xu, J. Lu and J. Ge, Analyst, 2013, 138, 6542–6550 RSC; (d) K. R. Hoyt and I. J. Reynolds, J. Neurochem., 1998, 7, 1051–1058 Search PubMed; (e) R. G. W. Anderson and L. Orci, J. Cell Biol., 1988, 106, 539–543 CrossRef CAS PubMed.
- (a) E. S. Trombetta, M. Ebersold, W. Garrett, M. Pypaert and I. Mellman, Science, 2003, 299, 1400–1403 CrossRef CAS PubMed; (b) Y. Urano, D. Asanuma, Y. Hama, Y. Koyama, T. Barrett, M. Kamiya, T. Nagano, T. Watanabe, A. Hasegawa, P. L. Choyke and H. Kobayashi, Nat. Med., 2009, 15, 104–109 CrossRef CAS PubMed; (c) T. A. Krulwich, G. Sachs and E. Padan, Nat. Rev. Microbiol., 2011, 9, 330–343 CrossRef CAS PubMed.
- (a) L. Fan, Q. L. Liu, D. T. Lu, H. P. Shi, Y. F. Yang, Y. F. Li, C. Dong and S. M. Shuang, J. Mater. Chem. B, 2013, 1, 4281–4288 RSC; (b) G. K. Vegesna, J. Janjanam, J. Bi, F. T. Luo, J. T. Zhang, C. Olds, A. Tiwari and H. Y. Liu, J. Mater. Chem. B, 2014, 2, 4500–4508 RSC; (c) Y. H. Li, Y. J. Wang, S. Yang, Y. R. Zhao, L. Yuan, J. Zheng and R. H. Yang, Anal. Chem., 2015, 87, 2495–2503 CrossRef CAS PubMed.
- (a) W. F. Niu, L. Fan, M. Nan, Z. B. Li, D. T. Lu, M. S. Wong, S. M. Shuang and C. Dong, Anal. Chem., 2015, 87, 2788–2793 CrossRef CAS PubMed; (b) J. B. Chao, Y. H. Liu, J. Y. Sun, Y. B. Zhang, H. B. Tong and Z. Q. Li, Sens. Actuators, B, 2015, 221, 427–433 CrossRef CAS; (c) L. Fan, S. Q. Gao, Z. B. Li, W. F. Niu, W. J. Zhang, S. M. Shuang and C. Dong, Sens. Actuators, B, 2015, 221, 1069–1076 CrossRef CAS.
- M. H. Su, Y. Liu, H. M. Ma, Q. L. Ma, Z. H. Wang, J. L. Yang and M. X. Wang, Chem. Commun., 2001, 960–961 RSC.
- (a) J. Chan, S. Dodani and C. Chang, Nat. Chem., 2012, 4, 973–984 CrossRef CAS PubMed; (b) M. Schäferling, Angew. Chem., Int. Ed., 2012, 51, 3532–3554 CrossRef PubMed; (c) A. P. de Silva, H. Q. Nimal Gunaratne, T. Gunnlaugsson, A. J. M. Huxley, C. P. McCoy, J. T. Rademacher and T. E. Rice, Chem. Rev., 1997, 97, 1515–1566 CrossRef CAS PubMed.
- J. Han and K. Burgess, Chem. Rev., 2010, 110, 2709–2728 CrossRef CAS PubMed.
- (a) Y. Sun, D. Zhao, S. W. Fan, L. Duan and R. F. Li, J. Agric. Food Chem., 2014, 62, 3405–3409 CrossRef CAS PubMed; (b) W. Q. Chen, Q. Fang, D. L. Yang, H. Y. Zhang, X. Z. Song and J. Foley, Anal. Chem., 2015, 87, 609–616 CrossRef CAS PubMed.
- (a) L. L. Hao, J. F. Li, P. H. Lin, R. F. Dong, D. X. Li, S. M. Shuang and C. Dong, Chin. Chem. Lett., 2010, 21, 9–12 CrossRef CAS; (b) S. L. Zhang, B. Zhao, L. Ran, D. B. Qin and J. W. Luo, Huaxue Shiji, 2014, 36, 925–927 CAS; (c) J. Oriou, F. Ng, G. Hadziioannou, C. Brochon and E. Cloutet, J. Polym. Sci., Part A: Polym. Chem., 2015, 53, 2059–2068 CrossRef CAS.
- (a) M. Y. Yang, Y. Q. Song, M. Zhang, S. X. Lin, Z. Y. Hao, Y. Liang, D. M. Zhang and P. R. Chen, Angew. Chem., Int. Ed., 2012, 51, 7674–7679 CrossRef CAS PubMed; (b) Y. Xu, Z. Jiang, Y. Xiao, F. Z. Bi, J. Y. Miao and B. X. Zhao, Anal. Chim. Acta, 2014, 820, 146–151 CrossRef CAS PubMed.
Footnote |
| † Electronic supplementary information (ESI) available. See DOI: 10.1039/c6tb00119j |
| This journal is © The Royal Society of Chemistry 2016 |

