
 Open Access Article
 This Open Access Article is licensed under a
 Creative Commons Attribution 3.0 Unported Licence
Vanadium-free colusites Cu26A2Sn6S32 (A = Nb, Ta) for environmentally friendly thermoelectrics†
Yuta
Kikuchi
a,
Yohan
Bouyrie
a,
Michihiro
Ohta
 *a,
Koichiro
Suekuni
b,
Makoto
Aihara
a and
Toshiro
Takabatake
cd
*a,
Koichiro
Suekuni
b,
Makoto
Aihara
a and
Toshiro
Takabatake
cd
aResearch Institute for Energy Conservation, National Institute of Advanced Industrial Science and Technology (AIST), Tsukuba, Ibaraki 305-8568, Japan. E-mail: ohta.michihiro@aist.go.jp
bDepartment of Applied Science for Electronics and Materials, Interdisciplinary Graduate School of Engineering Sciences, Kyushu University, Kasuga, Fukuoka 816-8580, Japan
cDepartment of Quantum Matter, Graduate School of Advanced Sciences of Matter, Hiroshima University, Higashi-Hiroshima, Hiroshima 739-8530, Japan
dInstitute for Advanced Materials Research, Hiroshima University, Higashi-Hiroshima, Hiroshima 739-8530, Japan
First published on 1st September 2016
Abstract
The thermoelectric properties of colusites Cu26A2Sn6S32 with A = V, Nb, and Ta have been investigated on high-density sintered compacts over the temperature range of 300–670 K. The ingots melted in evacuated and sealed quartz tubes were found to be composed of two colusite phases with slightly different lattice parameters. The successive hot-pressing converted the two-phase samples to single-phase ones of high density. Scanning electron microscopic analysis revealed the presence of CuS- and Cu2S-based secondary phases in only the sintered compact with A = Ta. For A = V, Nb, and Ta samples, the heavy hole effective mass of 3m0–4m0 (m0: free electron mass) caused a high Seebeck coefficient, leading to a high thermoelectric power factor of 0.6–0.7 mW K−2 m−1 at 660 K. The electrical resistivity and lattice thermal conductivity for the A = Ta sample are lower than those for A = V and A = Nb samples, because the secondary phases in the A = Ta sample provide charge carriers and scatter effectively the phonons. As a result, a ZT of 0.8 at 670 K is achieved for the A = Ta system.
1. Introduction
In aiming at mitigating climate change, thermal management should be improved in various fields such as vehicles, industrial processes, and fossil fuel combustion, because more than 50% of the primary energy consumed is wasted in the form of heat.1 Solid-state devices based on thermoelectrics can directly generate electrical energy from the waste heat, and thus provide a new strategy for reducing and managing energy consumption.2–5For a thermoelectric device, the efficiency in converting thermal energy to electrical energy depends on the thermoelectric figure of merit ZT of the material, described as:
 | (1) |
Industrial application of thermoelectric devices requires high-ZT materials composed of less-toxic and cost effective elements. This requirement is, however, not satisfied for conventional thermoelectric materials such as Bi2Te3 and PbTe, because they are composed of toxic (Pb) and expensive (Te) elements. On the other hand, copper (Cu) and sulfur (S) are earth abundant and less-toxic elements; therefore, copper-containing sulfides have been intensively studied in the past several years.19
Binary copper sulfides Cu1.97S have been reported to have ZT over ∼1.9 at 973 K.20,21 In these systems, liquid-like Cu ions travel freely within the sulfur sublattice, reducing the κlat to 0.6 W K−1 m−1. However, this Cu migration drives the physical degradation of materials.22 Tetrahedrites Cu12−xTrxSb4S13 (Tr = Mn, Fe, Co, Ni, and Zn) have been demonstrated to possess promising thermoelectric properties over the intermediate temperature range of 600–700 K. The high p-type ZT (∼1.0 at 700 K for Cu10.5Ni1.0Zn0.5Sb4S13) arises from the combination of a degenerate semiconducting-like band structure and an extremely low κlat (∼0.4 W K−1 m−1 at 700 K for Cu10.5Ni1.0Zn0.5Sb4S13).23–31 However, tetrahedrites contain a somewhat toxic element (Sb) which prevents them from industrial applications.
Cu26V2E6S32 (E = Ge, Sn) are a family of colusites without Sb, therefore highly promising for practical thermoelectric devices operating in the intermediate temperature range of 600–700 K.31–35 The crystal structure of colusites is shown in Fig. 1. The unit cell is composed of 66 atoms and belongs to a cubic system with a P![[4 with combining macron]](https://www.rsc.org/images/entities/char_0034_0304.gif) 3n space group.35–37 In the crystal structure, there are large void spaces at interstitial sites, such as 6b (0, 0, 1/2). It has been reported that the density of states (DOS) calculations show unoccupied states in the valence band above the fermi level, allowing p-type conduction.32,33 This electron-deficient character is consistent with the electron count for formal valences such as Cu+(3d10), V5+(3d0), E4+, and S2−.32,33 We have demonstrated relatively high p-type ZT values (0.6–0.7 at 663 K) owing to the low κlat (∼0.5 W K−1 m−1 at 300–670 K). The low κlat is attributed to the large number of atoms in the simple cubic crystal structure. Moreover, the electronic band structure calculation revealed that the high power factor of ∼0.6 mW K−2 m−1 at 663 K originates from the Cu-3d and S-3p hybridized orbitals close to the Fermi level.32,33
3n space group.35–37 In the crystal structure, there are large void spaces at interstitial sites, such as 6b (0, 0, 1/2). It has been reported that the density of states (DOS) calculations show unoccupied states in the valence band above the fermi level, allowing p-type conduction.32,33 This electron-deficient character is consistent with the electron count for formal valences such as Cu+(3d10), V5+(3d0), E4+, and S2−.32,33 We have demonstrated relatively high p-type ZT values (0.6–0.7 at 663 K) owing to the low κlat (∼0.5 W K−1 m−1 at 300–670 K). The low κlat is attributed to the large number of atoms in the simple cubic crystal structure. Moreover, the electronic band structure calculation revealed that the high power factor of ∼0.6 mW K−2 m−1 at 663 K originates from the Cu-3d and S-3p hybridized orbitals close to the Fermi level.32,33
 | ||
| Fig. 1 Crystal structure of colusites Cu26A2Sn6S32 (A = V, Nb, Ta).36,37 The crystal structure is simple cubic (space group: P3n) containing 66 atoms in a unit cell. The empty 6b site is located between two [CuS4] tetrahedra. | ||
Although colusites could pave the way for environmentally friendly and cost-effective thermoelectric generation, there are concerns regarding the oxidation of V in the production processes and practical use because V-oxides are toxic.38,39 Therefore, an attempt was made to substitute less toxic elements Nb and Ta for V in colusites. Isoelectronic elements V, Nb and Ta are expected to lead to a similar electronic band structure in the colusite system; therefore, the value of S2/ρ for Cu26Nb2Sn6S32 and Cu26Ta2Sn6S32 could be high, like that for Cu26V2Sn6S32. Furthermore, the large number of atoms in the unit cell of Cu26Nb2Sn6S32 and Cu26Ta2Sn6S32 would yield a low κlat. Bearing this in mind, we have synthesized Cu26A2Sn6S32 (A = V, Nb, Ta) and compared their thermoelectric properties.
2. Experimental section
2.1 Synthesis and sintering
Elemental copper (Cu; 99.99%), vanadium (V; 99.9%), niobium (Nb; 99.9%), tantalum (Ta; 99.9%), tin (Sn; 99.9999%), and sulfur (S; 99.9999%) supplied from Kojundo Chemical Laboratory were used as starting materials without further purification. These elements were mixed in the stoichiometric ratio of Cu26A2Sn6S32 (A = V, Nb, Ta). For example, 1.321 g of Cu, 0.289 g of Ta, 0.569 of Sn, and 0.820 g of S were used to prepare 3 g of Cu26Ta2Sn6S32. A mixture of approximately 3 g was loaded into fused quartz tubes of 12 mm outer diameter × 8 mm inner diameter. The tubes were evacuated to a pressure of ∼5 × 10⁻³ Pa and then flame-sealed. The mixtures were heated to 1323 K for 60 h, held at 1323 K for 12 h, cooled to 673 K in 19 h, and then to room temperature over 5 h.The obtained ingots of Cu26A2Sn6S32 were hand-ground into powders, which were placed into graphite dies with 10 or 15 mm-inner diameter for hot pressing. The graphite die was inserted into a hot-press furnace (FUT-17000, TOKYO VACUUM). Sintering was performed at 1023 K for 1 h under 70 MPa uniaxial pressure in an Ar gas flow atmosphere. The heating and cooling rates were 10 K min−1 and 20 K min−1, respectively. The density of the sintered compacts was determined using the gas pycnometer method (AccuPyc II 1340, Micromeritics). The sintered compacts of 15 mm diameter were cut into rods of ∼2 × ∼2 × ∼7 mm for the measurements of the Seebeck coefficient and electrical resistivity, and squares of ∼10 × ∼10 × ∼2 mm for thermal diffusivity measurements. The sintered compacts of 10 mm diameter were cut into plates of ∼5 × ∼5 × ∼0.2 mm for Hall measurements.
2.2 Powder X-ray diffraction and scanning electron microscopy
Crystal structures of the as-prepared ingots and sintered compacts were examined by powder X-ray diffractometry (XRD; MiniFlex600, Rigaku) with Cu Kα radiation over the 2θ range 10–100° at room temperature. The powder XRD patterns were refined by the Le Bail method using the JANA200640 to calculate the lattice parameters. The crystal structures were drawn with the VESTA software.41The microstructures and chemical compositions of the sintered compacts were investigated by scanning electron microscopy (SEM; 15 kV, Miniscope TM3030Plus, Hitachi High-Technologies) with energy dispersive X-ray spectroscopy (EDX; Quantax70, Bruker).
2.3 Thermogravimetric analysis
The thermogravimetry curves of the as-prepared ingots and sintered compacts were obtained using a DTG-60 (Shimadzu). The powders of 5 mg mass were put in a boron nitride crucible and heated to 1023 K under an Ar gas flow atmosphere (100 ml min−1) at a rate of 5 K min−1. The α-Al2O3 powder was used as a reference.2.4 Electrical transport measurement
The Seebeck coefficient S and electrical resistivity ρ of the sintered compacts were simultaneously measured using temperature-differential and four-probe methods, respectively, under a He atmosphere over the temperature range of 300–670 K (ZEM-3, ADVANCE RIKO). The values of S and ρ were reproducible over heating and cooling cycles for all samples. The relative uncertainty of the measurements was estimated to be 5%.The Hall coefficient RH was measured at room temperature by the Van der Pauw method with a home-built system under a magnetic field of 2.3 tesla. The Cu contact wires were attached to the sintered samples using In-rich In–Ga paste.
2.5 Thermal transport measurement
The total thermal conductivity κtotal of the sintered compacts was calculated from the density (d), heat capacity Cp, and thermal diffusivity D using the expression κtotal = dCpD. The thermal diffusivity was directly measured and the heat capacity was indirectly derived using a standard sample (Pyroceram 9606, Netzsch) using the laser flash method (LFA 457 MicroFlash, Netzsch) under an Ar gas flow atmosphere at 100 ml min−1 over the temperature range of 300–670 K. Graphite spray coating was applied on the sample surface in order to improve the emission and absorption properties. The heat capacity and thermal diffusivity were measured over heating and cooling cycles. The heat capacity and thermal diffusivity are provided in Fig. S1 in the ESI.† The relative uncertainty of the thermal conductivity is estimated to be smaller than 8% from the uncertainties of d, Cp, and D. Thus, the combined relative uncertainty for the calculation of ZT is approximately 12%.3. Results and discussion
3.1 Synthesis and sintering
Fig. 2(a) shows the powder X-ray diffraction (XRD) patterns of the as-prepared ingots of Cu26A2Sn6S32 (A = V, Nb, Ta) over the 2θ range of 10–100° at room temperature. Most of the reflections are those of the cubic colusite-type structure with a P3n space group,36,37 while weak peaks due to impurities are observed. Moreover, the main peaks are split as shown in the inset (see Fig. 2(b)), which cannot be accounted for by using the different wavelengths of Cu Kα1 and Kα2. In our previous work, the scanning electron microscopy (SEM) examination with wavelength dispersive X-ray spectroscopy (SEM-WDX) has revealed that the sintered compact with A = V consists of two colusite phases with slightly different chemical compositions (Sn poor and Sn rich phases).32–34 Moreover, the Sn-poor and Sn rich colusite phases have been formed in natural colusites.36 In our as-prepared samples, the splitting of the main peaks on the XRD patterns is probably due to the presence of two colusite phases. This experimental observation likely originates from an exsolution phenomenon.35
 | ||
| Fig. 2 (a) Powder X-ray diffraction (XRD) patterns for the as-prepared ingots of Cu26A2Sn6S32 (A = V, Nb, Ta) over the 2θ range of 10–100°. (b) The inset shows the 622 peaks on the expanded scale. | ||
Fig. 3(a) and S2 in the ESI† show the XRD patterns of the sintered compacts of Cu26A2Sn6S32 (A = V, Nb, Ta) with simulated ones over the 2θ range of 10–60° and 2θ range of 10–100°, respectively, at room temperature. Unlike the as-prepared ingots (Fig. 2), no impurity peaks are observed in the sintered compacts within the detection limits of the XRD. Furthermore, the XRD peak splitting disappears as shown in Fig. 3(b). In our previous study, XRD peak splitting remained in the A = V system after the sintering with a holding time of 5 min to 10 min.32–34 The longer holding time (1 h) in the sintering process causes an annealing effect, promoting the change from two colusite phases to a single colusite phase.
 | ||
| Fig. 3 (a) Powder X-ray diffraction (XRD) patterns for the sintered compacts of Cu26A2Sn6S32 (A = V, Nb, Ta) denoted by (I), (II), and (III) with simulated ones denoted by (I)′, (II)′, and (III)′, respectively, over the 2θ range of 10° to 60°. The major peaks are labeled with Miller indices hkl. (b) The 622 peaks on the expanded scale. | ||
The refined lattice parameters of the two colusite phases for the as-prepared ingots are denoted as a1 and a2 (with a1 > a2) and that of the single colusite phase for the sintered compacts is denoted as a. The a1, a2 and a are listed in Table 1 for all A = V, Nb, and Ta systems. The a1 is ∼0.4% larger than the a2; for example, the a1 and a2 of Cu26Ta2Sn6S32 are 1.0865 nm and 1.0827 nm, respectively. The a is slightly larger than a1 for all systems; for example, the a of the A = Ta system (1.0885 m) is ∼0.2% larger than a1 (1.0865 nm).
| Nominal composition | Lattice parameter | ||
|---|---|---|---|
| As-prepared ingot | Sintered compact | ||
| a 1 (nm) | a 2 (nm) | a (nm) | |
| Cu26V2Sn6S32 | 1.0798 | 1.0759 | 1.0812 |
| Cu26Nb2Sn6S32 | 1.0852 | 1.0810 | 1.0877 |
| Cu26Ta2Sn6S32 | 1.0865 | 1.0827 | 1.0885 |
In the thermogravimetry (TG) curve for the as-prepared ingots, the weight drops sharply over the temperature of 600–700 K in an Ar flow atmosphere (Fig. 4(a)). The weight reductions are likely due to the evaporation of a part of sulfur, which has the lowest boiling point of 718 K among all the constituent elements. This result implies that the metal content of sintered compacts is larger than the stoichiometric value. This is in fact supported by the SEM-EDX as discussed below. No weight loss was detected in the TG curves up to 750 K for all sintered compacts, as shown in Fig. 4(b).
 | ||
| Fig. 4 Thermogravimetry curves for the powdered samples of (a) as-prepared ingots and (b) sintered compacts of Cu26A2Sn6S32 (A = V, Nb, Ta). | ||
The SEM back scattered electron (BSE) images of the polished surface of the sintered compacts of Cu26A2Sn6S32 (A = V, Nb, Ta) are shown in Fig. 5. The SEM-EDX investigations reveal a high homogeneity for A = Nb and V but the presence of secondary phases for the A = Ta sintered compact. For the latter, microscale CuS- and Cu2S-based secondary phases were identified, whose actual compositions are listed in Table S1 in the ESI.†
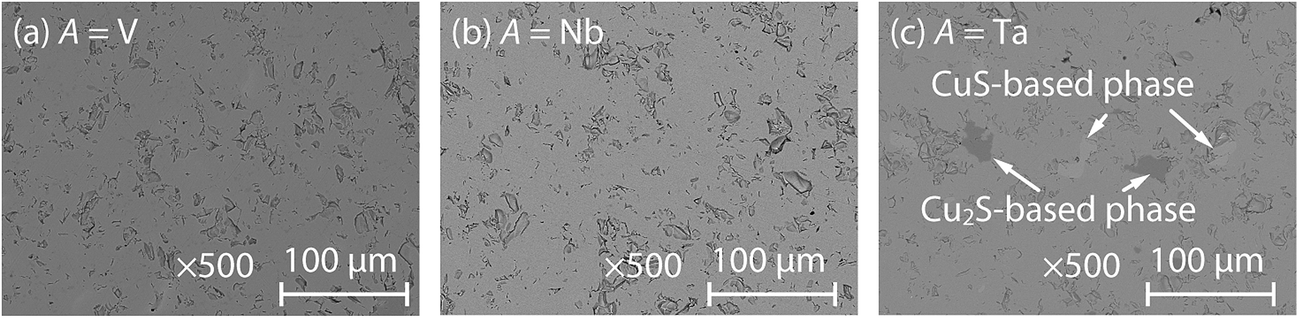 | ||
| Fig. 5 Backscattered electron images of the hot-press sintered compacts of Cu26A2Sn6S32 (A = (a) V, (b) Nb, (c) Ta). In (c) for A = Ta, the gray and dark gray areas are CuS- and Cu2S-based secondary phases, respectively. | ||
For the sintered compacts, the nominal composition, measured density, and calculated density are summarized in Table 2. It should be noted that the measured density d is larger by ∼3% than the calculated one estimated from the lattice parameter a and nominal composition. This difference suggests that the actual composition deviates from the nominal one. The average values of the composition were calculated from five spots EDX data on the surface and are listed in Table 2. We calculated the composition using two assumptions: (i) the sum of the number of cations (Cu, A, and Sn) is 34, and (ii) the number of S atoms in the unit cell is 32. The calculated density was estimated from the a and EDX composition. In the case of assumption (i), the calculated density was smaller than the measured one. For example, the calculated density of 4.4 g cm−3 for the A = V sintered compact is 9% lower than its measured value of 4.73 g cm−3 at room temperature. On the other hand, assumption (ii) provides a reasonable agreement between the calculated and measured densities for all systems. In the A = V sample, the calculated and measured densities are 4.80 g cm−3 and 4.73 g cm−3, respectively. For all samples, the measured densities were estimated to be greater than 96% of the calculated densities. In assumption (ii), the composition of the cations is larger than the stoichiometric one. These extra cations are a result of the loss of sulfur during the sintering process. To understand the better agreement for (ii), it should be noted that relatively large voids are present in the colusite crystal structure, such as the interstitial site 6b (0, 0, 1/2) surrounded by four S atoms as shown in Fig. 1.36,37 The extra cations could occupy these large voids. For example, in the A = Ta system, the interatomic distance between the interstitial 6b site and the nearest S site is 0.2357 nm. This distance fairly agrees with the one between the Cu and S in the CuS4 tetrahedron (0.2363 nm), suggesting that the interstitial 6b site could be partially filled with extra Cu atoms.
| Assumption | Chemical composition | Calculated density (g cm−3) | Measured density (g cm−3) | |||
|---|---|---|---|---|---|---|
| Cu | V | Sn | S | |||
| Nominal composition | 26 | 2 | 6 | 32 | 4.59 | 4.73 |
| (i) Cations = 34 | 26.8(12) | 2.0(2) | 5.3(3) | 28.2(11) | 4.4(2) | |
| (ii) Sulfur = 32 | 29.3(10) | 2.2(3) | 5.8(3) | 32 | 4.8(1) | |
| Assumption | Chemical composition | Calculated density (g cm−3) | Measured density (g cm−3) | |||
|---|---|---|---|---|---|---|
| Cu | Nb | Sn | S | |||
| Nominal composition | 26 | 2 | 6 | 32 | 4.61 | 4.80 |
| (i) Cations = 34 | 27.0(19) | 1.9(2) | 5.1(6) | 28.6(18) | 4.4(2) | |
| (ii) Sulfur = 32 | 30.2(13) | 2.2(1) | 5.7(6) | 32 | 4.9(1) | |
| Assumption | Chemical composition | Calculated density (g cm−3) | Measured density (g cm−3) | |||
|---|---|---|---|---|---|---|
| Cu | Ta | Sn | S | |||
| Nominal composition | 26 | 2 | 6 | 32 | 4.83 | 5.03 |
| (i) Cations = 34 | 26.3(14) | 2.3(4) | 5.4(4) | 29.2(15) | 4.7(2) | |
| (ii) Sulfur = 32 | 28.8(13) | 2.6(5) | 5.9(4) | 32 | 5.2(2) | |
3.2 Thermoelectric properties
The temperature dependences of the Seebeck coefficient S and electrical resistivity ρ for the sintered compacts of Cu26A2Sn6S32 (A = V, Nb, Ta) over the temperature range of 300–670 K are shown in Fig. 6(a) and (b), respectively. Both ρ and S increase monotonically with temperature, which are the characteristics of a degenerate semiconductor. This trend is in agreement with previous studies performed on V-based colusite compounds.32–35 The signs of S and Hall coefficient RH (see Table 3) are positive, confirming p-type carrier transport. The ρ for A = Ta is lower than those for A = V and Nb over the whole temperature range measured. At 660 K, the ρ for A = V, Nb, and Ta is 63 μΩ m, 73 μΩ m, and 57 μΩ m, respectively. The secondary phases in the A = Ta sample probably contribute p-type charge carriers, reducing the electrical resistivity in comparison to the A = Nb and V samples. The value of ρ for A = V is lower than that for the sample Cu26V2Sn6S32 reported by Suekuni et al.,34 which reaches 110 μΩ m at 660 K. The former and latter sintered compacts consist of a single colusite phase and two colusite phases, respectively. Moreover, the former and latter values were measured for the actual compositions Cu26.8V2.0Sn5.3S28.2 and Cu25.97V2.09Sn5.95S30.62 (80%)/Cu25.15V2.34Sn6.51S31.43 (20%), respectively. The differences in the crystal phases and chemical composition between two sintered compacts result in the difference in ρ. The S for A = V, Nb and Ta increases with temperature reaching a value of ∼200 μV K−1 at 660 K. The results suggest that the chemical substitution of Ta and Nb for V has little effect on the electrical properties, but the secondary phases in the sample for A = Ta affect the electrical properties. Fig. 6(c) shows the power factor (S2/ρ) of the Cu26A2Sn6S32. Owing to the lowest ρ for the sample with A = Ta, the S2/ρ reaches the highest value of ∼0.69 mW K−2 m−1 at 660 K. | ||
| Fig. 6 Temperature dependence of (a) Seebeck coefficient S, (b) electrical resistivity ρ, and (c) thermoelectric power factor S2/ρ for the sintered compacts of Cu26A2Sn6S32 (A = V, Nb, Ta) over the temperature range of 300–670 K. The S and ρ were measured during both heating and cooling cycles. | ||
| Nominal composition | R H (10−8 m3 C−1) | p (1020 cm−3) | μ (cm2 V−1 s−1) | m*/m0 |
|---|---|---|---|---|
| Cu26V2Sn6S32 | 1.50 | 4.2 | 4.4 | 3.2 |
| Cu26Nb2Sn6S32 | 1.35 | 4.7 | 3.5 | 3.6 |
| Cu26Ta2Sn6S32 | 0.95 | 6.6 | 3.6 | 4.3 |
We found that S and ρ are proportional to the hole carrier concentration p using the following relations:
 | (2) |
 | (3) |
The hole mobility μ (Table 3) of Cu26A2Sn6S32 with A = V, Nb, and Ta is estimated to be ∼4.4 cm2 V−1 s−1, ∼3.5 cm2 V−1 s−1, and ∼3.6 cm2 V−1 s−1, respectively. The similar values of the μ suggest that the microstructures of the CuS- and Cu2S-based secondary phases have only a small effect on the μ of the systems. As already reported in a previous study,34 the p for Sn-poor sintered compacts (Cu26V2Sn6−xS32, x = 0.5, 1.0) is higher than that for x = 0, leading to a higher S2/ρ. Consequently, a fine-tuning of the p by changing the Sn content would further boost the S2/ρ of the A = Nb and Ta systems.
The room-temperature values of m* were calculated from measured S and p and are given in Table 3. For the three samples, the values of m* lie in the range of 3.2m0 to 4.3m0 (m0 is the free electron mass). From the relation of S ∝ m* in eqn (2), the heavy m* should lead to a high S for the systems. The Mahan–Sofo theory shows that a local increase of DOS at the Fermi energy results in an increase of the m*, enhancing the S.43,44S is proportional to m* and (1/p)2/3 (eqn (2)). The differences in m* and (1/p)2/3 between the sintered compacts of A = V, Nb, and Ta result in almost the same values of S for all the samples.
The temperature dependences of the total thermal conductivity κtotal and lattice thermal conductivity κlat for the sintered compacts of Cu26A2Sn6S32 (A = V, Nb, Ta) are shown in Fig. 7. The electronic thermal conductivity κel was estimated using the Wiedemann–Franz relation (κel = LT/ρ), where L is the Lorenz number. Then the κlat was calculated by subtracting κel from κtotal. In a single parabolic band dominated by acoustic phonon scattering, L can be estimated as a function of reduced chemical potential (ζ*):15,45–47
 | (4) |
 | (5) |
 | (6) |
 | ||
| Fig. 7 Temperature dependence of the total thermal conductivity κtotal and its lattice contribution κlat for the sintered compacts of Cu26A2Sn6S32 (A = V, Nb, Ta) on heating and cooling cycles over the temperature range of 300–670 K. | ||
Fig. 8 shows the dimensionless thermoelectric figure of merit ZT versus temperature. The ZT for the A = V and Nb samples monotonically increases with temperature and achieves a value of 0.6–0.7 at 670 K. Comparable values were obtained by Suekuni et al. for Cu26V2E6S32 (E = Sn, Ge), with a ZT of 0.6 and 0.7 at 663 K for Cu26V2Sn6S32 and Cu26V2Ge6S32, respectively.33 Due to the lower ρ and κtotal, the A = Ta sample reaches a higher value of 0.8 at 670 K. This value approaches the thermoelectric performances of tetrahedrite compounds at the same temperature (ZT ∼ 1.0).27 We have successfully demonstrated the promising ZT for environmentally friendly colusites Cu26A2Sn6S32 (A = Nb, Ta) at intermediate temperature (∼700 K).
 | ||
| Fig. 8 Temperature dependence of the thermoelectric figure of merit ZT for Cu26A2Sn6S32 (A = V, Nb, Ta) sintered compacts over the temperature range of 300–670 K during heating and cooling cycles. | ||
4. Conclusion
We have successfully developed a new class of environmentally friendly and cost-effective thermoelectric materials based on colusites Cu26A2Sn6S32 (A = Nb, Ta). The as-prepared ingots consist of two colusite phases with different lattice parameters, which have been converted to single-phase samples by hot-press sintering. The chemical substitution of isoelectronic Nb and Ta for V has little effect on the thermoelectric properties. For the three systems, the heavy effective mass (3m0–4m0) leads to a high power factor. Furthermore, the complex unit cell of colusites yields very low lattice thermal conductivity below 0.6 W K−1 m−1 over the temperature range of 300–670 K. For the A = Ta sample, the CuS- and Cu2S-based secondary phases formed in the sintered compact effectively scatter the phonons, leading to a lower lattice thermal conductivity. Moreover, the carrier concentration in the system is the highest among all the samples, resulting in a higher power factor. Consequently, the A = Ta sample shows an enhanced ZT value of ∼0.8 at 670 K.Conflict of interest
The authors declare that they have no competing financial interests.Author contributions
Y. K. and Y. B. contributed equally to this work. M. O., K. S., and T. T. designed the project. Y. K., Y. B., M. O., and M. A. synthesized and sintered the samples. Y. K., Y. B., and M. O. performed the XRD, SEM, and TG experiments, and investigated the electrical and thermal properties. Y. K., Y. B., M. O., K. S., and T. T. analyzed the results. Y. K., Y. B., M. O., K. S., and T. T. drafted the manuscript. All authors read and approved the final manuscript.Acknowledgements
The authors are grateful to Mr Masaru Kunii of AIST and Ms Naoko Fujimoto of AIST for preparing the samples, and also Mr Hirotaka Nishiate of AIST for operating the ZEM-3, LFA 457, and Hall measurement system. This work was supported as part of the International Joint Research Program for Innovative Energy Technology funded by the Ministry of Economy, Trade and Industry, Japan. This work at AIST was supported by JSPS KAKENHI Grant Number 25420699.References
- Science & Technology Review, Lawrence Livermore National Laboratory, September, 2009, pp. 17–19 Search PubMed.
- T. Kajikawa, in Thermoelectrics Handbook: Macro to Nano, ed. D. M. Rowe, CRC Press, Boca Raton, 2005, p. 50-1 Search PubMed.
- L. E. Bell, Science, 2008, 321, 1457–1461 CrossRef CAS PubMed.
- D. M. Rowe, in Thermoelectrics and its Energy Harvesting: Modules, Systems, and Applications in Thermoelectrics, ed. D. M. Rowe, CRC Press, Boca Raton, 2012, p. 23-1 Search PubMed.
- J. Yang, in Thermoelectrics and its Energy Harvesting: Modules, Systems, and Applications in Thermoelectrics, ed. D. M. Rowe, CRC Press, Boca Raton, 2012, p. 25-1 Search PubMed.
- G. J. Snyder and E. S. Toberer, Nat. Mater., 2008, 7, 105–114 CrossRef CAS PubMed.
- J. R. Sootsman, D. Y. Chung and M. G. Kanatzidis, Angew. Chem., Int. Ed., 2009, 48, 8616–8639 CrossRef CAS PubMed.
- M. G. Kanatzidis, Chem. Mater., 2010, 22, 648–659 CrossRef CAS.
- C. J. Vineis, A. Shakouri, A. Majumdar and M. G. Kanatzidis, Adv. Mater., 2010, 22, 3970–3980 CrossRef CAS PubMed.
- K. Nielsch, J. Bachmann, J. Kimling and H. Böttner, Adv. Energy Mater., 2011, 1, 713–731 CrossRef CAS.
- M. Ohta, K. Biswas, S.-H. Lo, J. Q. He, D. Y. Chung, V. P. Dravid and M. G. Kanatzidis, Adv. Energy Mater., 2012, 2, 1117–1123 CrossRef CAS.
- K. Biswas, J. Q. He, I. D. Blum, C.-I. Wu, T. P. Hogan, D. N. Seidman, V. P. Dravid and M. G. Kanatzidis, Nature, 2012, 489, 414–418 CrossRef CAS PubMed.
- L.-D. Zhao, V. P. Dravid and M. G. Kanatzidis, Energy Environ. Sci., 2014, 7, 251–268 CAS.
- P. Jood, M. Ohta, M. Kunii, X. K. Hu, H. Nishiate, A. Yamamoto and M. G. Kanatzidis, J. Mater. Chem. C, 2015, 3, 10401–10408 RSC.
- X. K. Hu, P. Jood, M. Ohta, M. Kunii, K. Nagase, H. Nishiate, M. G. Kanatzidis and A. Yamamoto, Energy Environ. Sci., 2016, 9, 517–529 CAS.
- L.-D. Zhao, S.-H. Lo, Y. S. Zhang, H. Sun, G. J. Tan, C. Uher, C. Wolverton, V. P. Dravid and M. G. Kanatzidis, Nature, 2014, 508, 373–377 CrossRef CAS PubMed.
- L.-D. Zhao, G. J. Tan, S. Q. Hao, J. Q. He, Y. L. Pei, H. Chi, H. Wang, S. K. Gong, H. B. Xu, V. P. Dravid, C. Uher, G. J. Snyder, C. Wolverton and M. G. Kanatzidis, Science, 2016, 351, 141–144 CrossRef CAS PubMed.
- D. Kraemer, J. Sui, K. McEnaney, H. Zhao, Q. Jie, Z. F. Ren and G. Chen, Energy Environ. Sci., 2015, 8, 1299–1308 CAS.
- K. Suekuni and T. Takabatake, APL Mater., 2016, 4, 104503 CrossRef.
- Y. He, T. Day, T. S. Zhang, H. L. Liu, X. Shi, L. D. Chen and G. J. Snyder, Adv. Mater., 2014, 26, 3974–3978 CrossRef CAS PubMed.
- L. L. Zhao, X. L. Wang, F. Y. Fei, J. Y. Wang, Z. X. Cheng, S. X. Dou, J. Wang and G. J. Snyder, J. Mater. Chem. A, 2015, 3, 9432–9437 CAS.
- G. Dennler, R. Chmielowski, S. Jacob, F. Capet, P. Roussel, S. Zastrow, K. Nielsch, I. Opahle and G. K. H. Madsen, Adv. Energy Mater., 2014, 4, 1301581 CrossRef.
- K. Suekuni, K. Tsuruta, M. Kunii, H. Nishiate, E. Nishibori, S. Maki, M. Ohta, A. Yamamoto and M. Koyano, J. Appl. Phys., 2013, 113, 043712 CrossRef.
- X. Lu, D. T. Morelli, Y. Xia, F. Zhou, V. Ozolins, H. Chi, X. Y. Zhou and C. Uher, Adv. Energy Mater., 2013, 3, 342–348 CrossRef CAS.
- X. Lu and D. T. Morelli, MRS Commun., 2013, 3, 129–133 CrossRef CAS.
- J. Heo, G. Laurita, S. Muir, M. A. Subramanian and D. A. Keszler, Chem. Mater., 2014, 26, 2047–2051 CrossRef CAS.
- X. Lu, D. T. Morelli, Y. Xia and V. Ozolins, Chem. Mater., 2015, 27, 408–413 CrossRef CAS.
- Y. Bouyrie, C. Candolfi, V. Ohorodniichuk, B. Malaman, A. Dauscher, J. Tobola and B. Lenoir, J. Mater. Chem. C, 2015, 3, 10476–10487 RSC.
- R. Chetty, A. Bali and R. C. Mallik, J. Mater. Chem. C, 2015, 3, 12364–12378 RSC.
- R. Chetty, A. Bali, M. H. Naik, G. Rogl, P. Rogl, M. Jain, S. Suwas and R. C. Mallik, Acta Mater., 2015, 100, 266–274 CrossRef CAS.
- P. Jood and M. Ohta, Materials, 2015, 8, 1124–1149 CrossRef.
- K. Suekuni, F. S. Kim and T. Takabatake, J. Appl. Phys., 2014, 116, 063706 CrossRef.
- K. Suekuni, F. S. Kim, H. Nishiate, M. Ohta, H. I. Tanaka and T. Takabatake, Appl. Phys. Lett., 2014, 105, 132107 CrossRef.
- F. S. Kim, K. Suekuni, H. Nishiate, M. Ohta, H. I. Tanaka and T. Takabatake, J. Appl. Phys., 2016, 119, 175105 CrossRef.
- C. Bourgès, M. Gilmas, P. Lemoine, N. E. Mordvinov, O. I. Lebedev, E. Hug, V. Nassif, B. Malaman, R. Daou and E. Guilmeau, J. Mater. Chem. C, 2016, 4, 7455–7463 RSC.
- P. G. Spry, S. Merlino, S. Wang, X. M. Zhang and P. R. Buseck, Am. Mineral., 1994, 79, 750–762 CAS.
- O. V. Frank-Kamenetskaya, I. V. Rozhdestvenskaya and L. A. Yanulova, J. Struct. Chem., 2002, 43, 89–100 CrossRef CAS.
- H. Wyers, Br. J. Ind. Med., 1946, 3, 177–182 CAS.
- J. L. Domingo, Reprod. Toxicol., 1996, 10, 175–182 CrossRef CAS PubMed.
- V. Petricek, M. Dusek and L. Palatinus, Z. Kristallogr., 2014, 229, 345–352 CAS.
- K. Momma and F. Izumi, J. Appl. Crystallogr., 2011, 44, 1272–1276 CrossRef CAS.
- M. Cutler, J. F. Leavy and R. L. Fitzpatrick, Phys. Rev., 1964, 133, A1143–A1152 CrossRef.
- G. D. Mahan and J. O. Sofo, Proc. Natl. Acad. Sci. U. S. A., 1996, 93, 7436–7439 CrossRef CAS.
- J. P. Heremans, V. Jovovic, E. S. Toberer, A. Saramat, K. Kurosaki, A. Charoenphakdee, S. Yamanaka and G. J. Snyder, Science, 2008, 321, 554–557 CrossRef CAS PubMed.
- A. F. May, J.-P. Fleurial and G. J. Snyder, Phys. Rev. B: Condens. Matter Mater. Phys., 2008, 78, 125205 CrossRef.
- S. Johnsen, J. Q. He, J. Androulakis, V. P. Dravid, I. Todorov, D. Y. Chung and M. G. Kanatzidis, J. Am. Chem. Soc., 2011, 133, 3460–3470 CrossRef CAS PubMed.
- M. Ohta, S. Satoh, T. Kuzuya, S. Hirai, M. Kunii and A. Yamamoto, Acta Mater., 2012, 60, 7232–7240 CrossRef CAS.
Footnote |
| † Electronic supplementary information (ESI) available. See DOI: 10.1039/c6ta05945g |
| This journal is © The Royal Society of Chemistry 2016 |