
 Open Access Article
 This Open Access Article is licensed under a Creative Commons Attribution-Non Commercial 3.0 Unported Licence
Guanidinium nonaflate as a solid-state proton conductor†
Xiaoli
Chen
a,
Haolin
Tang
 *a,
Tristan
Putzeys
b,
Jeroen
Sniekers
c,
Michael
Wübbenhorst
b,
Koen
Binnemans
c,
Jan
Fransaer
d,
Dirk E.
De Vos
e,
Qingfeng
Li
f and
Jiangshui
Luo
*def
*a,
Tristan
Putzeys
b,
Jeroen
Sniekers
c,
Michael
Wübbenhorst
b,
Koen
Binnemans
c,
Jan
Fransaer
d,
Dirk E.
De Vos
e,
Qingfeng
Li
f and
Jiangshui
Luo
*def
aState Key Laboratory of Advanced Technology for Materials Synthesis and Processing, Wuhan University of Technology, Wuhan 430070, P. R. China. E-mail: thln@whut.edu.cn
bDepartment of Physics and Astronomy, KU Leuven, Leuven 3001, Belgium
cDepartment of Chemistry, KU Leuven, Leuven 3001, Belgium
dDepartment of Materials Engineering, KU Leuven, Leuven 3001, Belgium. E-mail: jiangshui.luo@kuleuven.be
eCentre for Surface Chemistry and Catalysis, KU Leuven, Leuven 3001, Belgium
fDepartment of Energy Conversion and Storage, Technical University of Denmark, Kgs. Lyngby 2800, Denmark
First published on 8th July 2016
Abstract
Protic organic ionic plastic crystals (POIPCs) are a type of novel solid-state proton conductors. In this work, guanidinium nonaflate ([Gdm-H][NfO]) is reported to be a model POIPC. Its structure–property relationship has been investigated comprehensively. Infrared analysis of [Gdm-H][NfO] and its deuterated analogue [Gdm-D][NfO] confirms the complete formation of the protic salts. The cations in as-prepared [Gdm-D][NfO] are estimated to consist of [C(ND2)2(NHD)]+ and [C(ND2)3]+ with a molar ratio of around 1![[thin space (1/6-em)]](https://www.rsc.org/images/entities/char_2009.gif) :1. The deuteration also proves that each guanidinium cation has six displaceable protons. Thermogravimetric analysis demonstrates that [Gdm-H][NfO] exhibits superior thermal stability in both nitrogen and air atmospheres. Isothermogravimetric analysis reveals its negligible vapor pressure with an estimated high enthalpy of vaporization (120.9 kJ mol−1). Differential scanning calorimetry measurements of [Gdm-H][NfO] show four evident endothermic peaks prior to its melting transition at 186.2 °C with a low entropy of melting (17.70 J K−1 mol−1). Shortly before the onset temperature of melting transition (186.2 °C), partial melting (partial liquefaction) was observed via polarized optical microscopy in the temperature region of 176–186 °C while the reason for partial melting of ionic plastic crystals is not clear yet. Variable-temperature powder X-ray diffraction tests confirm the related solid-solid phase transitions and demonstrate that [Gdm-H][NfO] exhibits short-range disorder and long-range positional order in the plastic crystalline phases. Dielectric spectroscopy measurements show that its ionic conductivity reaches 2.1 × 10⁻³ S cm−1 at 185 °C. The proton conduction in the plastic crystalline phases of [Gdm-H][NfO] is assumed to happen via the vehicle mechanism. In the molten state, the proton conduction follows a combination of the vehicle mechanism and the Grotthuss mechanism (structural diffusion). In summary, due to their exceptional physicochemical properties, POIPCs like [Gdm-H][NfO] are promising electrolyte materials for high temperature (100–200 °C) proton exchange membrane fuel cells. In addition, POIPC-based solid-state proton conductors are also expected to find applications in sensors and other electrochemical devices.
:1. The deuteration also proves that each guanidinium cation has six displaceable protons. Thermogravimetric analysis demonstrates that [Gdm-H][NfO] exhibits superior thermal stability in both nitrogen and air atmospheres. Isothermogravimetric analysis reveals its negligible vapor pressure with an estimated high enthalpy of vaporization (120.9 kJ mol−1). Differential scanning calorimetry measurements of [Gdm-H][NfO] show four evident endothermic peaks prior to its melting transition at 186.2 °C with a low entropy of melting (17.70 J K−1 mol−1). Shortly before the onset temperature of melting transition (186.2 °C), partial melting (partial liquefaction) was observed via polarized optical microscopy in the temperature region of 176–186 °C while the reason for partial melting of ionic plastic crystals is not clear yet. Variable-temperature powder X-ray diffraction tests confirm the related solid-solid phase transitions and demonstrate that [Gdm-H][NfO] exhibits short-range disorder and long-range positional order in the plastic crystalline phases. Dielectric spectroscopy measurements show that its ionic conductivity reaches 2.1 × 10⁻³ S cm−1 at 185 °C. The proton conduction in the plastic crystalline phases of [Gdm-H][NfO] is assumed to happen via the vehicle mechanism. In the molten state, the proton conduction follows a combination of the vehicle mechanism and the Grotthuss mechanism (structural diffusion). In summary, due to their exceptional physicochemical properties, POIPCs like [Gdm-H][NfO] are promising electrolyte materials for high temperature (100–200 °C) proton exchange membrane fuel cells. In addition, POIPC-based solid-state proton conductors are also expected to find applications in sensors and other electrochemical devices.
Introduction
Hydrogen fuel is a promising candidate for replacing fossil fuels. Proton exchange membrane fuel cells (PEMFCs) are promising electrochemical devices for the direct conversion of hydrogen energy into electric energy.1 Commercial PEMFCs mainly employ perfluorinated sulfonic acid membranes (e.g. Nafion®). However, these fuel cells still have several disadvantages, including high cost, low reliability and dependence on hydration of inlet gases. Despite extensive research, the proton exchange membrane (PEM), which is a critical component of PEMFCs and which is in essence a proton conductor, still faces multiple challenges. On the other hand, operating PEMFCs at high temperatures (typically 100–200 °C) can offer some benefits such as improved electrode kinetics, simpler water and heat management, and better tolerance to fuel impurities, leading to higher overall energy conversion efficiencies. Therefore, high temperature PEMFCs have attracted a lot of attention from the research community in recent years.2State-of-the-art high temperature PEMFCs involve liquid electrolytes, such as H3PO4 and ionic liquids.2–4 However, they have potential drawbacks such as leaching of liquids, accelerated degradation of fuel cell components due to the use of acid doped systems, and long-term instability. Hence, solid-state proton conductors are preferred due to their advantages in terms of fabrication, maintenance and durability of devices.5 Haile et al. reported solid acids (e.g. CsHSO4) as fuel cell electrolytes.5b,c The practical application of these solid acid electrolytes suffers from the narrow temperature window of the superprotonic phase, poor thermal stability, requirement of humidity for stabilization, and difficulties for the preparation of thin films from inorganic rigid particles.5b,c
Recently, we have demonstrated that protic organic ionic plastic crystals (POIPCs), which are solid protic organic salts formed by proton transfer from a Brønsted acid to a Brønsted base, are promising solid-state proton conductors for high temperature PEMFCs.5a
Like molecular plastic crystals6 and other organic ionic plastic crystals,7–11 POIPCs exhibit mesophases (i.e. states of matter intermediate between liquid and solid), which are characterized by various forms of disorder due to one or more solid-solid phase transitions below the melting point and therefore exhibit soft, plastic mechanical properties and notable ionic (protonic) conductivity.5a The unique mechanical and transport properties of POIPCs originate from their long-range positional order but short-range orientational or rotational disorder of cations and/or anions in the crystal, allowing for high intrinsic proton conductivity in the solid state. Meanwhile, they exhibit other desirable properties such as non-flammability, negligible volatility, high thermal stability, and wide electrochemical windows, favoring their long-term stability when applied in high temperature PEMFCs under harsh working conditions (e.g. high temperature, flowing gases, and oxidative and reductive environment at the anode and the cathode, respectively).
Nevertheless, the limited reported POIPCs5a,11,12 as solid-state proton conductors suffer from shortcomings such as (i) insufficient proton conductivity (e.g. 2.62 × 10⁻⁶ S cm−1 at 165 °C for 1,2,4-triazolium nonaflate5a) or (ii) relatively narrow plastic crystalline phase (e.g. 174–188 °C for imidazolium methanesulfonate11 and 115–160 °C for guanidinium triflate12 as pure POIPCs).
Herein, we report guanidinium nonaflate [Gdm-H][NfO] (Fig. 1) as a new POIPC with significant ionic conductivity in the higher-temperature plastic crystalline phase as well as high thermal stability and negligible volatility. Its deuterated analogue [Gdm-D][NfO] (Fig. 1) was also prepared and investigated.
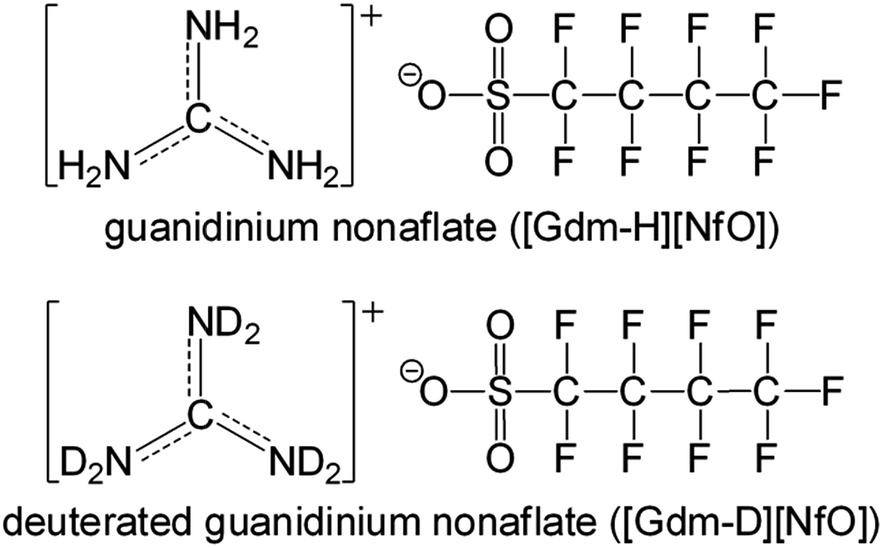 | ||
| Fig. 1 Chemical structures of guanidinium nonaflate [Gdm-H][NfO] and its deuterated form [Gdm-D][NfO]. | ||
Experimental
Sample preparation
[Gdm-H][NfO] was prepared by combination of equimolar amounts of nonaflic acid (n-C4F9SO3H, TCI, 98%) and carbonate salt of guanidine (NH2C(![[double bond, length as m-dash]](https://www.rsc.org/images/entities/char_e001.gif) NH)NH2·½H2CO3, Alfa Aesar, 98%). The nonaflic acid was firstly diluted and then slowly added to a solution of the carbonate salt of guanidine under magnetic stirring in an ice bath for 3 h. The mixture was further heated at 120 °C in a silicon oil bath for 24 h to promote the neutralization reaction. Bubbles of carbon dioxide were released during the reaction. After the reaction, the compound was purified by heating it on a Schlenk line in vacuo at 190 °C for 18 h to remove water and the excess base or acid (if any), resulting in a dry crystalline powder. The purified samples were stored in an argon-filled glove box prior to further characterizations.
NH)NH2·½H2CO3, Alfa Aesar, 98%). The nonaflic acid was firstly diluted and then slowly added to a solution of the carbonate salt of guanidine under magnetic stirring in an ice bath for 3 h. The mixture was further heated at 120 °C in a silicon oil bath for 24 h to promote the neutralization reaction. Bubbles of carbon dioxide were released during the reaction. After the reaction, the compound was purified by heating it on a Schlenk line in vacuo at 190 °C for 18 h to remove water and the excess base or acid (if any), resulting in a dry crystalline powder. The purified samples were stored in an argon-filled glove box prior to further characterizations.
Deuterated guanidinium nonaflate [Gdm-D][NfO] (Fig. 1) was prepared as follows: 10.0 g of D2O (99.9 at.% D, InnoChem, Beijing) was used to dissolve 2.0 g of [Gdm-H][NfO] (n([Gdm-H][NfO]):n(D2O) = 1:90) in a well-sealed flask with magnetic stirring for 12 h. The solution was then stored at room temperature for 1 week. The deuterated sample was thereafter dried at 55 °C on a rotary evaporator under reduced pressure to obtain a white solid. Then the deuteration process was repeated using 10.0 g of D2O (100.0 at.% D, Acros Organics) as the solvent for the once deuterated sample. The obtained solution was kept at room temperature for another week to guarantee further deuteration. The solution was again dried at 55 °C on a rotary evaporator under reduced pressure to obtain a white solid. The sample was further dried by evacuating on a Schlenk line at 200 °C for 12 h to eliminate remaining heavy water and then ground to fine powders in a glove box (water content and oxygen content both below 0.1 ppm).
Water content determination
The water content of purified [Gdm-H][NfO] was found to be less than 2000 ppm by volumetric Karl Fischer titration (870 KF Titrino plus, Metrohm).Fourier transform infrared (FTIR) analysis
The FTIR spectra of the ([Gdm-H][NfO] and [Gdm-D][NfO]) powders at room temperature were recorded in the spectral range between 650 and 4000 cm−1 at a resolution of 4 cm−1 using an FTIR spectrometer (NEXUS, Thermo Nicolet) with a universal ATR accessory.Thermogravimetric analysis (TGA)
TGA measurements were performed on a STA 449 C Jupiter® simultaneous thermal analyzer (Netzsch). The sample was placed in an Al2O3 pan and heated from room temperature to 650 °C at a ramp of 5 °C min−1 in a nitrogen or air atmosphere (50 mL min−1). The onset temperature of mass loss was reported as the decomposition temperature (Td).Isothermogravimetric analysis (IGA) experiments were conducted on the same instrument under a nitrogen atmosphere (50 mL min−1) at 150, 225, 250 and 275 °C, respectively. The initial mass of each sample was controlled to be around 11.1 mg. Prior to each IGA measurement, each sample was heated from room temperature to the target temperatures at a heating rate of 20 °C min−1.
Differential scanning calorimetry (DSC)
DSC measurements were performed on a Pyris 1 Thermal Analysis System (PerkinElmer). Measurements were made between −100 °C and 200 °C at heating/cooling rates of 10, 15 and 20 °C min−1. Three consecutive runs were conducted for each heating/cooling rate, wherein the first two heating/cooling scans were performed to eliminate the thermal history effects.X-ray diffraction (XRD)
Temperature-dependent XRD measurements of fine powders of [Gdm-H][NfO] were performed from room temperature to 185 °C under vacuum on a powder X-ray diffractometer (X'Pert PRO DY2198, PANalytical) using Cu Kα radiation (λ = 1.5406 Å) to identify the solid–solid phase transitions. The sample was stabilized at each measurement temperature (accuracy: ±1 °C) for 2 min before each measurement. The measurement consisted of θ–2θ scan from 5° to 50° with a step size of 0.017° and a scan speed of 0.4° s−1.Nuclear magnetic resonance (NMR) measurements
NMR spectra were recorded on a Bruker Avance™ III 400 MHz spectrometer at room temperature. δH (400 MHz, DMSO-d6, δ/ppm): 6.88 (s, 6H, [C(NH2)3]+); δC (101 MHz, DMSO-d6, δ/ppm): 158.31. The concentration of the samples for 1H NMR tests was controlled to be the same for all measurements.Morphological observations
Polarized optical microscopy was used to confirm the solid-solid phase transitions or detect the possibility of partial melting via recording the morphological changes of fine powders of [Gdm-H][NfO] during the heating scan (5 °C min−1) from 35 °C to 190 °C. The fine powders were placed between two thin glass plates and then heated on a Linkam TMS 93 heating/cooling microscope stage (accuracy: ±0.1 °C) and focused on by an Olympus BX60 imaging microscope with a 10×/0.30 objective lens.Conductivity measurements
The temperature and frequency dependence of the dielectric permittivity (dielectric constant) of [Gdm-H][NfO] was studied using an Alpha-Analyzer high resolution dielectric analyzer in the frequency range of 100 mHz to 10 MHz with an AC voltage of 100 mV (Vrms). The material was placed in a stainless steel conductivity cell (diameter: 20 mm; thickness: 0.50 mm) and then heated to 200 °C to ensure complete filling of the cell. The dielectric measurements were started at 200 °C followed by cooling to −150 °C in steps of 2.5 °C at an initial rate of 10 °C min−1, and then subjected to temperature stabilization for 10 min. Afterwards, the sample was heated again from −150 °C to 200 °C and finally cooled down again to room temperature. The temperature was controlled by liquid nitrogen gas flow via the Novocontrol Quatro Cryosystem. By correlating the amplitude and phase of the current passing through the dielectric sample capacitor with the applied AC voltage, the Alpha-Analyzer can calculate the complex impedance and capacity. From these data, the complex conductivity and permittivity can be calculated, respectively. The conductivity was determined by a plateau in the conductivity vs. frequency plot, which lies in between the subdiffusive conductivity region and the electrode polarization region as discussed below.When measuring the ionic conductivity of ionic liquids as a function of AC-voltage frequency, there are three regions of the ionic conductivity, each of which reveals certain material and sample properties.13a At very high frequencies, the conductivity is dominated by the subdiffusive conductivity, as determined by the sample geometry, giving the appearance of very high conductivity. At the low frequency end, due to incomplete charge transfer between the electrode and the organic salt, the conductivity is hindered by the electric double layer13b as a result of an effect known as electrode polarization, where the sample appears to have a very low conductivity. It is in the intermediate region that we can find the true sample conductivity, where the conductivity is high compared to the capacitive conductivity and low when compared to the electric double layer conductivity. For more information on how the ionic conductivity should be determined, we refer the readers to our previous work.13a The conductivity contribution from the empty cell is subtracted using a simple parallel impedance model, yielding the final conductivity. These steps are applied at every measurement temperature.
Results and discussion
Infrared, thermal and structural analysis
NH2C(NH)NH2 is a very strong base with pKa = 13.6.14 Its great basicity has been explained by Pauling15 in terms of extra resonance stabilization energy of the guanidinium ion of about 25–42 kJ mol−1. The planarity of the CN3 skeleton corresponds to sp2 hybridization of the carbon atom.14 As shown in Fig. 1, the positive charge of guanidinium cation in the ground state is shared by the carbon atom and all three of the nitrogen atoms.16 Infrared analysis and NMR tests (Fig. 2 and S1†) confirm the completeness of the salt formation of [Gdm-H][NfO]. Clearly, [Gdm-H][NfO] (i.e. [C(NH2)3]+[n-C4F9SO3]−) was formed at the equimolar composition according to the following equation:| 2NH2C(NH)NH2·½H2CO3 + 2n-C4F9SO3H → 2[Gdm-H][NfO] + H2O + CO2↑ | (1) |
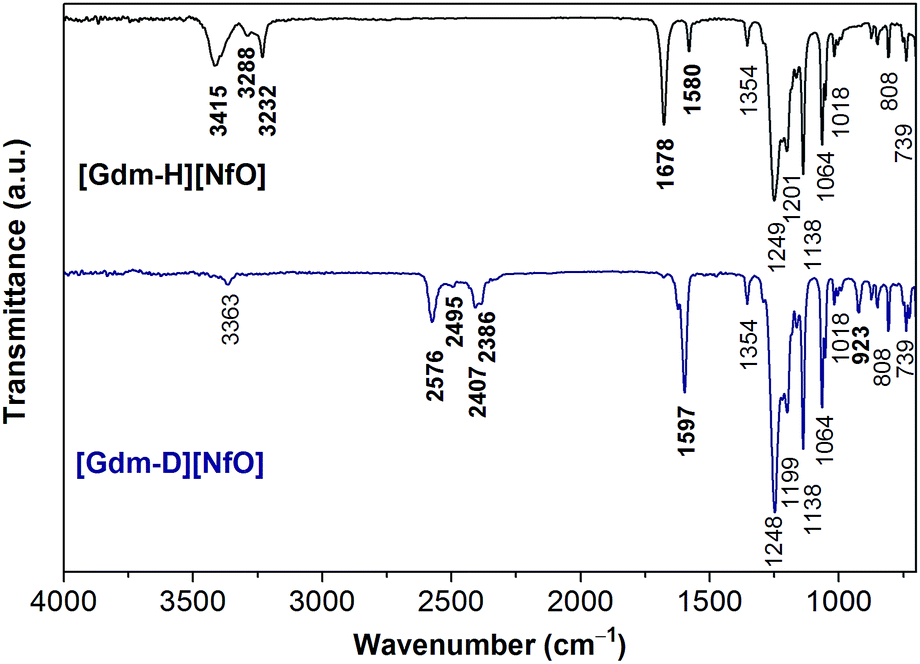 | ||
| Fig. 2 FTIR spectra of [Gdm-H][NfO] and [Gdm-D][NfO]. | ||
By comparing the FTIR spectra of [Gdm-H][NfO] and [Gdm-D][NfO] (Fig. 2) as well as guanidine carbonate (Fig. S2†) and 1,2,4-triazolium nonaflate,5a the peaks at 3415, 3288, 3232, 1678 and 1580 cm−1 are attributed to the guanidinium cations ([C(NH2)3]+)16 while the absorption bands at 1354, 1249, 1201, 1138, 1064, 1018, 808 and 739 cm−1 are associated with the nonaflate anions. In particular, for [Gdm-H][NfO], the peaks at 3415 cm−1 and 3288 and 3232 cm−1 are due to asymmetric and symmetric NH2 stretching vibrations, respectively.16,17 The broadening of the bands in the region of 3200–3500 cm−1 indicates the formation of a hydrogen bonding network.18 Moreover, the sharp absorption bands at around 1249 and 1201 cm−1 may correspond to the SO3 asymmetric stretching vibration.19,20 This spectral feature is characteristic of a sulfonate anion strongly involved in a hydrogen bond.20 The bands at 1678 cm−1 and 1580 cm−1 are assigned to the asymmetric CN3 degenerated stretching and the NH2 degenerated scissoring vibration, respectively.16 In addition, the complete removal of water and the absence of other –OH-containing species (e.g. sulfonic acid) were confirmed by the absence of the H–O–H bending band at around 1650 cm−1 and O–H stretching bands in the region of 3500–3800 cm−1 in the infrared spectra (Fig. 2).
Upon deuteration of [Gdm-H][NfO], considerably different spectra were obtained for deuterated guanidinium cations in [Gdm-D][NfO] while the frequencies of the bands assigned to nonaflate anions remained the same (Fig. 2). The bands associated with guanidinium cations are greatly red-shifted. For [Gdm-D][NfO], the peaks at 2576 cm−1 and 2407 and 2386 cm−1 correspond to the asymmetric and symmetric ND2 stretching vibrations, respectively.16 It is assumed that the stretching frequencies of the N–H and N–D bonds can be approximated by Hooke's law:21
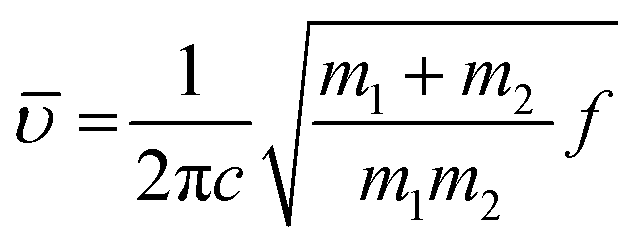 | (2) |
![[small upsilon, Greek, macron]](https://www.rsc.org/images/entities/i_char_e0d5.gif) is the wavenumber (cm−1), c the velocity of light (cm s−1), m1 and m2 the mass of atoms 1 and 2, respectively, in g, and f the force constant of the bond (dyne cm−1). Using eqn (2) the ratio of the N–D stretching frequency vs. the N–H stretching frequency is calculated to be 0.730. The experimental values of the ratio are 2576 cm−1/3415 cm−1 = 0.754, 2407 cm−1/3288 cm−1 = 0.732, and 2386/3232 = 0.738, respectively, which agree well with the calculated value. In addition, the bands at 1597 cm−1 and 923 cm−1 are assigned to the asymmetric CN3 degenerated stretching and ND2 rocking, respectively.16 Interestingly, it seems that the NH2 degenerated scissoring vibration at 1580 cm−1 was red-shifted to a wavenumber of 1163 cm−1 (corresponding to ND2 degenerated scissors16) and meanwhile the NH2 rocking vibration in the vicinity of 1163 cm−1 is red-shifted to 923 cm−1 after deuteration.16 Particularly, the weak absorption bands at 3363 and 2495 cm−1 may represent the N–H and N–D stretching vibrations of the residual NHD groups in the form of [C(ND2)2(NHD)]+ ions, respectively.14 Therefore, the deuterated product [Gdm-D][NfO] obtained in this work is actually a mixture of [C(ND2)3]+[n-C4F9SO3]− and [C(ND2)2(NHD)]+[n-C4F9SO3]−.
is the wavenumber (cm−1), c the velocity of light (cm s−1), m1 and m2 the mass of atoms 1 and 2, respectively, in g, and f the force constant of the bond (dyne cm−1). Using eqn (2) the ratio of the N–D stretching frequency vs. the N–H stretching frequency is calculated to be 0.730. The experimental values of the ratio are 2576 cm−1/3415 cm−1 = 0.754, 2407 cm−1/3288 cm−1 = 0.732, and 2386/3232 = 0.738, respectively, which agree well with the calculated value. In addition, the bands at 1597 cm−1 and 923 cm−1 are assigned to the asymmetric CN3 degenerated stretching and ND2 rocking, respectively.16 Interestingly, it seems that the NH2 degenerated scissoring vibration at 1580 cm−1 was red-shifted to a wavenumber of 1163 cm−1 (corresponding to ND2 degenerated scissors16) and meanwhile the NH2 rocking vibration in the vicinity of 1163 cm−1 is red-shifted to 923 cm−1 after deuteration.16 Particularly, the weak absorption bands at 3363 and 2495 cm−1 may represent the N–H and N–D stretching vibrations of the residual NHD groups in the form of [C(ND2)2(NHD)]+ ions, respectively.14 Therefore, the deuterated product [Gdm-D][NfO] obtained in this work is actually a mixture of [C(ND2)3]+[n-C4F9SO3]− and [C(ND2)2(NHD)]+[n-C4F9SO3]−.
Furthermore, based on the FTIR data, the deuteration percentage (percentage of deuterium substitution) of [Gdm-D][NfO] was calculated to be 92.0%. This value was calculated as follows: (i) firstly, the area of the absorption peak at 1354 cm−1 attributed purely to nonaflate anions and the area of absorption peak attributed to NH stretching vibrations in the region of 3175–3500 cm−1 before and after deuteration were integrated respectively; (ii) secondly, the area of the absorption peak attributed to the NH stretching vibrations was divided by the corresponding area of the absorption peak at 1354 cm−1 before and after deuteration; (iii) thirdly, the “normalized” area of the absorption peak attributed to the NH stretching vibration after deuteration was divided by the corresponding “normalized” area before deuteration, resulting in a ratio; (iv) finally, deuteration percentage is equal to (1 − ratio) × 100%.
Meanwhile, as shown in the 1H-NMR spectra of [Gdm-H][NfO] and [Gdm-D][NfO] (Fig. S1†), the signals of the acidic hydrogens arise at 6.88 ppm (C–NH2) in [Gdm-H][NfO] and 6.89 ppm (C–NHD) in [Gdm-D][NfO]. From the relative integrated areas of the peaks for acidic hydrogens vs. the corresponding peak area at ∼2.50 ppm (solvent DMSO-d6), the deuteration percentage of the acidic hydrogens in [Gdm-D][NfO] was estimated to be about (14.46–1.02)/14.46 × 100% = 92.9%. Clearly, the FTIR spectra and 1H NMR spectra are in good agreement for the determination of deuteration percentage. As 1 − 92% = 0.08 ≈ 1/2 × 1/6, it was further concluded that the molar ratio of [C(ND2)2(NHD)]+[n-C4F9SO3]−vs. [C(ND2)3]+[n-C4F9SO3]− in as-prepared [Gdm-D][NfO] is around 1:1 (Fig. 3).
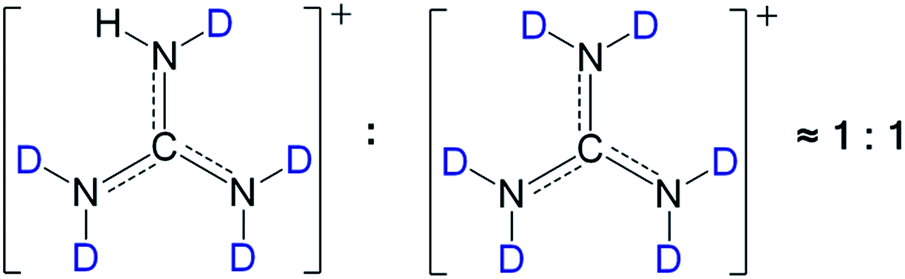 | ||
| Fig. 3 The speculated molar ratio of [C(ND2)2(NHD)]+vs. [C(ND2)3]+ in deuterated guanidinium cations of [Gdm-D][NfO] is around 1:1. | ||
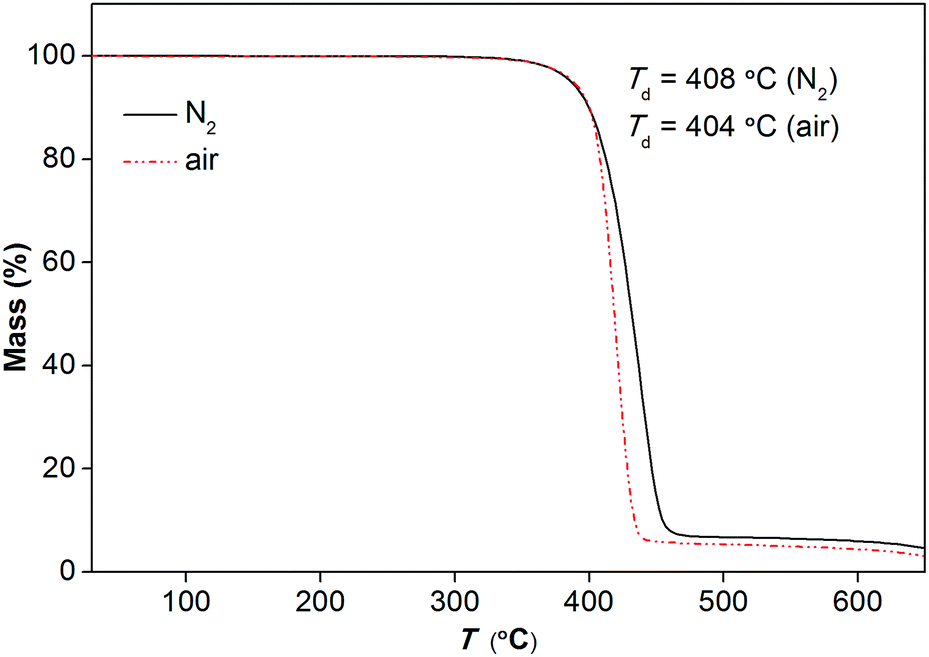
Fig. 4 represents the TGA traces of [Gdm-H][NfO] in nitrogen and air atmospheres at a heating rate of 5 K min−1, respectively. It shows that [Gdm-H][NfO] has a high thermal stability with a one-step weight loss event and a Td as high as 408 °C in a nitrogen atmosphere. The TGA trace in air atmosphere confirms the thermooxidative stability of [Gdm-H][NfO] (Td = 404 °C). The gas atmosphere seems to have little influence on the thermal stability of the protic salt.
 | ||
| Fig. 4 TGA traces of [Gdm-H][NfO] in nitrogen gas and air, respectively. Heating rate: 5 °C min−1; gas flow rate: 50 mL min−1; mass of sample: 16.850 mg (nitrogen gas) and 16.630 mg (air). | ||
Furthermore, isothermogravimetric analysis (IGA) performed at 150 °C (Fig. 5) indicates that [Gdm-H][NfO] shows superior thermal stability and negligible vapor pressure compared with model organic molecular proton conductors like imidazole (Tmp = 89 °C, Tbp = 256 °C) and 1H-1,2,4-triazole (Tmp = 120 °C, Tbp = 260 °C),5a,22 as well as conventional electrolytes like Nafion® membranes11a and 85% H3PO4.23 The negligible volatility of [Gdm-H][NfO] as a solid-state proton conductor makes it a better candidate than molecular species for long-term device use. To quantify the volatility of [Gdm-H][NfO], IGA tests were also carried out at three other discrete temperatures well below Td: 225, 250 and 275 °C. These temperatures were chosen because [Gdm-H][NfO] is chemically stable and exhibits measurable weight losses in this regime. As can be seen in Fig. 5, the IGA mass loss curves are all linear. Clearly, the higher the temperature, the faster the mass loss. The high linearity associated with the IGA curves reveals pseudo-zero-order mass loss kinetics, providing strong evidence that the observed decrease in mass over time at constant temperature results from vaporization of the protic salt itself rather than evolution of thermal degradation products or impurities.24,25
 | ||
| Fig. 5 Isothermogravimetric analysis of [Gdm-H][NfO] at four discrete temperatures under nitrogen purge (50 mL min−1). Mass loss rate (expressed as the change in mass percent with time, dα/dt = (dm/dt)/m0, where m0 is the initial mass): dα/dt = 0.00138% min−1 at T = 225 °C (R2 = 0.96694); dα/dt = 0.00383% min−1 at T = 250 °C (R2 = 0.99623); dα/dt = 0.01932% min−1 at T = 275 °C (R2 = 0.99976). Note that dm/dt = m0(dα/dt). The initial mass of each sample was controlled to be about 11.1 mg. | ||
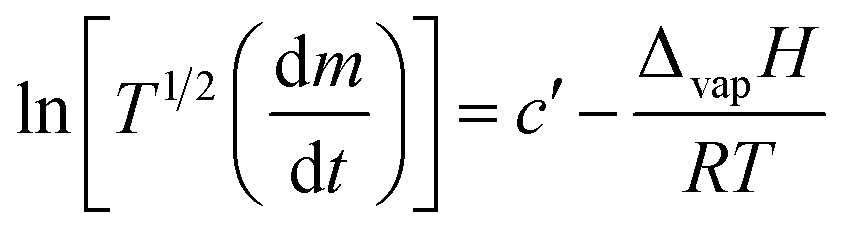
Based on the linear (zero-order) evaporative mass losses for [Gdm-H][NfO], an enthalpy of vaporization, ΔvapH, of 120.9 kJ mol−1 was estimated (Fig. 6), using the following regression equation derived from the Clausius–Clapeyron relationship:24
 | (3) |
 | ||
| Fig. 6 Temperature dependence of the mass loss for [Gdm-H][NfO] based on the IGA results shown in Fig. 5. Such a plot yields a slope of −ΔvapH/(1000R), where ΔvapH is the enthalpy of vaporization, R is the universal gas constant, and k equals to dm/dt = m0(dα/dt), which is the rate of mass loss per unit area shown in eqn (3). Correlation coefficient (R2): 0.95053. | ||
Furthermore, the high thermal stability can be correlated with ΔpKa, which denotes the difference in aqueous solution pKa values for the constituent base and acid of the protic salt. The pKa value of n-C4F9SO3H can be estimated to be the same as that of CF3SO3H (pKa = −13).5a,26 Since the reported pKa value of guanidine is 13.6,14,27 ΔpKa of the protic salt [Gdm-H][NfO] is estimated to be 26.6, suggesting the complete proton transfer from n-C4F9SO3H to guanidine (ΔpKa > 10),28 leading to the superior thermal stability, low volatility and high ΔvapH of [Gdm-H][NfO]. In addition to the superior thermal stability of [Gdm-H][NfO], guanidinium cations and perfluorobutanesulfonate anions have been reported to exhibit adequate electrochemical stability on platinum working electrodes for fuel cells.12a,29
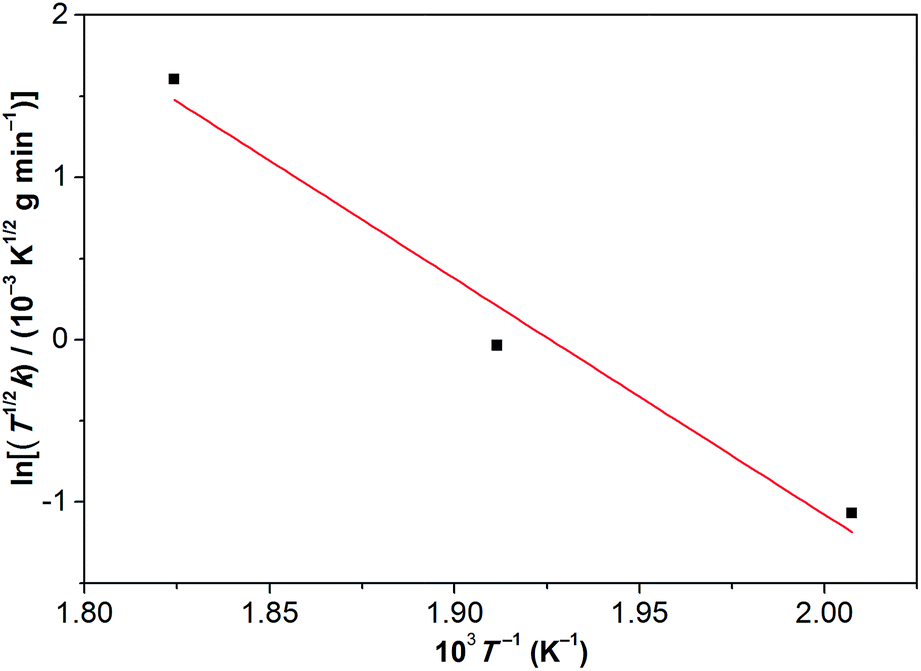
The structural phase transitions of [Gdm-H][NfO] accompanied by thermodynamic anomalies were revealed by DSC measurements (Fig. 7, S5 and S6†). During the heating scan in the DSC measurements recorded at 15 °C min−1 (Fig. 7), five distinct endothermic transitions were observed at 71.8 °C, 87.8 °C, 117.6 °C, 141.9 °C and 186.2 °C, respectively, with the last temperature corresponding to the melting point of [Gdm-H][NfO]. Onset temperatures (T), enthalpy changes (ΔH) and entropy changes (ΔS) of the main phase transitions of [Gdm-H][NfO] are summarized in Table 1. The entropy of fusion, ΔSf, at the melting point of 186.2 °C was calculated to be as low as 17.70 J K−1 mol−1 (ΔSf = ΔHf/Tm), which is much smaller than ΔSf of many reported OIPCs5a,11a,12,30 (e.g. 46.0 J K−1 mol−1 for 1,2,4-triazolium nonaflate5a and 62.8 J K−1 mol−1 for guanidinium triflate12) and is even in line with Timmerman's criterion for molecular plastic crystals (ΔSf < 20 J K−1 mol−1).31 The low entropy of fusion is attributed to the multiple endothermic transitions prior to melting, which are associated with solid-solid phase transitions and onset of ion rotations or reorientations,5a,8,9 resulting in a large extent of orientational freedom and hence greatly increased disorder in the high temperature plastic crystalline phase. Consequently, the majority of the entropy changes are released prior to the melting transition, leading to a low entropy of fusion. Likely, both the cations and anions are highly disordered in phase I, indicating high ionic conductivity in phase I.
 | ||
| Fig. 7 DSC thermograms of [Gdm-H][NfO] in the form of fine powders measured at 15 °C min−1 for both the heating and cooling scans. The onset temperatures and entropy changes for each phase transition during the heating scan are given. Each solid phase is labeled by Roman numerals with the highest temperature solid phase denoted by phase I. The melt phase is also indicated. The peak temperature of melting is 190 °C. | ||
| Phase transition | T/°C | ΔH/kJ mol−1 | ΔS/J K−1mol−1 |
|---|---|---|---|
| V → IV | 71.8 | 2.69 | 7.79 |
| IV → III | 87.8 | 0.91 | 2.53 |
| III → II | 117.6 | 1.77 | 4.52 |
| II → I | 141.9 | 8.22 | 19.81 |
| I → melt | 186.2 | 8.13 | 17.70 |
The entropy changes (ΔS) of phase transitions of V → IV, IV → III, III → II, and II → I are 7.79, 2.53, 4.52, and 19.81 J K−1 mol−1, respectively. Assuming that the configurational entropy is the most dominant contribution for solid-solid phase transitions, the entropy change can be approximated according to Boltzmann's equation:
| ΔS = R × ln(n1/n2) | (4) |
To clarify whether these phase transitions are first-order, DSC measurements at three different heating/cooling rates were performed (Fig. 7, S5 and S6†). The reversible heat anomalies at 71.8 °C/69.6 °C, 117.6 °C/114.1 °C, and 141.9 °C/139.0 °C (on heating/cooling shown in Fig. 7) display well-shaped peaks and temperature hysteresis. For the phase transition of III → II, the limiting temperature hysteresis estimated from the scans extrapolated to a scanning rate of 0 °C min−1 is 3.13 °C (Fig. S7†) and far greater than 0 °C, indicating a first-order solid-solid phase transition. Similarly, the limiting temperature hysteresis for the phase transition of II → I at a scanning rate of 0 °C min−1 is 2.30 °C (Fig. 8), demonstrating again a first-order phase transition. The phase transition of V → IV also seems to be a first-order phase transition. In addition, it is worth mentioning that the “λ” shape of the weak anomaly peak happening well ahead of the phase transition of V → IV (Fig. 7, S5 and S6†) resembles the features of a second-order phase transition, like that of triglycine sulfate.35 Furthermore, polarized optical microscopic observations exclude the possibility of partial melting of [Gdm-H][NfO] during the solid–solid phase transitions of V → IV, IV → III, III → II and II → I (Fig. S8–S10†) while it detects partial melting shortly before the phase transition of phase I → melt (Fig. 7, S11–S13†), which will be discussed later on.
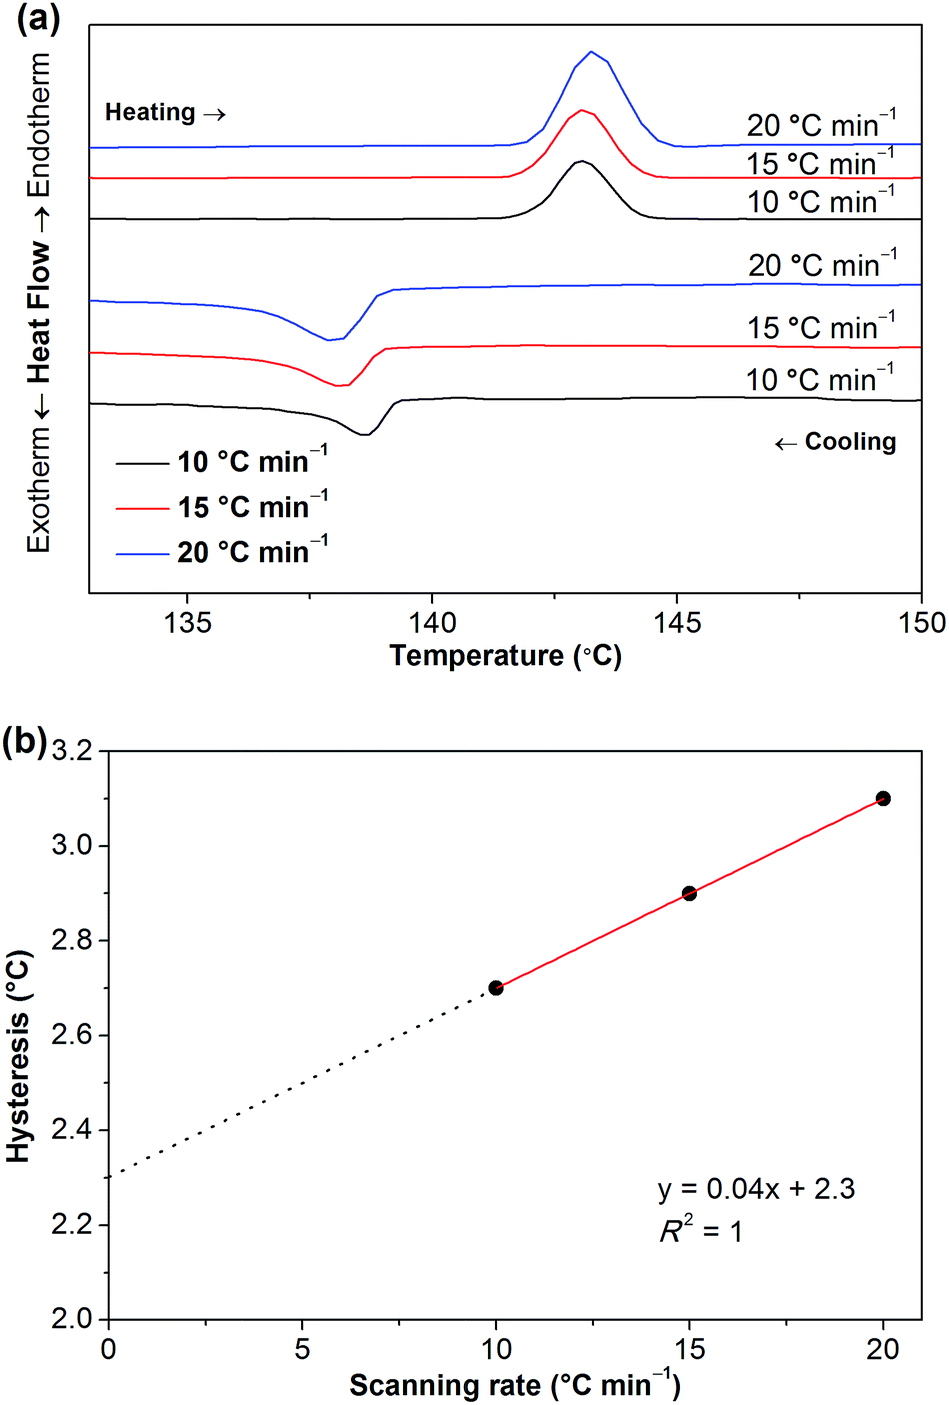 | ||
| Fig. 8 (a) DSC curves of [Gdm-H][NfO] at different heating/cooling rates showing in particular the phase transition of II → I during the heating scan and the reverse phase transition during the cooling scan; (b) the corresponding limiting temperature hysteresis (2.30 °C) estimated from the scans extrapolated to a scanning rate of 0 °C min−1, demonstrating a first-order solid-solid phase transition. Correlation coefficient (R2): 1. | ||
During the cooling scan, [Gdm-H][NfO] crystallizes at around 185.1 °C with a sudden release of latent heat, which is similar to the behavior of some reported plastic crystals.5a,36
To further investigate the phase transitions as shown in the DSC trace (Fig. 7), fine powders of [Gdm-H][NfO] were heated under vacuum from 25 °C to 185 °C and the structural features were monitored by temperature-dependent powder XRD. As shown in Fig. 9, several diffraction peaks disappear or appear during these endothermic transitions. When the sample was heated from 25 °C to 86 °C, the powder XRD patterns were basically the same. From 86 °C to 89 °C, a new diffraction peak appears at 2θ = 10.5°, which becomes more and more evident as the temperature increases to 185 °C, confirming the solid-solid phase transition of IV → III at 87.8 °C. From 113 °C onwards, a new reflection appears at 2θ = 5.2°, which also becomes a major reflection at 185 °C in the high temperature plastic crystalline phase (phase I) and is in accordance with the solid-solid phase transition of III → II at 117.6 °C. From 119 °C to 143 °C, a number of minor diffraction peaks (e.g. 2θ = 5.7°, 8.6°, 9.9°, 11.5°, 14.9° and 19.9°) vanish gradually and meanwhile a new diffraction peak appears at 2θ = 21.4°, agreeing well with the phase transition of II → I at 141.9 °C and the relatively large entropy change of 19.81 J K−1 mol−1. This indicates a transformation between two different crystalline structures and likely an increase in symmetry. The slight difference in onset temperatures of lattice transformation and thermal transition should be related to the different heating methods for powder XRD and DSC measurements.5a,11a
 | ||
| Fig. 9 Powder XRD patterns of [Gdm]][NfO] as a function of temperature, demonstrating structural changes with increasing temperature. | ||
From 143 °C to 180 °C, the powder XRD patterns were similar except that some weak reflections appear or disappear during this process. Furthermore, the baselines for the powder XRD patterns are relatively flat in the higher angle diffraction region at all temperatures, indicating a high level of crystallinity in [Gdm-H][NfO].37 Compared with the powder XRD patterns of the lower temperature phases, the powder XRD patterns of phase I are simpler, implying a crystal lattice of higher symmetry.5a,11a,32a,36a In fact, the reduction of the number of diffraction peaks in phase I indicates the presence of stronger dynamic rotational disorder which leads to the plastic properties, low entropy of fusion (Fig. 7), and significant ionic conductivity (Fig. 10). Therefore, powder XRD measurements reveal that [Gdm-H][NfO] exhibits short-range disorder and long-range positional order in the high-temperature plastic crystalline phase.
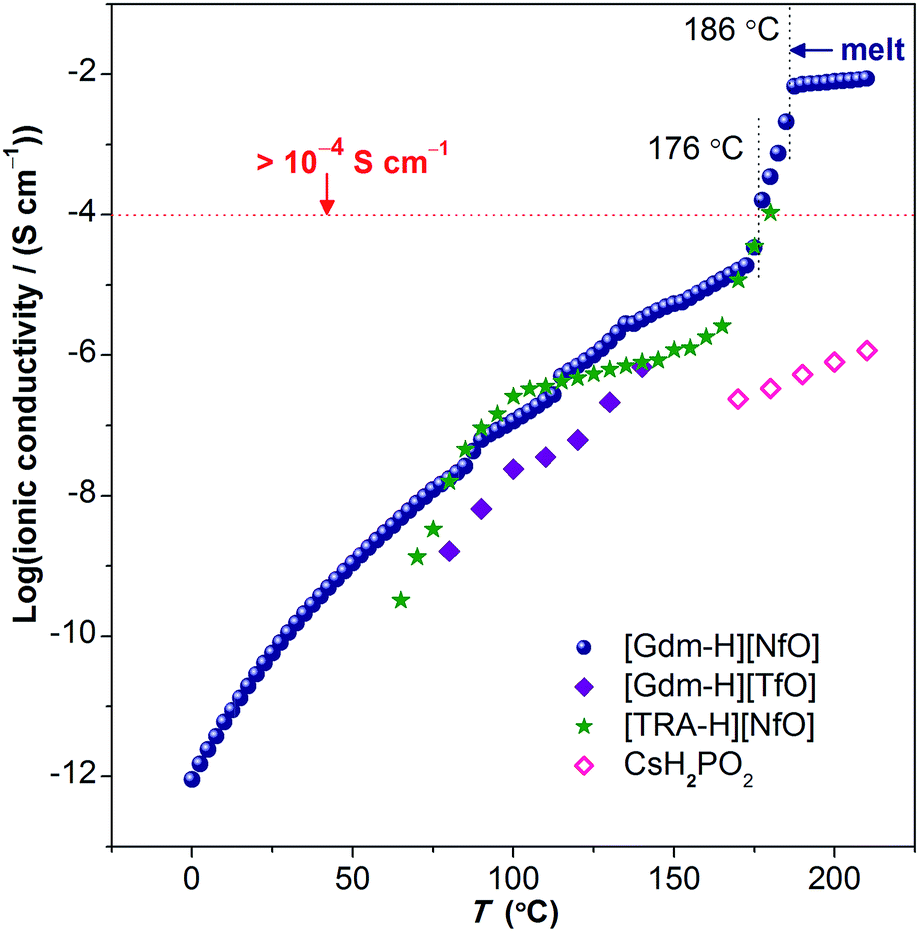 | ||
| Fig. 10 Ionic conductivity of [Gdm-H][NfO] as a function of temperature. Above 176 °C where partial melting happens, the ionic conductivity exceeds 1 × 10⁻⁴ S cm−1 (0.1 mS cm−1) prior to the melting transition at 186.2 °C and is marked by dotted vertical lines. The solid navy balls represent the ionic conductivity of [Gdm-H][NfO] derived via dielectric measurements. For comparison, the ionic conductivities of other solid-state proton conductors (in the form of pressed pellets), such as guanidinium triflate ([Gdm-H][TfO]),12b 1,2,4-triazolium nonaflate ([TRA-H][NfO]),5a and CsH2PO4 (measured under humidified air with a constant water content of 12 mol%, i.e. P(H2O) = 0.12 atm),41 are shown. | ||
From 180 °C to 185 °C, some diffraction peaks (e.g. 2θ = 5.2°, 10.5°, 15.8°, 21.1° and 26.5°) become sharper and more intense while some diffraction peaks disappear (e.g. 2θ = 13.7°, 18.7° and 20.2°). However, based on polarized optical microscopic observations, during the heating scan from 173 °C to 185 °C (Fig. S11–S13†), some crystals begin to melt, corresponding well to the relatively broad and less symmetrical melting peak rather than a sharp transition observed in DSC thermograms (Fig. 7), although the oneset temperature and peak temperature of melting are 186.2 °C and 190 °C, respectively. In particular, some single crystals are observed to swim in a melt (Fig. S12 and S13†), indicating clearly partial melting. Currently, we are not clear about the mechanism of partial melting. It is speculated that a tiny trace of impurities (e.g. CO32−, Cl−, SO42− and Na+ from the starting materials) may lead to partial melting of [Gdm-H][NfO]. Further work on the mechanism will be explored in our labs.
Ionic conductivity
The temperature dependence of the anhydrous ionic conductivity of [Gdm-H][NfO] was derived via dielectric measurements (Fig. 10). Both temperature-dependent ionic conductivity (Fig. 10 and 11) and powder XRD measurements (Fig. 9) show no evident change for the phase transformation of V → IV at 71.8 °C (Fig. 7). As the temperature increases, obvious jumps in the ionic conductivity are observed at 88 °C, 114 °C and 136 °C, agreeing well with the phase transitions of IV → III, III → II and II → I as shown in the DSC trace (Fig. 7) and variable temperature powder XRD measurement results (Fig. 9).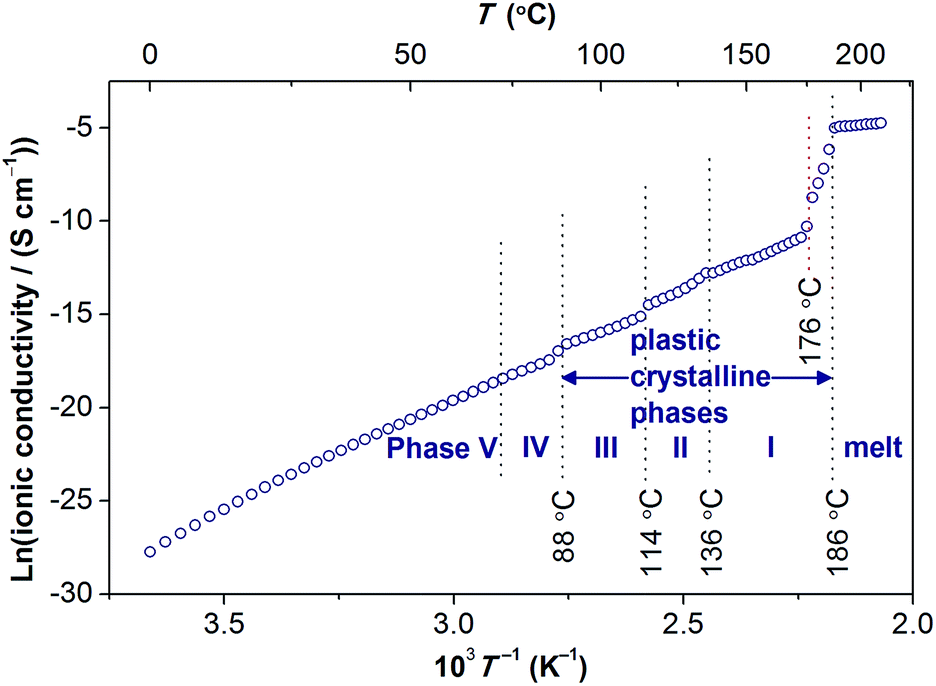 | ||
| Fig. 11 Arrhenius plot for the ionic conductivity of [Gdm-H][NfO]. | ||
Above 176 °C, the solid-state ionic conductivity exceeds 1 × 10⁻⁴ S cm−1 prior to its melting transition at around 186.2 °C, which is correlated with the accompanied partial melting in this temperature region (Fig. S12 and S13†). The anhydrous ionic conductivity even reaches 2.1 × 10⁻³ S cm−1 at 185 °C, which is comparable to the ionic conductivity of one of the state-of-the-art hydrated metal–organic framework (MOF) based proton conductors (3.9 × 10⁻³ S cm−1 at 98% relative humidity at 25 °C).38 However, this region is actually a non-equilibrium process with the sample melting continuously in the temperature range of 176–186 °C. Consequently, more cations and anions become ‘free’ and contribute to the ionic conductivity, and thereby the ionic conductivity shows a drastic increase.
Remarkably, in the temperature window between 75 °C and 172.5 °C, the measured ionic conductivity of [Gdm-H][NfO] is about one order of magnitude higher than that of pure guanidinium triflate ([Gdm-H][TfO])12b in the solid state. In addition, in the high-temperature plastic crystalline phase, [Gdm-H][NfO] also shows superior ionic conductivity compared with 1,2,4-triazolium nonaflate.5a This is correlated with the significantly lower ΔSf of [Gdm-H][NfO] compared with the two structurally similar analogues, which are also POIPCs, indicating the significance of both cation and anion in the ion-conducting behavior of POIPCs. Noticeably, pure, highly ion-conductive POIPCs like [Gdm-H][NfO] obviate the shortcomings of doped plastic crystals (including POIPCs),5a,12,39,40 such as the need for dopants, the risk of acid leaching and corrosion, insufficient thermal stability, and the possible incompatability of dopants with plastic crystal matrices. In addition, [Gdm-H][NfO] exhibits superior ionic conductivity compared with the inorganic proton conductor CsH2PO4 measured under humidified air with a constant water content of 12 mol%.41
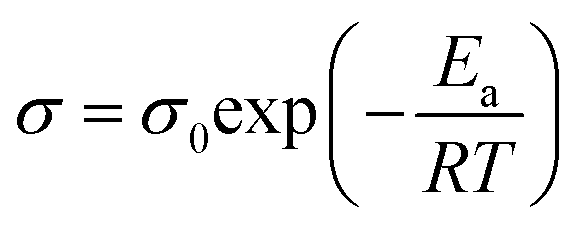
To further analyze the ion-conducting behavior of [Gdm-H][NfO], the Arrhenius plot of the ionic conductivity of [Gdm-H][NfO] is given in Fig. 11. The activation energy for each phase is calculated using the Arrhenius equation:
 | (5) |
The fitting results are listed in Table 2. Overall, Ea decreases when [Gdm-H][NfO] is heated through each phase transition, which is in line with the same trend observed in 1,2,4-triazolium nonaflate,5a imidazolium methanesulfonate11a and some aprotic OIPCs,30b,42 reflecting the phase-dependent transport properties of [Gdm-H][NfO]. In phase V and IV, [Gdm-H][NfO] has a low ionic conductivity ranging from 1 × 10⁻¹² S cm−1 to 2.6 × 10⁻⁸ S cm−1 and exhibiting a strong temperature dependence as the movement of ions is highly restricted in the relatively rigid lattice. Based on the high value of Ea (96.5 kJ mol−1, i.e. 1.00 eV) and the low ionic conductivity, the mechanism for ion conduction in the ordered crystalline phase V is speculated to be lattice self-diffusion.8 As mentioned previously, after the solid-solid phase transitions happening at 88 °C, 114 °C and 136 °C successively, the ionic conductivity exceeds 6 × 10⁻⁸ S cm−1, 5 × 10⁻⁷ S cm−1 and 2.8 × 10⁻⁶ S cm−1, respectively, corresponding to the observed change of the crystalline structure of [Gdm-H][NfO] with the ions becoming more and more disordered (Fig. 9). Higher ionic conductivities in more disordered phases are considered to be associated with the ionic axial rotation and self-diffusion.43
| Phase | T/°C | E a/kJ mol−1 | σ 0/S cm−1 | R 2 |
|---|---|---|---|---|
| a R 2: correlation coefficient. b Gradual change region of phase I. | ||||
| V & IV | 0–85 | 96.5 (1.00 eV) | 1.01 × 10⁶ | 0.9972 |
| III | 90–112.5 | 75.2 (0.780 eV) | 4.02 × 10³ | 0.9961 |
| II | 115–135 | 110.9 (1.15 eV) | 3.87 × 10⁸ | 0.9808 |
| Ib | 137.5–172.5 | 80.9 (0.839 eV) | 5.39 × 10⁴ | 0.9915 |
| Melt | 187.5–210 | 19.1 (0.198 eV) | 1.01 | 0.9814 |
Furthermore, the Grotthuss mechanism (proton hopping or structural diffusion) and the vehicle mechanism are the two main mechanisms used in the literature for interpreting the proton conduction in solid compounds.44 The transport of larger ionic species (with greater mass compared to H+) requires a larger energy contribution, and as such processes with Ea > 0.4 eV generally refer to the vehicle mechanism.45 As the activation energies (Table 2) for the temperature dependence of ionic conductivity in phase III, phase II and phase I are 75.2 kJ mol−1 (0.780 eV), 110.9 kJ mol−1 (1.15 eV) and 80.9 kJ mol−1 (0.839 eV), respectively, it is speculated that the vehicle mechanism is the underlying conduction mechanism in these plastic crystalline phases (Fig. 11). This speculation is in agreement with the NMR experimental results for guanidinium triflate where proton hopping was not observed in neat guanidinium triflate.12a As the guanidinium cation is smaller, has a high symmetry and has a smaller inertia momentum than the large nonaflate anion, it is very likely that mainly the guanidinium cations are orientationally or rotationally disordered in the plastic crystalline phases of [Gdm-H][NfO], resulting in great cationic motions to favor proton conduction. When the temperature further increases in phase I to above 173 °C, a linear and steep increase of the ionic conductivity is observed between 176 °C and 186 °C, which should be largely due to the onset of partial melting (Fig. S12 and S13†).
In the molten state, the activation energy for ion conduction is as low as 19.1 kJ mol−1 (0.198 eV). While the vehicle mechanism46 is expected to contribute to the proton conduction in the molten state of [Gdm-H][NfO] with the guanidinium cation as a vehicle,11a,18e the Grotthuss mechanism (structural diffusion) is postulated to contribute to the proton conduction involving hydrogen bonds between the cation and the anion as the temperature dependence of ionic conductivity exhibits an Arrhenius behavior (Fig. 11). As firstly proposed by Angell et al.,27 the proton conduction behavior of guanidinium salt melts may be influenced by a population of protons that have the freedom to move between cations via temporary occupation of sites on the anion (transient reformation of the original proton donor acid), or in a transient dianion [XHX]−. The transient dianion path, which should be of lower energy, can be represented by the following reaction sequence:27
| [C(NH2)3]+ + 2X− → NH2C(NH)NH2 + [XHX]− → [C(NH2)3]+ + 2X− | (6) |
Conclusions
Protic organic ionic plastic crystals (POIPCs) are promising solid-state proton conductors. As a special mesophase, their isotropy happens before their transition into a molten state. With guanidinium nonaflate ([Gdm-H][NfO]) as an example, we show that solid-state proton conductors based on POIPCs can be achieved via appropriate molecular design involving symmetrical ions. Differential scanning calorimetry and variable-temperature powder X-ray diffraction measurements together reveal the presence of plastic crystalline phases in the temperature range between 88 °C and 185 °C. As expected, [Gdm-H][NfO] exhibits a short-range disorder and a long-range positional order in the plastic crystalline phases. Above 176 °C, the ionic conductivity of [Gdm-H][NfO] exceeds 1 × 10⁻⁴ S cm−1 prior to its melting point at 186.2 °C. In the high temperature plastic crystalline phase, the elegant symmetrical guanidinium cations of [Gdm-H][NfO] seem to rotate freely, leading to a simpler crystal structure of higher symmetry and fast ion conduction. The vehicle mechanism is assumed to be the underlying conduction mechanism in the plastic crystalline phases of [Gdm-H][NfO]. In the molten state, the proton conduction is proposed to occur via both the vehicle mechanism and the Grotthuss mechanism (structural diffusion). Due to the exceptional physicochemical properties such as high thermal stability, negligible volatility, non-flammability, no leakage, high electrochemical stability, high anhydrous proton conductivity, and wide plastic crystalline phases, POIPCs like [Gdm-H][NfO] are attractive electrolytes for high temperature (100–200 °C) proton exchange membrane fuel cells (PEMFCs), in particular, all-solid-state high temperature PEMFCs. In addition to its role as a dopant to replace H3PO4 for state-of-the-art membrane matrices, [Gdm-H][NfO] may also function as a solid-state matrix for acids to develop more conductive proton conductors. It is anticipated that POIPC-based fast solid-state proton conductors will also find applications in sensors and other electrochemical devices. Further work on [Gdm-H][NfO] (e.g. demonstration in practical fuel cells) is in progress in our labs. It is noteworthy that poly(ionic liquid)s offer promising membrane matrices for solid-state proton conductors.47Acknowledgements
J. L. acknowledges the Research Foundation – Flanders (FWO) for a Postdoctoral Fellowship (12F5514N), a Research Grant (Project number: 1529816N) and a travel grant (V410316N) for a Visiting Professorship in the Technical University of Denmark. This work is financially supported by the National Natural Science Foundation of China (No. 51472187, 51272200). Financial support from China Fund KU Leuven (ISP/13/02SJT) is acknowledged. We would like to thank Dr Qing-An Chen (Technische Universität Berlin) for technical discussions on NMR. J. L. appreciates comments from Prof. Dr Douglas R. MacFarlane (Monash University) and Dr Olaf Conrad (SCHMID Energy Systems, Germany).Notes and references
- (a) B. Yi, Fuel Cells—Principle, Technology and Application, Chemical Industry Press, Beijing, 2003 Search PubMed; (b) H. A. Gasteiger and N. M. Marković, Science, 2009, 324, 48 CrossRef CAS PubMed; (c) M. K. Debe, Nature, 2012, 486, 43 CrossRef CAS PubMed; (d) H. Tang, Y. Zeng, D. Liu, D. Qu, J. Luo, K. Binnemans, D. E. De Vos, J. Fransaer, D. Qu and S.-G. Sun, Nano Energy, 2016, 26, 131 CrossRef CAS.
- (a) J. Zhang, Z. Xie, J. Zhang, Y. Tang, C. Song, T. Navessin, Z. Shi, D. Song, H. Wang, D. P. Wilkinson, Z. Liu and S. Holdcroft, J. Power Sources, 2006, 160, 872 CrossRef CAS; (b) Q. Li, J. O. Jensen, R. F. Savinell and N. J. Bjerrum, Prog. Polym. Sci., 2009, 34, 449 CrossRef CAS; (c) A. Chandan, M. Hattenberger, A. El-kharouf, S. Du, A. Dhir, V. Self, B. G. Pollet, A. Ingram and W. Bujalski, J. Power Sources, 2013, 231, 264 CrossRef CAS.
- J. S. Wainright, J.-T. Wang, D. Weng, R. F. Savinell and M. Litt, J. Electrochem. Soc., 1995, 142, L121 CrossRef CAS.
- (a) S.-Y. Lee, A. Ogawa, M. Kanno, H. Nakamoto, T. Yasuda and M. Watanabe, J. Am. Chem. Soc., 2010, 132, 9764 CrossRef CAS PubMed; (b) J. S. Lee, T. Nohira and R. Hagiwara, J. Power Sources, 2007, 171, 535 CrossRef CAS; (c) F. Endres and S. Z. E. Abedin, Phys. Chem. Chem. Phys., 2006, 8, 2101 RSC; (d) M. Armand, F. Endres, D. R. MacFarlane, H. Ohno and B. Scrosati, Nat. Mater., 2009, 8, 621 CrossRef CAS PubMed.
- (a) J. Luo, A. H. Jensen, N. R. Brooks, J. Sniekers, M. Knipper, D. Aili, Q. Li, B. Vanroy, M. Wübbenhorst, F. Yan, L. Van Meervelt, Z. Shao, J. Fang, Z.-H. Luo, D. E. De Vos, K. Binnemans and J. Fransaer, Energy Environ. Sci., 2015, 8, 1276 RSC; (b) S. M. Haile, D. A. Boysen, C. R. I. Chisholm and R. B. Merle, Nature, 2001, 410, 910 CrossRef CAS PubMed; (c) D. A. Boysen, T. Uda, C. R. I. Chisholm and S. M. Haile, Science, 2004, 303, 68 CrossRef CAS PubMed; (d) J. A. Hurd, R. Vaidhyanathan, V. Thangadurai, C. I. Ratcliffe, I. L. Moudrakovski and G. K. H. Shimizu, Nat. Chem., 2009, 1, 705 CrossRef CAS PubMed.
- (a) D. R. MacFarlane, J. H. Huang and M. Forsyth, Nature, 1999, 402, 792 CrossRef CAS; (b) Y. Abu-Lebdeh, A. Abouimrane, P.-J. Alarco, A. Hammami, L. Ionescu-Vasii and M. Armand, Electrochem. Commun., 2004, 6, 432 CrossRef CAS; (c) P.-J. Alarco, Y. Abu-Lebdeh, A. Abouimrane and M. Armand, Nat. Mater., 2004, 3, 476 CrossRef CAS PubMed.
- (a) V. Armel, M. Forsyth, D. R. MacFarlane and J. M. Pringle, Energy. Environ. Sci., 2011, 4, 2234 RSC; (b) M. Hattori, S. Fukada and D. Nakamura, J. Chem. Soc., Faraday Trans., 1990, 86, 3777 RSC; (c) W. A. Henderson, D. M. Seo, Q. Zhou, P. D. Boyle, J.-H. Shin, H. C. De Long, P. C. Trulove and S. Passerini, Adv. Energy Mater., 2012, 2, 1343 CrossRef CAS.
- D. R. MacFarlane and M. Forsyth, Adv. Mater., 2001, 13, 957 CrossRef CAS.
- J. M. Pringle, P. C. Howlett, D. R. MacFarlane and M. Forsyth, J. Mater. Chem., 2010, 20, 2056 RSC.
- (a) U. A. Rana, R. Vijayaraghavan, D. R. MacFarlane and M. Forsyth, Chem. Commun., 2011, 47, 6401 RSC; (b) U. A. Rana, M. Forsyth, D. R. MacFarlane and J. M. Pringle, Electrochim. Acta, 2012, 84, 213 CrossRef CAS.
- (a) J. Luo, O. Conrad and I. F. J. Vankelecom, J. Mater. Chem. A, 2013, 1, 2238 RSC; (b) J. Luo, Ph.D. thesis, KU Leuven, 2012.
- (a) H. Zhu, U. Rana, V. Ranganathan, L. Jin, L. A. O'Dell, D. R. MacFarlane and M. Forsyth, J. Mater. Chem. A, 2014, 2, 681 RSC; (b) H. Zhu, D. MacFarlane and M. Forsyth, J. Phys. Chem. C, 2014, 118, 28520 CrossRef CAS.
- (a) J. Leys, M. Wübbenhorst, C. P. Menon, R. Rajesh, J. Thoen, C. Glorieux, P. Nockemann, B. Thijs, K. Binnemans and S. Longuemart, J. Chem. Phys., 2008, 128, 064509 CrossRef PubMed; (b) J. R. Sangoro, A. Serghei, S. Naumov, P. Galvosas, J. Kaerger, C. Wespe, F. Bordusa and F. Kremer, Phys. Rev. E: Stat., Nonlinear, Soft Matter Phys., 2008, 77, 051201 CrossRef PubMed.
- C. L. Angell, N. Sheppard, A. Yamaguchi, T. Shimanouchi, T. Miyazawa and S. Mizushima, Trans. Faraday Soc., 1957, 53, 589 RSC.
- L. Pauling, Nature of the Chemical Bond, Cornell University Press, 1942, p. 213 Search PubMed.
- R. J. Sension, B. Hudson and P. R. Callis, J. Phys. Chem., 1990, 94, 4015 CrossRef CAS.
- M. Drozd, Mater. Sci. Eng., B, 2007, 136, 20 CrossRef CAS.
- (a) J. Luo, O. Conrad and I. F. J. Vankelecom, J. Mater. Chem., 2012, 22, 20574 RSC; (b) J. Luo, J. Hu, W. Saak, R. Beckhaus, G. Wittstock, I. F. J. Vankelecom, C. Agert and O. Conrad, J. Mater. Chem., 2011, 21, 10426 RSC; (c) E. S. Stoyanov, K.-C. Kim and C. A. Reed, J. Am. Chem. Soc., 2006, 128, 8500 CrossRef CAS PubMed; (d) K. Mori, S. Hashimoto, T. Yuzuri and K. Sakakibara, Bull. Chem. Soc. Jpn., 2010, 83, 328 CrossRef CAS; (e) J. Luo, T. V. Tan, O. Conrad and I. F. J. Vankelecom, Phys. Chem. Chem. Phys., 2012, 14, 11441 RSC.
- A. Bernson and J. Lindgren, Solid State Ionics, 1993, 60, 37 CrossRef CAS.
- R. Langner and G. Zundel, J. Chem. Soc., Faraday Trans., 1998, 94, 1805 RSC.
- Online edition for students of organic chemistry lab courses at the University of Colorado, Boulder, Dept. of Chem. and Biochem., Chapter 15, Infrared Spectroscopy: Theory (2002). http://orgchem.colorado.edu/Spectroscopy/irtutor/IRtheory.pdf.
- (a) K. D. Kreuer, A. Fuchs, M. Ise, M. Spaeth and J. Maier, Electrochim. Acta, 1998, 43, 1281 CrossRef CAS; (b) S. Li, Z. Zhou, Y. Zhang, M. Liu and W. Li, Chem. Mater., 2005, 17, 5884 CrossRef CAS.
- Y. Huang, Q. Li, A. H. Jensen, M. Yin, J. O. Jensen, E. Christensen, C. Pan, N. J. Bjerrum and W. Xing, J. Mater. Chem., 2012, 22, 22452 RSC.
- H. Luo, G. A. Baker and S. Dai, J. Phys. Chem. B, 2008, 112, 10077 CrossRef CAS PubMed.
- H. Luo, G. A. Baker, J. S. Lee, R. M. Pagni and S. Dai, J. Phys. Chem. B, 2009, 113, 4181 CrossRef CAS PubMed.
- D. R. MacFarlane, J. M. Pringle, K. M. Johansson, S. A. Forsyth and M. Forsyth, Chem. Commun., 2006, 1905 RSC.
- Z. Zhao, K. Ueno and C. A. Angell, J. Phys. Chem. B, 2011, 115, 13467 CrossRef CAS PubMed.
- M. Yoshizawa, W. Xu and C. A. Angell, J. Am. Chem. Soc., 2003, 125, 15411 CrossRef CAS PubMed.
- S. A. Forsyth, K. J. Fraser, P. C. Howlett, D. R. MacFarlane and M. Forsyth, Green Chem., 2006, 8, 256 RSC.
- (a) J. Sun, D. R. MacFarlane and M. Forsyth, Solid State Ionics, 2002, 148, 145 CrossRef CAS; (b) R. Asayama, J. Kawamura and T. Hattori, Chem. Phys. Lett., 2005, 414, 87 CrossRef CAS; (c) V. Armel, D. Velayutham, J. Sun, P. C. Howlett, M. Forsyth, D. R. MacFarlane and J. M. Pringle, J. Mater. Chem., 2011, 21, 7640 RSC.
- J. Timmermans, J. Phys. Chem. Solids, 1961, 18, 1 CrossRef CAS.
- (a) K. Kuchitsu, H. Ono, S. Ishimaru, R. Ikeda and H. Ishida, Phys. Chem. Chem. Phys., 2000, 2, 3883 RSC; (b) N. G. Parsonage and L. A. K. Staveley, Disorder in Crystals, Clarendon Press, Oxford, 1978 Search PubMed.
- P. Jain, V. Ramachandran, R. J. Clark, H. D. Zhou, B. H. Toby, N. S. Dalal, H. W. Kroto and A. K. Cheetham, J. Am. Chem. Soc., 2009, 131, 13625 CrossRef CAS PubMed.
- Y. Tang, Z. Sun, C. Ji, L. Li, S. Zhang, T. Chen and J. Luo, Cryst. Growth Des., 2015, 15, 457 CAS.
- S. Hoshino, T. Mitsui, F. Jona and R. Pepinsky, Phys. Rev., 1957, 107, 1255 CrossRef CAS.
- (a) W. A. Henderson, V. G. Young Jr, W. Pearson, S. Passerini, H. C. De Long and P. C. Trulove, J. Phys.: Condens. Matter, 2006, 18, 10377 CrossRef CAS; (b) F. Meersman, B. Geukens, M. Wübbenhorst, J. Leys, S. Napolitano, Y. Filinchuk, G. Van Assche, B. Van Mele and E. Nies, J. Phys. Chem. B, 2010, 114, 13944 CrossRef CAS PubMed.
- U. A. Rana, R. Vijayaraghavan, C. M. Doherty, A. Chandra, J. Efthimiadis, A. J. Hill, D. R. MacFarlane and M. Forsyth, J. Phys. Chem. C, 2013, 117, 5532 CAS.
- G. Xu, K. Otsubo, T. Yamada, S. Sakaida and H. Kitagawa, J. Am. Chem. Soc., 2013, 135, 7438 CrossRef CAS PubMed.
- U. A. Rana, R. Vijayaraghavan, D. R. MacFarlane and M. Forsyth, Chem. Commun., 2011, 47, 6401 RSC.
- Y. Abu-Lebdeh, A. Abouimrane, P.-J. Alarco, A. Hammami, L. Ionescu-Vasii and M. Armand, Electrochem. Commun., 2004, 6, 432 CrossRef CAS.
- A. H. Jensen, Q. Li, E. Christensen and N. J. Bjerrum, J. Electrochem. Soc., 2014, 161, F72 CrossRef CAS.
- L. Jin, K. M. Nairn, C. M. Forsyth, A. J. Seeber, D. R. MacFarlane, P. C. Howlett, M. Forsyth and J. M. Pringle, J. Am. Chem. Soc., 2012, 134, 9688 CrossRef CAS PubMed.
- T. Shimizu, S. Tanaka, N. Onoda-Yamamuro, S. Ishimaru and R. Ikeda, J. Chem. Soc., Faraday Trans., 1997, 93, 321 RSC.
- K.-D. Kreuer, Chem. Mater., 1996, 8, 610 CrossRef CAS.
- P. Ramaswamy, N. E. Wong and G. K. H. Shimizu, Chem. Soc. Rev., 2014, 43, 5913 RSC.
- K.-D. Kreuer, A. Rabenau and W. Weppner, Angew. Chem., Int. Ed. Engl., 1982, 21, 208 CrossRef.
- (a) P. Wang, Y.-N. Zhou, J.-S. Luo and Z.-H. Luo, Polym. Chem., 2014, 5, 882 RSC; (b) H. Cheng, P. Wang, J. Luo, J. Fransaer, D. E. De Vos and Z.-H. Luo, Ind. Eng. Chem. Res., 2015, 54, 3107 CrossRef CAS; (c) F. Lu, X. Gao, P. Sun and L. Zheng, New J. Chem, 2016 10.1039/c6nj01284a.
Footnote |
| † Electronic supplementary information (ESI) available: FTIR spectrum of guanidine carbonate; isothermal gravimetric analysis at five discrete temperatures; DSC traces at 10 and 20 °C min−1, respectively; DSC curves of [Gdm-H][NfO] at different heating/cooling rates showing the phase transition of phase III → phase II and the corresponding limiting temperature hysteresis; images of POM observations; Nyquist plots at various temperatures. See DOI: 10.1039/c6ta05472b |
| This journal is © The Royal Society of Chemistry 2016 |