 Open Access Article
Combination of solid state NMR and DFT calculation to elucidate the state of sodium in hard carbon electrodes†
Ryohei
Morita
a,
Kazuma
Gotoh
*ab,
Mika
Fukunishi
bc,
Kei
Kubota
bc,
Shinichi
Komaba
bc,
Naoto
Nishimura
d,
Takashi
Yumura
d,
Kenzo
Deguchi
e,
Shinobu
Ohki
e,
Tadashi
Shimizu
e and
Hiroyuki
Ishida
a
aGraduate School of Natural Science & Technology, Okayama University, 3-1-1 Tsushima-naka, Okayama 700-8530, Japan. E-mail: kgotoh@okayama-u.ac.jp
bElements Strategy Initiative for Catalysts and Batteries (ESICB), Kyoto University, Nishikyo-ku, Kyoto 615-8245, Japan
cDepartment of Applied Chemistry, Tokyo University of Science, 1-3 Kagurazaka, Shinjuku, Tokyo 162-8601, Japan
dDepartment of Chemistry and Materials Technology, Kyoto Institute of Technology, Matsugasaki, Sakyo-ku, Kyoto 606-8585, Japan
eNational Institute for Materials Science, Tsukuba, Ibaraki 305-0003, Japan
First published on 25th July 2016
Abstract
We examined the state of sodium electrochemically inserted in HC prepared at 700–2000 °C using solid state Na magic angle spinning (MAS) NMR and multiple quantum (MQ) MAS NMR. The 23Na MAS NMR spectra of Na-inserted HC samples showed signals only in the range between +30 and −60 ppm. Each observed spectrum was ascribed to combinations of Na+ ions from the electrolyte, reversible ionic Na components, irreversible Na components assigned to solid electrolyte interphase (SEI) or non-extractable sodium ions in HC, and decomposed Na compounds such as Na2CO3. No quasi-metallic sodium component was observed to be dissimilar to the case of Li inserted in HC. MQMAS NMR implies that heat treatment of HC higher than 1600 °C decreases defect sites in the carbon structure. To elucidate the difference in cluster formation between Na and Li in HC, the condensation mechanism and stability of Na and Li atoms on a carbon layer were also studied using DFT calculation. Na3 triangle clusters standing perpendicular to the carbon surface were obtained as a stable structure of Na, whereas Li2 linear and Li4 square clusters, all with Li atoms being attached directly to the surface, were estimated by optimization. Models of Na and Li storage in HC, based on the calculated cluster structures were proposed, which elucidate why the adequate heat treatment temperature of HC for high-capacity sodium storage is higher than the temperature for lithium storage.
1. Introduction
Secondary batteries are crucially important components, providing power for portable devices, transportation, and industries. As a representative secondary battery, lithium ion batteries (LIBs) are commonly used as indispensable energy storage systems for consumer electronics and vehicles because of their high working voltage, high energy density, good charge–discharge cyclability, and other benefits. Nevertheless, issues related to lithium resources and cost, are becoming increasingly important with the increased demand for LIBs. Sodium insertion materials have attracted much attention as sodium ion batteries (NIBs), which might be an alternative to LIBs because of the abundant resources; sodium is the second-lightest and second-smallest alkali metal next to lithium, and has comparable electrode potential to that of LIBs.1–9 Several groups, including our group, have reported the excellent electrochemical performance of NIBs consisting of Na metal oxides and non-graphitazable carbon (hard carbon, HC) as positive electrodes10,11 and negative electrodes, respectively.12–16For the development of NIBs possessing higher capacity, higher efficiency, long lifetime, and acceptable safety, it is indispensable to elucidate the states of the sodium ions and the mechanism of charging–discharging on the electrodes. We have investigated the state of sodium in an HC sample using solid state 23Na NMR,17 and have compared the state with lithium stored in HC.18–22 The behaviour of the sodium spectra appears to differ from that of lithium inserted in HC. 7Li NMR signals in HC appear between 9 and 80–120 ppm. The chemical shift moves proportionally to the lithium content at ambient temperature, although 23Na signals do not shift with the sodium content. The results suggest strongly that sodium quasi-metallic clusters do not form in closed nanopores of HC, unlike lithium in HC, although sodium atoms occupy nano-sized pores, while the negative electrode is sodiated electrochemically. However, the HC sample inspected in the research was the only commercial product made from petroleum pitch, then optimized for practical use as an LIB negative electrode.
It has been reported that the optimum structure of HC for Na storage differs from that for Li storage. For example, Hasegawa et al. reported on the electrochemical performance of HC negative electrodes prepared from resorcinol–formaldehyde gels by heating at different temperatures.23 The reversible capacity beyond 300 mA h g−1 was achieved for Na insertion into HC prepared by heat treatment between 1200 and 2000 °C, although the highest reversible capacity of LIB was obtained generally for the HC heat-treated at about 1000–1200 °C.24,25 The plateau region (under 0.1 V) of the charge (desodiation) curves was enhanced at 1200–1600 °C for Na, although that of delithiation decreased at those temperatures for Li. Simone et al. also reported electrochemical properties of HC derived from cellulose.26
This report describes the state analysis of sodium in HC prepared at various temperatures using solid state Na magic angle spinning (MAS) NMR and multiple quantum magic angle spinning (MQMAS) NMR. Particularly, we observe whether the quasi-metallic sodium clusters are formed or not in the HC created by a wide temperature range of 700–2000 °C. One difficulty of evaluating the state of sodium in HC is its high reactivity in the atmosphere. Sodium metal and sodium-inserted HC react with tiny amounts of water, oxygen molecules, or vaporized electrolyte solvent more actively than lithium or lithium-inserted HC, even in sealed NMR sample rotors or an Ar-filled glove box. The high reactivity affected the Na NMR spectra and complicated the analysis, resulting in lower reproducibility. Therefore, for this study, we diligently observe time-dependent variations of Na MAS NMR spectra. Then, we report the process of degradation of sodium ions in the samples. To elucidate the formation of Li and Na clusters in HC, a condensation mechanism of Li and Na atoms on a carbon layer is studied using DFT calculation.
2. Experimental
2.1 Preparation of Na-inserted HC samples and NMR measurement
The HC samples were prepared from sucrose according to a previous report.27 Sucrose dehydrated at 180 °C for 48 h was milled substantially. Then it was heated at 700, 900, 1300, 1600, and 2000 °C for 1 h under inert gas flow to produce carbon samples of HC-700, HC-900, HC-1300, HC-1600, and HC-2000, respectively, which were characterized using powder X-ray diffraction (XRD) and BET surface area measurements. Na was inserted electrochemically into, and extracted from, each HC sample using a two-electrode 2032 coin cell. A working electrode made of each HC sample with PVDF binder (Kureha Chemical Inds.) (9![[thin space (1/6-em)]](https://www.rsc.org/images/entities/char_2009.gif) :
:![[thin space (1/6-em)]](https://www.rsc.org/images/entities/char_2009.gif) 1 by weight) and a counter electrode of sodium metal (Kanto Chemical) were assembled with 1 M NaPF6/propylene carbonate (PC, battery grade; Kishida Chemical) and fluoroethylene carbonate (FEC, 2 wt%) as an additive.28 Charge–discharge profiles were collected by HJ1001-SD8 system (Hokuto Denko). Insertion (sodiation) of Na was conducted at 25 mA g−1. For NMR measurements, each cell was cycled at least twice between 0 and 2.0 V (vs. Na/Na+) to ensure SEI formation on HC for acceptable passivation, then discharged (sodiated) to the specific state of charge (SOC). Subsequently, the cell was disassembled in an Ar-filled glove box to select HC samples. After rinsing gently with PC, each HC sample was sealed in a 3.2 mmϕ sample rotor for solid state NMR. We have confirmed that our rinsing procedure decreases only the intensity of Na electrolyte signals, and does not affect the shape of the other signals in the NMR spectra.
1 by weight) and a counter electrode of sodium metal (Kanto Chemical) were assembled with 1 M NaPF6/propylene carbonate (PC, battery grade; Kishida Chemical) and fluoroethylene carbonate (FEC, 2 wt%) as an additive.28 Charge–discharge profiles were collected by HJ1001-SD8 system (Hokuto Denko). Insertion (sodiation) of Na was conducted at 25 mA g−1. For NMR measurements, each cell was cycled at least twice between 0 and 2.0 V (vs. Na/Na+) to ensure SEI formation on HC for acceptable passivation, then discharged (sodiated) to the specific state of charge (SOC). Subsequently, the cell was disassembled in an Ar-filled glove box to select HC samples. After rinsing gently with PC, each HC sample was sealed in a 3.2 mmϕ sample rotor for solid state NMR. We have confirmed that our rinsing procedure decreases only the intensity of Na electrolyte signals, and does not affect the shape of the other signals in the NMR spectra.
Using an NMR system (11.7 T magnet, DD2; Agilent Technologies Inc.) at a MAS frequency of 15 kHz, 23Na MAS NMR spectra of HC-700, HC-900, HC-1300, HC-1600, and HC-2000 samples were measured by accumulating 2000 scans. The 23Na MQMAS NMR was performed using a 3QMAS pulse sequence on a spectrometer (ECA-500; JEOL) and an 11.7 T magnet at a MAS frequency of 20 kHz for highly sodiated HC-1600 and HC-2000 samples. Each MQMAS spectrum was taken by an adjustment of the pulse condition using the 1D MAS experiment, and a subsequent accumulation over 3 days. 1 M NaCl aqueous solution was used as a reference at 0 ppm.
2.2 DFT calculation
For this study, density functional theory (DFT) calculations were performed with the B3LYP functional implemented in Gaussian 09 code to elucidate the state of sodium on a nanometer-sized carbon surface. We specifically examined how sodium atoms interact with a finite-sized sp2 carbon material as a model of the upper-most surface of HC. To obtain a finite-sized sp2 carbon material with a small HOMO–LUMO gap, we calculated the gap in the carbon cluster terminated by H atom with the D6h symmetry (6.8 eV for C6H6, 4.0 eV for C24H12, 2.83 eV for C54H18, 2.12 eV for C96H24, and 1.63 eV for C150H30) using the 6-31G** basis sets for carbon and hydrogen atoms. Consequently, C150H30 was used as a model of a finite-size sp2 carbon material. DFT calculations optimized the state of sodium atoms on C150H30, where the numbers of sodium atoms were 1, 7, 13, and 19. The 6-31G* basis set was used for sodium atoms.3. Results and discussion
3.1 Characterization of HC samples
All prepared samples (HC-700, HC-900, HC-1300, HC-1600, and HC-2000) showed typical powder XRD patterns as HC (Fig. S1†). The BET surface areas of the respective samples were 237, 172, 45, <1, and <1 m2 g−1, which also show a typical decrease as HC. Charge–discharge (desodiation–sodiation) curves of the cells, including HC samples prepared from sucrose in this study, and Na metal are presented in Fig. 1. The total charge (desodiation) capacity of the cell of HC-700 is 193 mA h g−1. It increased concomitantly with increased heating temperature (Table 1). The highest capacity of 302 mA h g−1 was achieved for a HC-1600 cell. At HC-2000, the desodiation capacity decreased considerably to 139 mA h g−1. Initial irreversible capacities of 98, 77, 66, 64, and 45 mA h g−1 were observed. They are ascribable to the decomposition of the electrolyte solution including solid electrolyte interphase (SEI) formation4,29 at 1.0–0.6 V. The charge–discharge curves are divisible into two regions: (a) a slope region (above 0.1 V) and (b) a plateau region (below 0.1 V). Presumably, region (a) corresponds to the intercalation of Na into misaligned graphene layers, whereas (b) is explained by the insertion of Na into closed pores of HC.4,30 The capacity in region (a) decreased with carbonized temperature of HC (Table 1). However, the capacity at region (b) increased with carbonized temperature of HC until 1600 °C, but it decreased from 1600 to 2000 °C. It is noteworthy that the capacity of (a) also decreased by increasing the temperature from 1600 to 2000 °C. That decrease is thought to be attributable to shrinkage of the interlayer distance between graphene layers in HC.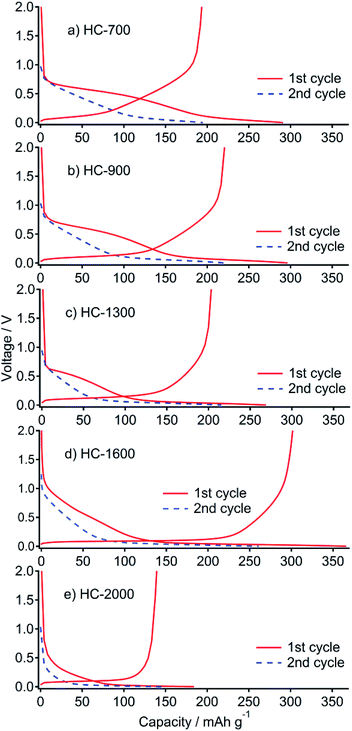 | ||
| Fig. 1 First cycle and second sodiation of galvanostatic curve profiles for HC-700 (a), HC-900 (b), HC-1300 (c), HC-1600 (d) and HC-2000 (e) in Na cells at 25 mA g−1 between 0 and 2.0 V. | ||
| Sample | Capacity (sodiation)/mA h g−1 | Capacity (desodiation)/mA h g−1 | Irreversible capacity/mA h g−1 | |
|---|---|---|---|---|
| Above 0.1 V | Below 0.1 V | |||
| HC-700 | 200 | 91 | 193 | 98 |
| HC-900 | 171 | 125 | 221 | 77 |
| HC-1300 | 113 | 156 | 203 | 66 |
| HC-1600 | 129 | 237 | 302 | 64 |
| HC-2000 | 62.5 | 121.5 | 139 | 45 |
As described in the Introduction, Hasegawa et al. reported electrochemical performances of HC electrodes derived from the resorcinol–formaldehyde gel.23 The carbon shows high Na capacity over 300 mA h g−1, even at temperatures higher than 2000 °C, although our product shows smaller capacity in that temperature range. This is true because of their mutually different carbon structures, especially related to the micropores, which store Na. Their electrodes were cut from a carbon monolith and were used as-is, with no binder, for an electrode. The precursor structure might strongly affect the construction of carbon products.
3.2 Na NMR of HC samples
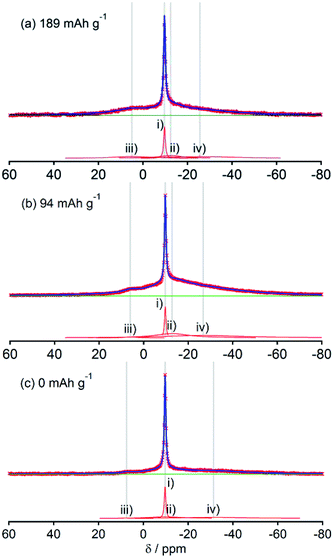
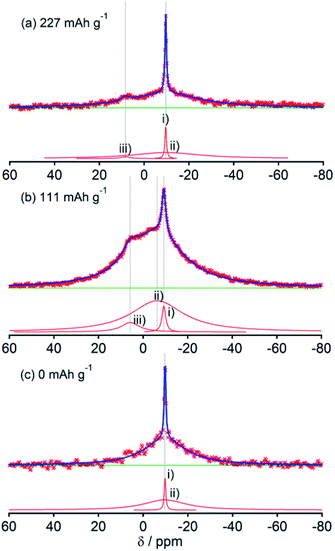
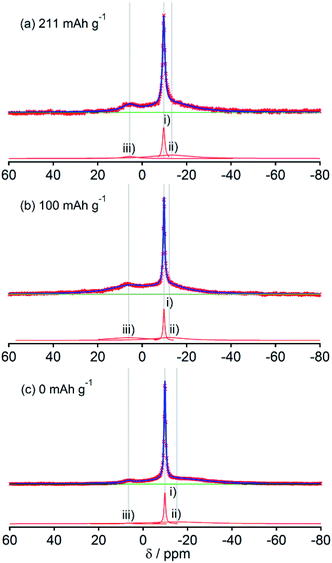
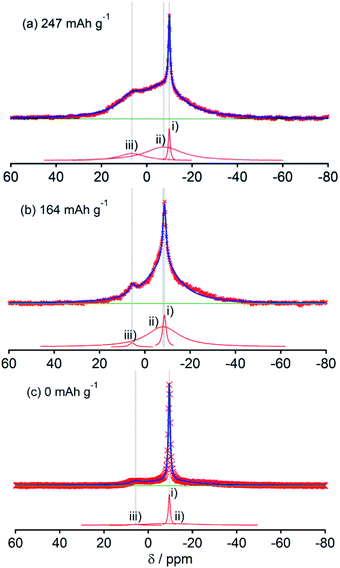
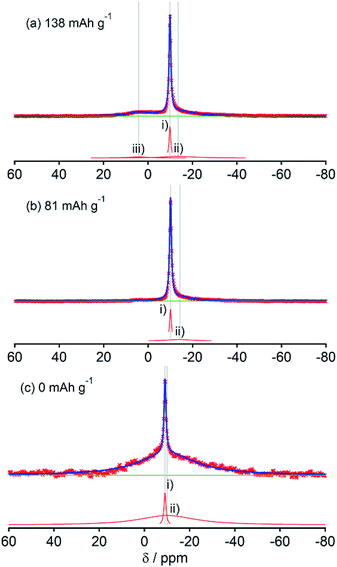
Fig. 2, 3, 4, 5 and 6, respectively, show 23Na MAS NMR spectra of Na-doped HC-700, HC-900, HC-1300, HC-1600, and HC-2000. The wide range spectra of highly sodiated samples (between +1800 and −300 ppm) are shown in Fig. S2 (see ESI†). All samples show signals only in the range of +30 and −60 ppm. Any shift of the peaks, depending on the state of charge (SOC) change, which had been observed in the 7Li NMR spectra of Li in HC, was not observed; the position of each peak was almost constant. No signal assigned to quasi-metallic sodium clusters between 1800 and 30 ppm was observed in any HC samples. That result corresponds to results of our earlier study of a pitch-based standard HC product,17 and a very recent report by Johnson et al.31 Each observed spectrum can be simulated by 2–4 Lorentzian components: (i) a narrow peak at about −9 and −10 ppm, assignable to residual Na salt dissolved in electrolyte; (ii) a major broad component at about +5 to −12 ppm, with more than 20 ppm of full width at half maximum (FWHM); (iii) a small peak near +5 ppm; (iv) a very broad component around −15 to −25 ppm appeared only in HC-700.The component (iv) observed in HC-700 (Fig. 2), which seems to be an extension of the component (ii), can be ascribed to sodium inserted in the closed space of insufficiently carbonized HC. It disappeared in the other HC heat-treated at higher temperature. In samples HC-700 and HC-900 (Fig. 2 and 3), component (ii) having a peak at −5 to −10 ppm and a component (iii) at about 7 ppm, which is weaker than (ii), were detected. The components should be assigned to reversibly adsorbed sodium in HC because they almost disappeared in the spectra of completely desodiated carbon (Fig. 2(c) and 3(c)). The spectra of desodiated HC-700 and HC-900 showed only major signals of the electrolyte solution and an additional broad component around −9 ppm, explained by ionic sodium compound contained in the solid electrolyte interphase (SEI) on the carbon surface, or non-extractable sodium ions in HC. Reports of previous studies by Alcántara et al.32 and our group17 described that the components (ii) and (iii) are ascribable to sodium stored in closed pores and in the space between misaligned graphene sheets, respectively. It is particularly interesting that sodium ions are apparently inserted into both adsorption sites simultaneously, whereas lithium is first stored between carbon layers and is then inserted into pores.33
The spectral shapes of HC-1300 and HC-1600 are mutually similar (Fig. 4 and 5). Each spectrum was simulated by three components. The peaks and widths of component (i) and (ii) in HC-1300 and in HC-1600 are similar to those of HC-700 and HC-900. Another small peak at 5–7 ppm in each spectrum of HC-1300 and HC-1600 was also detected, which is narrower than component (iii) of HC-700 and HC-900. The peak is expected to be attributable to sodium compounds or ions formed irreversibly at HC electrodes because the peaks were observed even in desodiated (0 mA h g−1) samples (Fig. 4(c) and 5(c)). Components (iii) of HC-1300 and HC-1600 are explained by two overlapping sodium components: reversible and irreversible. Because of the smaller specific surface area of HC-1300 and HC-1600 (<1 m2 g−1), the irreversible component is more likely to be assigned to a decomposed sodium compound than SEI on the surface of HC. By comparison with 23Na MAS NMR spectra of some sodium compounds (Fig. S3†), sodium carbonate (Na2CO3), or hydrated sodium hydroxide (NaOH(H2O))34 correspond to the peak. Hydration of sodium is only slightly possible in nonaqueous battery electrodes. Therefore, the irreversible sodium compounds are assigned to sodium carbonate formed by the reaction of Na and oxidized sites on/in HC.
Although HC-2000 also showed components (i), (ii), and (iii) in the 138 mA h g−1 spectrum (Fig. 6(a)), the signal intensity of (iii) was weak. It disappeared at 81 mA h g−1. At the desodiated state (0 mA h g−1), only signals of electrolyte solution and SEI were observed (Fig. 6(c)). Mutual differences of Na NMR spectra of HC-1600 and HC-2000 are discussed further in the following paragraphs, in light of the Na MQMAS NMR results.
The shapes of 23Na NMR spectra in the present research (Fig. 2–6) differ from spectra of Na in a pitch-based HC product reported previously by our group.17 A major peak at 9 ppm in pitch-based HC was altered to the broader component (iii); this might be attributable to the different structures of each HC, which originate from a different carbon source. In this study, we conducted the following two experiments to confirm our observation of sodium in “active” electrodes. (a) As the first experiment, fully sodiated HC-1300 cells after six cycles were disassembled in an Ar-filled glove box. Then the HC-1300 electrodes were rinsed using PC. Subsequently the cells were reassembled, and their electric capacities were measured. The charge–discharge curves of two representative reassembled HC-1300 cells are shown in Fig. S4.† The reassembled cells showed 85–100% capacities, compared with the original cells. (b) As the second experiment, the 23Na NMR spectra of sodiated HC-1600 and HC-2000 samples were measured repeatedly 1 day and 2 days after the first measurement, shown in Fig. 5(a) and 6(a). As displayed in Fig. 7, sharp signals at −9 to −10 ppm of Na in electrolyte solution transformed the border and shifted to a higher frequency (about −6 ppm). In addition, the broad (ii) component decreased gradually. Also, a new peak at +5 ppm assigned to Na2CO3 and/or NaOH(H2O) (Fig. S3†) appeared and increased. The peak shift of NaPF6/PC solutions in Na NMR increased concomitantly with decreasing concentration of NaPF6, as shown in Fig. S5.† Therefore, Na ions in electrolyte solution seemed to decrease over a few days by reactions on the HC surface and the formation of solid Na compounds in an NMR sample rotor. The reversible component of (iii) 1D spectrum (Fig. 5(a)) might move, but it was involved in the major broad component of the spectrum from 2 days after (bottom spectrum of Fig. 7(a)). According to the experiments presented in Fig. 7(a) and (b), it is certain that our experiments have revealed the characteristics of the active (not decomposed) and fresh state of sodium in HC electrodes.
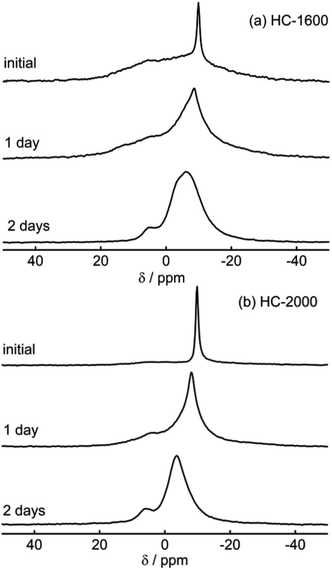 | ||
| Fig. 7 Temporal variations of 23Na MAS NMR spectra of sodiated HC-1600 (a) and sodiated HC-2000 (b). | ||
23Na MQMAS (3QMAS) NMR spectra of sodiated HC-1600 and HC-2000 are presented in Fig. 8(a) and (b). In MQMAS NMR, a 2D spectrum with a horizontal F2 axis and a vertical F1 axis is acquired. The 1D spectrum projected to the F2 axis corresponds to general MAS NMR, whereas the spectrum projected to the F1 axis represents an isotropic spectrum, for which the quadrupolar effect is averaged.35 In fact, the projections of the F2 axes in Fig. 8(a) and (b) don't coincide with the initial state of the 1D spectra (Fig. 7(a) and (b)). Since a few hours were needed to adjust the condition of MQMAS pulse sequences for each measurement, the initial states of the MQMAS acquisition don't correspond to the 1D spectra. Furthermore, the MQMAS NMR spectra shown in this study might contain some decomposed components, as shown in the spectra in Fig. 7, because they were taken by accumulation over three days, as described in the Experimental section. Nevertheless, the results are useful because they can still distinguish active sodium components in HC. The 2D spectrum of HC-1600 (Fig. 8(a)) consists of two regions: a broad component (α) spreading from −17 to 0 ppm in F2 and +10 to −5 ppm in F1, and a weaker component (β) at around 5 ppm in F2, which roughly corresponds to the 1D spectrum obtained 2 days after (bottom spectrum of Fig. 7(a)). The component (α) should be assigned to sodium in HC and in the deteriorated electrolyte solution. The latter component (β) in the 2D spectra is located on the CS axis, with no extension along the F2 axis. Therefore, it is ascribable to amorphous (non-crystallized) Na2CO3 and/or NaOH(H2O) reduced during 3 days of accumulation to acquire the 2D MQMAS spectrum. The former component (α) (−17–0 ppm of F2) includes some different components such as high crystallinity peaks extending along the F2 axis and non-crystallized isotropic peaks. The F1-projected spectra of component (α) include at least three peaks. One of them could be a deteriorated electrolyte solution. Therefore, two (or more) peaks are explained by signals of Na stored in a carbon structure.
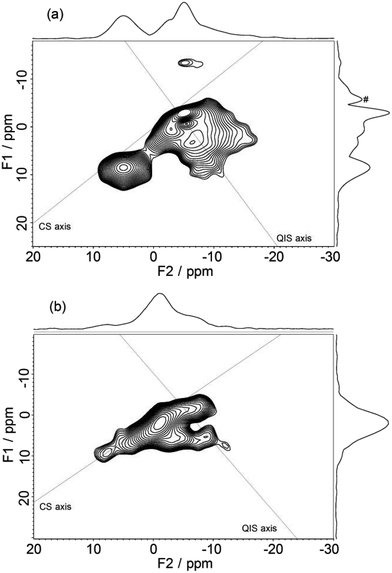 | ||
| Fig. 8 23Na 3QMAS NMR spectra of sodiated HC-1600 (a) and sodiated HC-2000 (b). A peak labelled by # on a projection spectrum along F1 is a t1 noise (artifact). | ||
In contrast, the MQMAS spectrum of HC-2000 (Fig. 8(b)) showed different features. The 2D spectrum seems to include three components: an isotropic component along the CS axis, assignable to the deteriorated (or partially extracted) sodium from electrolyte solution, a high crystallinity peak between 0 and −10 ppm along the F2 axis, explained by sodium in carbon, and a small component at 6 ppm on the F2 axis, attributed to decomposed Na2CO3 or NaOH(H2O). Furthermore, the F1-projected (isotropic) spectrum showed only one peak at 3 ppm. The results strongly suggest that the number of Na components in the carbon structure of HC-2000 is fewer than that of HC-1600. The main component of sodium in HC-2000 extends along the CS axis, which is assignable to disordered (i.e., amorphous) sodium. It can be concluded that a difference in carbon structure between HC-1600 and HC-2000 gave rise to a drastic difference in the manner of sodium storage, whereas little change was found for lithium storage,25 although the specific surface areas of both HC-1600 and HC-2000 are less than 1 m2 g−1.
3.3 DFT computation results for the state of alkali atoms on C150H30
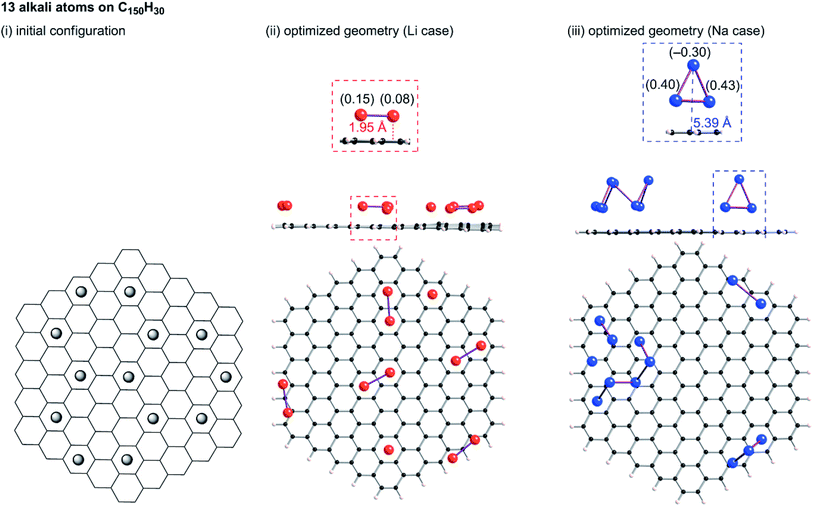
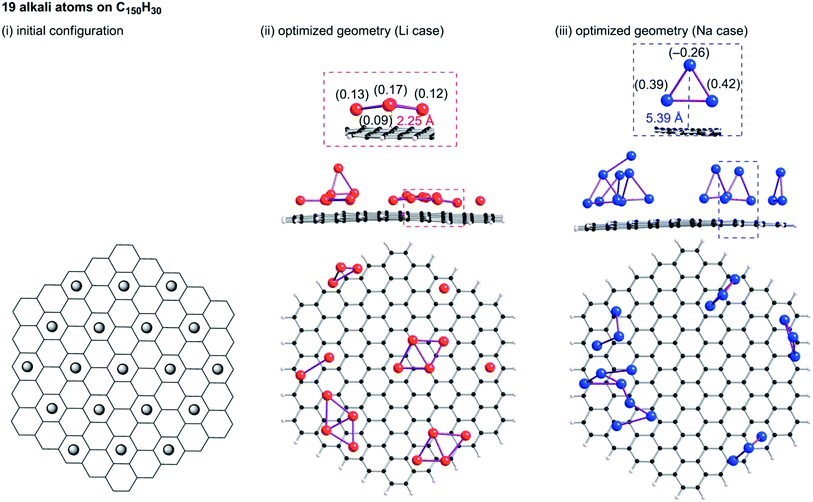
Tsai et al. reported an ab initio calculation study of the model for disordered carbon.36 Their results clarified that large interlayer distances are favourable for Na ion intercalation into carbon layers, and that vacancy defects can greatly enhance the Na ion intercalation. Datta et al.37 and Xu et al.38 discussed the stability of Na on defective graphene and graphyne (graphdiyne), respectively. Kaur et al. reported a Na2 dimer structure on graphene.39 Also, the structure of alkali metal (Li, Na, K) – graphite intercalation compounds (GICs) have been studied computationally.40–42 However, no information has been obtained for the condensation of Li or Na in the closed pores of HC. To elucidate the state of sodium atoms on HCs, we performed density functional theory (DFT) optimization of some sodium atoms on C150H30 as a model of the upper carbon surface of HCs. For comparison, optimized geometries for corresponding lithium cases were obtained. When an alkali atom was set at the centre of C150H30, DFT optimizations placed the single Li (Na) atom separated from the centre by 1.77 (2.26) Å, as shown in Fig. S6.† According to Mulliken population analyses, the attached Li and Na atoms, respectively, have +0.5e and +0.7e. The results demonstrate that cation–π interactions stabilize the optimized structures in Fig. S6.† Actually, the optimized structure for the single lithium (sodium) case lies 18.1 (6.1) kcal mol−1 below the dissociation limit toward the single atom and C150H30. Using the optimum separation between the alkali atom and C150H30, initial geometries for some alkali atoms on C150H30 were constructed, as shown in Fig. 9–11. The numbers of attached sodium atoms were regarded as 7 (Fig. 9), 13 (Fig. 10), and 19 (Fig. 11).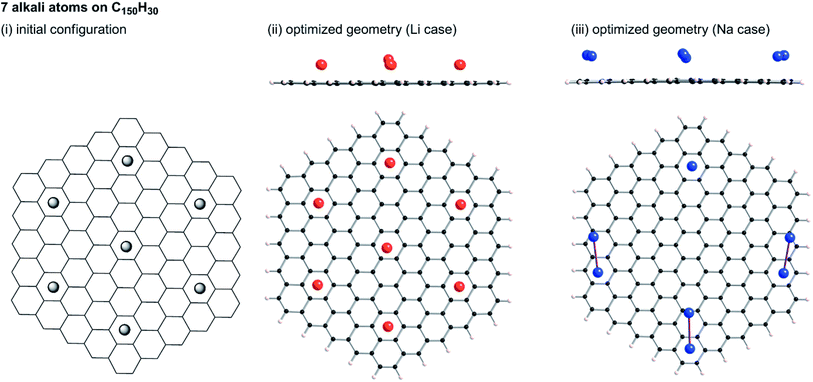 | ||
| Fig. 9 Initial configuration of seven alkali atoms on a C150H30 plane (i), and its optimized geometry for lithium (ii) and sodium (iii). | ||
B3LYP/6-31G** optimizations of the initial geometries yielded local minima, as portrayed in Fig. 9–11. Striking differences are apparent between the optimized geometries of the lithium and sodium cases. In the optimized geometries for 13 or 19 lithium atoms on C150H30, small even-numbered clusters mainly exist, for which all lithium atoms, except one, are bound directly to the carbon surface. Actually, five Li2 clusters are apparent in the 13 lithium-atom case, and three Li4 clusters in the 19 lithium-atom case (Fig. 10). When the attached lithium atoms are fewer (i.e. the 7 lithium-atom case), single Li species sit independently on the carbon surface (Fig. 9). In contrast to the formation of even-numbered lithium clusters on C150H30, optimized geometries for the sodium cases mainly have three-atom (Na3) clusters, plus one larger cluster (Fig. 10 and 11), except for the 7-sodium atom case in which Na2 clusters, corresponding to the dimer structure,39 were obtained (Fig. 9).
We found from Fig. 9–11 another characteristic difference in terms of how alkali atoms bind to the sp2 carbon surface. All lithium atoms, except one in Fig. 11(ii), are attached directly to the surface, with separations of around 2.0 Å. In contrast, parts of the sodium atoms cannot be bound directly to the surface, instead they interact with other sodium atoms attached to the surface. The sodium atoms that are not directly bonded to carbon are separated from the carbon surface by approximately 5.4 Å. The different binding fashions determine the amounts of charge transfer. Actually, atoms that are bound directly to the carbon surface have positive charges, whereas other atoms have negative charges, according to Mulliken population analyses (shown in Fig. 10(iii) and 11(iii)), which might explain the negative chemical shifts of Na NMR signals ascribed to sodium in HC pores (component (ii) in the Na NMR spectra). Furthermore, the alkali cluster formation diminishes positive charges on atoms that are estimated from their singlet atoms. Results show that the attached Li2 and Li4 clusters are, respectively, +0.2e and +0.5e. Similarly, the formed Na3 clusters have +0.5e in the sodium cases.
23Na NMR chemical shifts of atoms in the Na3 clusters were estimated using the B3LYP/6-31G** function. A structure for a Na3 cluster on C150H30 was constructed by removing 16 Na atoms from Fig. 11(iii), and the NMR shifts were calculated based on the gauge-independent atomic orbital (GIAO) method. The two Na atoms bonding to a carbon layer showed peak shifts between −2 and +30 ppm, whereas the chemical shift of the Na atom that is not directly bonded to carbon was estimated to be ca. −21 ppm (Fig. S7†). The estimated chemical shift values roughly correspond to the broad component (ii) of the 23Na NMR spectra, which is ascribed to Na in the pores of carbon. Although the assignment of component (ii) and (iii) was firstly suggested by Alcántara et al.,32 no evidence has been reported. To the best of our knowledge, our Na3 triangle cluster model and the estimation of the NMR shift is the first explanation of the assignment.
The computational results presented above are helpful to understanding the 23Na NMR results. Our DFT optimizations revealed that 13 or 19 sodium atoms on C150H30 aggregated to form triangle clusters, in addition to large clusters. These results show the selective formation of triangle sodium clusters, independent of the number of sodium atoms on carbon surfaces. The large cluster formation is negligible, considering the restricted space of HCs that allows atoms to move freely. The DFT results are expected to be consistent with the 23Na NMR results because the NMR measurements did not observe signals derived from metallic or quasi-metallic sodium clusters.
3.4 Proposed storage model of lithium and sodium in HC
It has been reported that HC prepared by heat treatment between 1000 and 1200 °C shows the largest capacity for lithium.24,25 The reduction in Li capacity for HC heat-treated over 1300 °C has been explicated by the collapse of inner pores and shrinkage of the carbon structure, or blockage of the passage from surface to pores. However, the explanation is not applicable to the sodium storage because HC samples heated by HC-1600 showed the largest reversible capacity, as presented in Fig. 1. The average pore size of HC estimated using small angle X-ray scattering grows larger with the increased heat treatment temperature of the carbon,43–45 although adsorption–desorption isotherm measurements show that nitrogen gas is not adsorbed to the pore.46 In the case of lithium storage in the pores of HC heat-treated at temperatures below 1300 °C, lithium atoms disperse on the inner surface of the pores with the formation of Li2, Li4, or larger clusters along the wall, according to the model shown in Fig. 10 and 11 (Fig. 12). With increasing lithium storage, the pores are filled easily by lithium. Consequently, quasi-metallic large clusters are formed. In contrast, larger pores in HC heated over 1400 °C show a smaller inner surface area, which gives rise to less lithium storage. Furthermore, filling the larger pores with lithium is not stable because the electric potentials of such very large clusters are too close to that of lithium metal. Consequently, very few quasi-metallic lithium clusters in HC created by heat-treatment at temperatures higher than 1400 °C are observed using 7Li NMR.20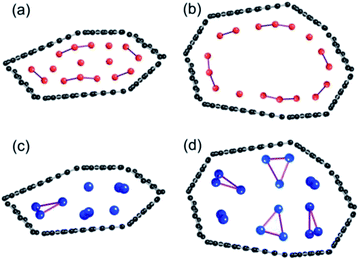 | ||
| Fig. 12 Schematic models of lithium storage in pores of HC-1300 (a) and HC-1600 (b), and sodium storage in HC-1300 (c) and HC-1600 (d). | ||
For sodium, the results suggest that the pore size in HC heated at temperatures below 1300 °C are too small to store many Na3 triangle clusters perpendicular to the pore surface (Fig. 12). The average size of the pores in the HC-1600 is apparently the most preferable for accepting many Na3 clusters. However, the larger HOMO–LUMO gap of the triangle Na cluster prevents the exhibition of metallic properties. The sodium storage sites are thought to decrease in the HC heated at 2000 °C, compared to HC-1600, which means that further shrinkage between carbon layers occurs. Additionally, carbonization at such a high temperature produces homogenization of carbon layers and reduces the defect structure. In our group's experiments, it can be observed that sodium storage capacity is controllable by the heat treatment conditions (temperature, treatment time, and so on) and the electrochemical conditions, including electrolyte additive and electrode binder/conductive additive. It should be considered that arranging sodium storage sites, not only of the void between carbon layers, but also of the space related to the defect structures, is important for the development of HC electrodes for high-capacity NIBs. We are observing details of the behaviour of the insertion of alkali metals into HC, using electrochemical measurements and small angle X-ray scattering. Those results shall be published in later reports.
4. Conclusions
We conducted this 23Na MAS NMR study, demonstrating that the peaks of the sodium components in HC-700, HC-900, HC-1300, HC-1600, and HC-2000 tested in Na cells are ascribable to combinations of Na in electrolyte, reversible ionic Na components, irreversible Na components assigned to SEI or non-extractable sodium ions in HC, and decomposed Na compounds. No quasi-metallic sodium component was observed. The experimentally obtained results were explained consistently by calculations of the stable structure of Na and Li on a graphene sheet. Although it is difficult to impart quasi-metallic properties to the Na3 triangle clusters standing perpendicular to the pore surface, Li2 and Li4 clusters lying on the pore surface mutually interact more readily. Our model explains the assignment of 23Na NMR peaks, and elucidates why the adequate heat-treatment temperature of HC (around 1600 °C) for large sodium storage is higher than the heat-treatment temperature for lithium storage. Results obtained using MQMAS NMR imply that the electrochemical capacity of sodium in HC is determined not only by the heat-treatment temperature, but also by the defect sites in the carbon structure, which correspond to hollow sites on graphene layers in HC.36Acknowledgements
This work was supported by a JSPS Grant-in-Aid for Scientific Research (KAKENHI) No. 26870385. Authors thanks to Prof. Soshi Shiraishi (Gunma University) and Dr Taro Kinumoto (Oita University) for heat treatment of carbon samples at high temperature.Notes and references
- J. M. Tarascon and M. Armand, Nature, 2001, 414, 359 CrossRef CAS PubMed.
- D. Larcher and J. M. Tarascon, Nat. Chem., 2015, 7, 19 CrossRef CAS PubMed.
- N. Yabuuchi, K. Kubota, M. Dahbi and S. Komaba, Chem. Rev., 2014, 114, 11636 CrossRef CAS PubMed.
- S. Komaba, W. Murata, T. Ishikawa, N. Yabuuchi, T. Ozeki, T. Nakayama, A. Ogata, K. Gotoh and K. Fujiwara, Adv. Funct. Mater., 2011, 21, 3859 CrossRef CAS.
- K. Kubota and S. Komaba, J. Electrochem. Soc., 2015, 162, A2538 CrossRef CAS.
- M. S. Balogun, Y. Luo, W. Qiu, P. Liu and Y. Tong, Carbon, 2016, 98, 162 CrossRef CAS.
- V. Palomares, P. Serras, I. Villaluenga, K. B. Hueso, J. Carretero-González and T. Rojo, Energy Environ. Sci., 2012, 5, 5884 CAS.
- M. D. Slater, D. Kim, E. Lee and C. S. Johnson, Adv. Funct. Mater., 2013, 23, 947 CrossRef CAS.
- M. Sawicki and L. L. Shaw, RSC Adv., 2015, 5, 53129 RSC.
- K. Kubota, N. Yabuuchi, H. Yoshida, M. Dahbi and S. Komaba, MRS Bull., 2014, 39, 416 CrossRef CAS.
- R. J. Clément, P. G. Bruce and C. P. Grey, J. Electrochem. Soc., 2015, 162, A2589 CrossRef.
- A. Ponrouch, A. R. Goñi and M. R. Palacín, Electrochem. Commun., 2013, 27, 85 CrossRef CAS.
- J. Zhao, L. Zhao, K. Chihara, S. Okada, J. Yamaki, S. Matsumoto, S. Kuze and K. Nakane, J. Power Sources, 2013, 244, 752 CrossRef CAS.
- C. Bommier, W. Luo, W. Gao, A. Greaney, S. Ma and X. Ji, Carbon, 2014, 76, 165 CrossRef CAS.
- A. Fukunaga, T. Nohira, R. Hagiwara, K. Numata, E. Itani, S. Sakai, K. Nitta and S. Inazawa, J. Power Sources, 2014, 246, 387 CrossRef CAS.
- E. Irisarri, A. Ponrouch and M. R. Palacin, J. Electrochem. Soc., 2015, 162, A2476 CrossRef CAS.
- K. Gotoh, T. Ishikawa, S. Shimadzu, N. Yabuuchi, S. Komaba, K. Takeda, A. Goto, K. Deguchi, S. Ohki, K. Hashi, T. Shimizu and H. Ishida, J. Power Sources, 2013, 225, 137 CrossRef CAS.
- K. Gotoh, M. Maeda, A. Nagai, A. Goto, M. Tansho, K. Hashi, T. Shimizu and H. Ishida, J. Power Sources, 2006, 162, 1322 CrossRef CAS.
- K. Tatsumi, J. Conard, M. Nakahara, S. Menu, P. Lauginie, Y. Sawada and Z. Ogumi, Chem. Commun., 1997, 687 RSC.
- J. Conard and P. Lauginie, Tanso, 2000, 191, 62 CrossRef CAS.
- K. Guérin, M. Ménétrier, A. Février-Bouvier, S. Flandrois, B. Simon and P. Biensan, Solid State Ionics, 2000, 127, 187 CrossRef.
- M. Letellier, F. Chevallier, C. Clinard, E. Frackowiak, J. Rouzaud, F. Béguin, M. Morcrette and J. Tarascon, J. Chem. Phys., 2003, 118, 6038 CrossRef CAS.
- G. Hasegawa, K. Kanamori, N. Kannari, J. Ozaki, K. Nakanishi and T. Abe, ChemElectroChem, 2015, 2, 1917 CrossRef CAS.
- K. Tatsumi, T. Kawamura, S. Higuchi, T. Hosotubo, H. Nakajima and Y. Sawada, J. Power Sources, 1997, 68, 263 CrossRef CAS.
- J. R. Dahn, T. Zheng, Y. Liu and J. S. Xue, Science, 1995, 270, 590 CAS.
- V. Simone, A. Boulineau, A. de Geyer, D. Rouchon, L. Simonin and S. Martine, J. Energy Chem., 2016 DOI:10.1016/j.jechem.2016.04.016 , in press.
- W. Xing, J. S. Xue and J. R. Dahn, J. Electrochem. Soc., 1996, 143, 3046 CrossRef CAS.
- S. Komaba, T. Ishikawa, N. Yabuuchi, W. Murata, A. Ito and Y. Ohsawa, ACS Appl. Mater. Interfaces, 2011, 3, 4165 CAS.
- D. A. Stevens and J. R. Dahn, J. Electrochem. Soc., 2001, 148, A803 CrossRef CAS.
- D. A. Stevens and J. R. Dahn, J. Electrochem. Soc., 2000, 147, 1271 CrossRef CAS.
- D. Zhou, M. Peer, Z. Yang, V. G. Pol, F. D. Key, J. Jorne, H. C. Foley and C. S. Johnson, J. Mater. Chem. A, 2016, 4, 6271 CAS.
- R. Alcántara, P. Lavela, G. F. Ortiz and J. L. Tirado, Electrochem. Solid-State Lett., 2005, 8, A222 CrossRef.
- M. Nagao, C. Pitteloud, T. Kamiyama, T. Otomo, K. Itoh, T. Fukunaga, K. Tatsumi and R. Kanno, J. Electrochem. Soc., 2006, 153, A914 CrossRef CAS.
- H. Koller, G. Engelhardt, A. P. M. Kentgens and J. Sauer, J. Phys. Chem., 1994, 98, 1544 CrossRef CAS.
- D. C. Apperley, R. K. Harris and P. Hodgkinson, Solid State NMR: Basic Principles & Practice, Momentum, New York, 2012 Search PubMed.
- P. Tsai, S. Chung, S. Lin and A. Yamada, J. Mater. Chem. A, 2015, 3, 9763 CAS.
- D. Datta, J. Li and V. B. Shenoy, ACS Appl. Mater. Interfaces, 2014, 6, 1788 CAS.
- Z. Xu, X. Lv, J. Li, J. Chen and Q. Liu, RSC Adv., 2016, 6, 25594 RSC.
- G. Kaur, S. Gupta, P. Rani and K. Dharamvir, Phys. E, 2015, 74, 87 CrossRef CAS.
- M. S. Dresselhaus and G. Dresselhaus, Adv. Phys., 1981, 30, 139 CrossRef CAS.
- K. Nobuhara, H. Nakayama, M. Nose, S. Nakanishi and H. Iba, J. Power Sources, 2013, 243, 585 CrossRef CAS.
- W. Wan and H. Wang, Int. J. Electrochem. Sci., 2015, 10, 3177 CAS.
- A. Gibaud, J. S. Xue and J. R. Dahn, Carbon, 1996, 34, 499 CrossRef CAS.
- K. Nishikawa, K. Fukuyama and T. Nishizawa, Jpn. J. Appl. Phys., Part 1, 1998, 37, 6486 CrossRef CAS.
- K. Fukuyama, T. Nishizawa and K. Nishikawa, Carbon, 2001, 39, 2017 CrossRef CAS.
- E. Buiel and J. R. Dahn, Electrochim. Acta, 1999, 45, 121 CrossRef CAS.
Footnote |
| † Electronic supplementary information (ESI) available: XRD patterns of HC samples, wide range 23Na NMR spectra, Na NMR spectra of some inorganic sodium compounds and NaPF6/PC solutions, charge/discharge curves of reassembled cells, and DFT optimizations of an alkali atom (Li or Na) set at the center of C150H30. See DOI: 10.1039/c6ta04273b |
| This journal is © The Royal Society of Chemistry 2016 |

