 Open Access Article
Creative Commons Attribution 3.0 Unported Licence
A high temperature reduction cleaning (HTRC) process: a novel method for conductivity recovery of yttrium-doped barium zirconate electrolytes†
Donglin
Han
 *a,
Junji
Iihara
b,
Shigeaki
Uemura
b,
Kenji
Kazumi
a,
Chihiro
Hiraiwa
b,
Masatoshi
Majima
b and
Tetsuya
Uda
*a
aDepartment of Materials Science and Engineering, Kyoto University, Yoshida Honmachi, Sakyo-ku, Kyoto 606-8501, Japan. E-mail: uda_lab@aqua.mtl.kyoto-u.ac.jp; han.donglin.8n@kyoto-u.ac.jp; Fax: +81-75-753-5284; Tel: +81-75-753-5445
bSumitomo Electric Industries, Ltd., 1-1-1, Koyakita, Itami-shi, Hyogo 664-0016, Japan
First published on 9th June 2016
Abstract
Proton conducting Y-doped BaZrO3 (BZY) and nickel oxide (NiO) are currently the most promising electrolyte and anode catalyst for protonic ceramic fuel cells, respectively. However, during the co-sintering process to fabricate the fuel cells, Ni cations diffuse from the anode into the lattice of the BZY electrolyte, resulting in significant degradation of the electrolyte conductivity and fuel cell performance. With the aim to solve such a problem, in this work, we report a novel method, named as high temperature reduction cleaning (HTRC) process, which is composed of several sequential heat-treatments in controlled atmospheres. The most interesting point is that after heat-treating the NiO-contaminated BZY at 1400 °C in a Ti-deoxidized Ar atmosphere for 100 h, Ni cations were observed to be expulsed from the BZY lattice and segregated at the grain boundary as Ni metal particles. And the conductivity of the BZY electrolyte was recovered. However, delamination along the grain boundary of the BZY electrolyte was introduced when the segregated Ni metal particles were oxidized to NiO particles in an oxygen atmosphere. And a series of sequential heat-treatments were designed to solve such a problem.
1. Introduction
Because of potential application as efficient power generation devices, protonic ceramic fuel cells (PCFCs) operating in the intermediate temperature range (450–700 °C) are receiving increasing attention. Y-doped BaZrO3 (BZY), which exhibits both high proton conductivity1–5 and excellent chemical stability,6,7 is regarded as the most promising electrolyte for PCFCs. Nickel (Ni) and electronically conducting oxides (such as La1−xSrxCo1−yFeyO3−δ (LSCF)) are employed as the anode and cathode, respectively. Such a combination of materials leads to quite exceptional results. For example, Shafi et al.8 reported a BaZr0.76Y0.2Ni0.04O3−δ electrolyte-based fuel cell with a peak power density of 240 mW cm−2 at 600 °C. A recent study by Duan et al.9 demonstrates a peak power density of 318 mW cm−2 at 600 °C for a cell with the BaZr0.8Y0.2O3−δ (BZY20) electrolyte. Nevertheless, it has been realized recently that special attention needs to be focused on the interaction between BZY and nickel oxide (NiO).10–14 The supporting anode is made from a mixture of NiO and the electrolyte material. After a thin BZY20 electrolyte layer is placed on the anode, the cell is subjected to a co-sintering process (1400–1600 °C) for bi-layer fabrication. However, as shown in Table 1, the BZY20 thin electrolyte prepared by such a method shows a significant degradation in conductivity (<2.7 × 10⁻³ S cm−1 at 600 °C), greatly lower than the expected value of BZY20 (>10−2 S cm−1 at 600 °C).1,2,5 The predominant reason is due to the diffusion of Ni cations from the anode into the electrolyte layer by occupying an interstitial position of (1/2, 0, 0) in the BZY crystal lattice during the co-sintering process.14,25 Furthermore, nickel cations in the BZY electrolyte improves the sinterability; thus, 1 to 2 wt% NiO is often added deliberately to the electrolyte.9,12,26–28 Undoubtedly, the performance of fuel cells will be greatly improved, if the conductivity of the electrolyte can be recovered. However, as far as we know, there is no relevant method until now. In this work we report a novel process, named as high temperature reduction cleaning (HTRC) process, to recover the conductivity of BZY20 from the contamination of Ni cations.| Reporter | Co-sintering temperature/°C | Electrolyte | ||
|---|---|---|---|---|
| composition | Thickness/μm | Conductivity/S cm−1 | ||
| Sun et al.15 | 1400 | BaZr0.8Y0.2O3−δ | 20 | 1.4 × 10⁻³ |
| Sun et al.16 | 1400 | BaZr0.8Y0.2O3−δ-CaO | 25 | 1.7 × 10⁻³ |
| Xiao et al.17 | 1450 | BaZr0.8Y0.2O3−δ | 25 | 7.7 × 10⁻⁴ |
| Fabbri et al.18 | 1500 | BaZr0.7Pr0.1Y0.2O3−δ | 20 | 1.5 × 10⁻³ |
| Bi et al.19 | 1400 | BaZr0.8Y0.2O3−δ | 30 | 2.7 × 10⁻³ |
| Luisetto et al.20 | 1450 | BaZr0.8Y0.16Zn0.04O3−δ | 20 | 1.7 × 10⁻³ |
| Sun et al.21 | 1400 | BaZr0.8Y0.15In0.05O3−δ | 12 | 2.4 × 10⁻³ |
| Bae et al.22 | 1200 | BaZr0.8Y0.2O3−δ | 5 | 5.7 × 10⁻⁴ |
| Bae et al.23 | 1200 | BaZr0.8Y0.2O3−δ | 6.6 | 9.4 × 10⁻⁴ |
| Liu et al.24 | 1450 | BaZr0.7Nd0.1Y0.2O3−δ | 30 | 2.0 × 10⁻³ |
| Shafi et al.8 | 1450 | BaZr0.76Y0.2Ni0.04O3−δ | 12 | 2.1 × 10⁻³ |
2. Experimental
2.1 Material preparation
BaZr0.8Y0.2O3−δ was prepared by a conventional solid state reaction method. Starting materials of BaCO3 (Wako Pure Chemical Industries, Ltd., 99.9%), ZrO2 (Tosoh Corporation, 98.01%), and Y2O3 (Shin-Etsu Chemical Co., Ltd., 99.9%) were mixed in the desired ratio and ball-milled for 24 h. After being pressed into pellets under 9.8 MPa pressure, the sample was heat-treated at 1000 °C for 10 h. Then, the sample was pulverized and ball-milled for 10 h, and pressed into pellets under 9.8 MPa pressure again, with a subsequent heat-treatment at 1300 °C for 10 h for synthesizing. The sample was then ball-milled for 100 h and mixed with NiO powder (Nikko Rica Corporation, 99.3%) in a molar ratio of 100![[thin space (1/6-em)]](https://www.rsc.org/images/entities/char_2009.gif) :
:![[thin space (1/6-em)]](https://www.rsc.org/images/entities/char_2009.gif) 5 (∼1.34 wt% of NiO, denoted as BZY20–5NiO for short). The mixture was ball-milled for 10 h and pressed into pellets at 392 MPa. The pellet-like samples were buried in a sacrificial powder of BZY20 – 1 wt% BaCO3 and heated at 1600 °C in an oxygen atmosphere for 24 h for sintering.
5 (∼1.34 wt% of NiO, denoted as BZY20–5NiO for short). The mixture was ball-milled for 10 h and pressed into pellets at 392 MPa. The pellet-like samples were buried in a sacrificial powder of BZY20 – 1 wt% BaCO3 and heated at 1600 °C in an oxygen atmosphere for 24 h for sintering.
2.2 Characterization
The conductivities of the pellet-like samples with sputtered Pt electrodes were measured in a wet atmosphere of O2 or H2. Water partial pressure in these wet atmospheres was kept at 0.05 atm by bubbling through deionized water kept at 33 °C. Impedance spectra were collected by A. C. impedance spectroscopy in the frequency range from 10 Hz to 7 MHz using a frequency response analyzer (Solartron SI 1260, Solartron Analytical, UK) with an applied A. C. voltage of 100 mV at temperatures ranging from 600 to 100 °C.The microstructure was observed by transmission electron microscopy (TEM) and scanning transmission electron microscopy (STEM) with a JEM-2100F (JEOL, Tokyo, Japan). Energy dispersion X-ray spectroscopy with a JED-2300 (STEM-EDS, JEOL, Tokyo, Japan) was used for composition measurements.
Ni K-edge X-ray absorption near-edge structure (XANES) measurements were performed at the SPring-8 synchrotron radiation facility (Hyogo, Japan) with the approval of the Japan Radiation Research Institute (JASRI) (proposal no. 2013B1568, and 2015A5330). The measurements of Ni metal foil and NiO were performed in the transmission mode, and the measurements of BZY20–5NiO samples were performed in the fluorescence mode by using a Si(111) double-crystal monochromator. The data of BZY20–5NiO samples which were sintered and subsequently heat-treated in hydrogen were collected at beamline BL14B2 at a temperature of 8 K. The other data were collected at BL16B2 at a temperature of 20 K.
3. Results and discussion
3.1 Sintering at 1600 °C
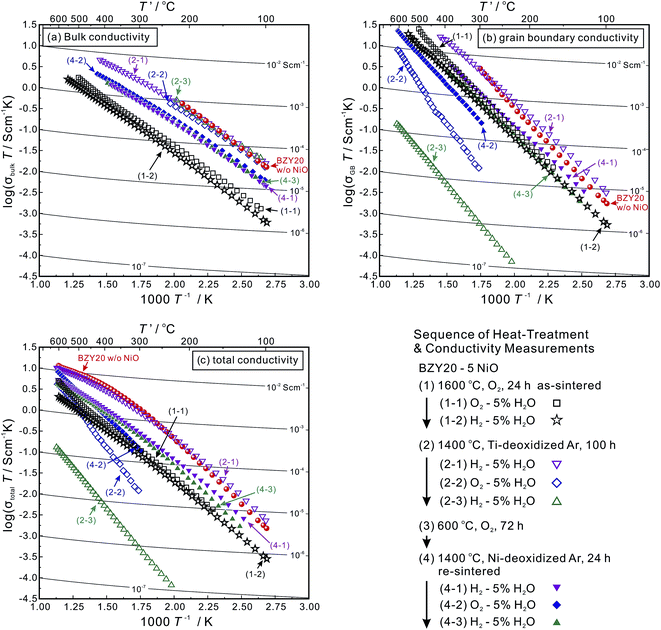
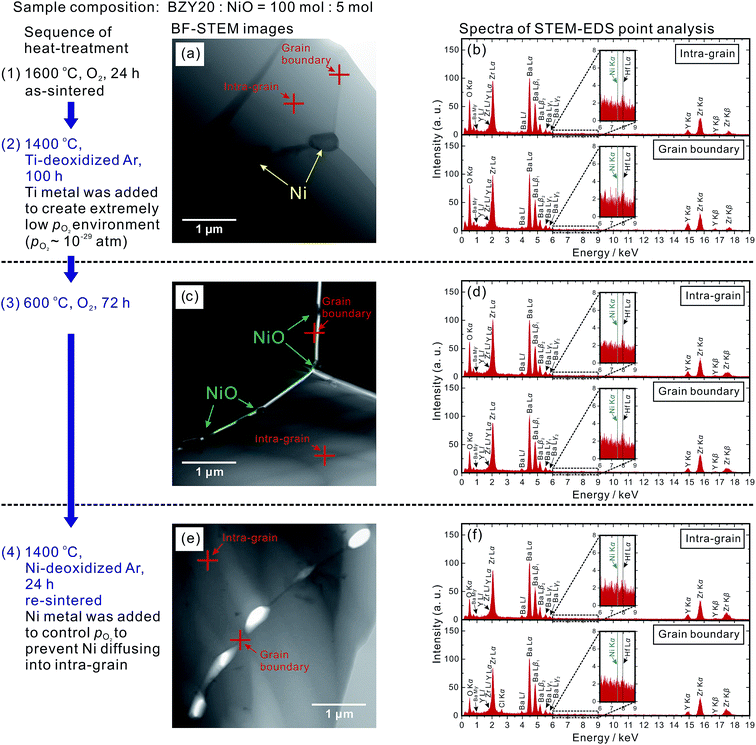
The temperature dependence of the bulk (intra-grain), grain boundary and total conductivities of the as-sintered (at 1600 °C) BZY20–5NiO samples in moist O2 and H2 (identified as (1-1) and (1-2), respectively) is displayed in Fig. 1. The values are lower than those of BZY20 without the NiO additive by about an order of magnitude, which is in agreement with previous reports.11–13 Probing the local composition by STEM-EDS point analysis provides confirmation of the existence of Ni in both the intra-grain and grain boundary areas. The representative positions for analysis are marked in Fig. 2(a) along with the corresponding spectra in Fig. 2(b).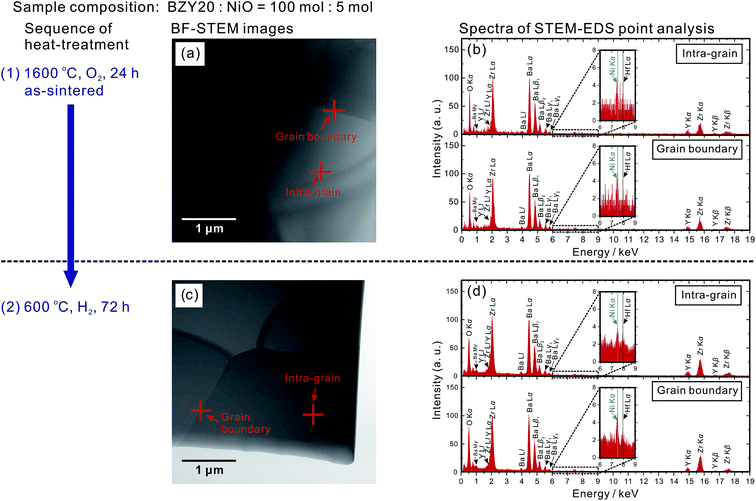 | ||
| Fig. 2 Bright field STEM (BF-STEM) images of BZY20–5NiO after (a) heating at 1600 °C in O2 for 24 h for sintering and (c) subsequent treatment at 600 °C in H2 for 72 h. Cross symbols indicate locations of intra-grain and grain boundaries for STEM-EDS point analysis. Corresponding spectra given are shown in (b) and (d). A weak peak belonging to Hf Lα (7.90 keV) appeared close to that of Ni Kα (7.47 keV) because the ZrO2 powder used in this study contained ∼2 wt% HfO2. An unknown peak appearing around 0.78 keV is believed to belong to Ba (see the ESI† for details). | ||
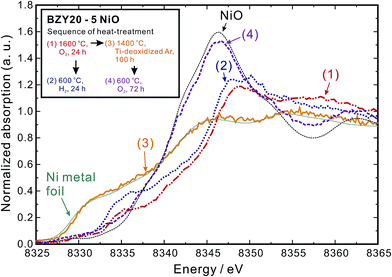
The Ni K-edge XANES spectrum of the as-sintered BZY20–5NiO (profile (1) in Fig. 3) is different from those of Ni metal and divalent Ni oxide (NiO). The Ni cations are present predominantly in the trivalent state at an interstitial position (1/2, 0, 0) of the BZY20 crystal lattice.11 In our recent work,11 we demonstrated that such a specific location of Ni cations in the BZY20 lattice is the origin of the lowered conductivity of BZY20.
3.2 Heat-treating at 600 °C in H2
As a corollary it is very interesting and challenging to attempt conductivity recovery by excluding Ni cations from the BZY20 lattice. First, an ordinary process was attempted by exposing the as-sintered BZY20–5NiO pellet to a dry hydrogen atmosphere at 600 °C. After keeping for 24 h, the shape of the Ni K-edge XANES spectra (profile (2) in Fig. 3) did not change significantly from that of the as-sintered sample. Only a slight shift towards the lower photon energy was observed, probably due to the reduction of the NiO residue at the grain boundary.11 The time for heat-treatment in H2 was then extended to 72 h, but the Ni K peak in the STEM-EDS spectra for both the intra-grain and grain boundary areas was still observed (Fig. 2(d)). These results clearly indicate that heat-treatment at a relatively lower temperature (600 °C, H2) does not promote significant expulsion of Ni from the BZY20 lattice.3.3 Heat-treating at 1400 °C in Ti-deoxidized Ar
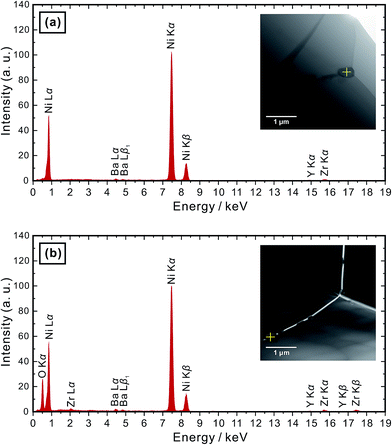
Then, the temperature was elevated to 1400 °C. For safety reasons, an Ar atmosphere (containing about 0.001 vol% O2 as-purchased) was used instead of H2. And sufficient titanium (Ti) metal was placed next to the samples (about 5 mm in distance) in the same furnace to control the partial pressure of oxygen at a very low level.29–31 After keeping the as-sintered BZY20–5NiO pellet in such an environment for 100 h, it can be seen that the bulk, grain boundary and total conductivities measured in the wet H2 (plot (2-1) in Fig. 1(a)–(c)) atmosphere returned very close to the values of BZY20 without the NiO additive. The conductivity appears to have recovered after such heat-treatment in low oxygen partial pressure Ar gas. Ni K-edge XANES analysis indicates that the spectra of the sample after such heat-treatment (profile (3) in Fig. 3) almost coincide with those of the Ni metal. Furthermore, through STEM-EDS analysis, we did not detect the peak belonging to Ni in either intra-grain or grain boundary area (Fig. 4(a) and (b)), but observed segregation of Ni metal particles at the grain boundary (Fig. 5(a)). All these results indicate that after heating at 1400 °C in Ar with very low oxygen partial pressure, Ni cations which had previously diffused into the BZY20 lattice segregated at the grain boundary in the form of Ni metal particles, resulting in the recovered electrical conductivity of BZY20.3.4 Delamination of grain boundary by exposing to O2
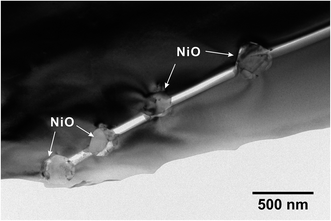
However, further experimentation indicated some additional issues. After the conductivity measurement in wet H2, we altered the atmosphere to wet O2. Although the bulk conductivity remained almost unchanged, the grain boundary conductivity decreased dramatically (plot (2-2) in Fig. 1(b)). The atmosphere was then altered to wet H2 again, and a further drop of the grain boundary conductivity (plot (2-3) in Fig. 1(b)) occurred.In order to clarify the reason, the BZY20–5NiO sample after keeping at 1400 °C in Ti-deoxidized Ar for 100 h was then exposed to O2 at 600 °C for 72 h. XANES analysis (profile (4) in Fig. 3) indicated that the oxidation state of Ni in such a sample is very close to that in divalent Ni oxide (NiO). The microstructure observation (Fig. 4(c) and 6) showed delamination along the grain boundaries in the sample which was exposed to the oxygen atmosphere after the heat-treatment at 1400 °C in Ti-deoxidized Ar for 100 h. And as can be clearly seen in Fig. 6, adjacent BZY20 grains were only connected by NiO particles (STEM-EDS point analysis results of these NiO particles are given in Fig. 5(b)). The reason for such a phenomenon can be explained with a schematic displayed in Fig. 7. Since the molar volume of NiO at room temperature (11.20 cm3 mol−1) is larger than that of Ni (6.59 cm3 mol−1), strains generated due to the oxidation of Ni to NiO particles caused delamination along the grain boundaries (Fig. 7(c)), resulting in a great decrease in the grain boundary conductivity. When the sample was exposed to the hydrogen atmosphere again, some of the grains which were used to be connected by NiO particles became disconnected due to the reduction of NiO to smaller Ni particles (Fig. 7(f)). And the grain boundary conductivity further decreased.
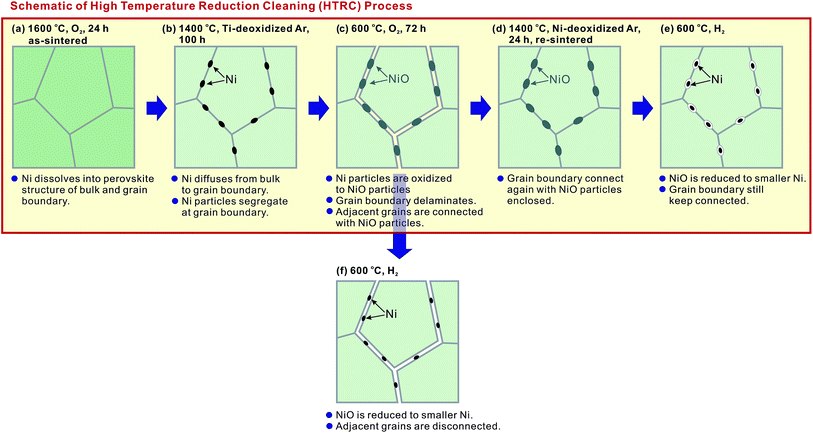 | ||
| Fig. 7 A schematic illustration of microstructural changes during the high temperature reduction cleaning (HTRC) process. | ||
3.5 Sequential processes to eliminate delamination along grain boundaries
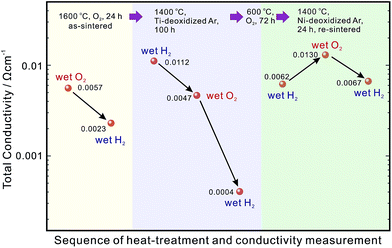
Such delamination of grain boundaries will be problematic, since the cathode side of the electrolyte is exposed to O2 during the fuel cell operation. To solve this problem, a series of sequential processes were designed. The sample which was heated at 1400 °C in the Ti-deoxidized Ar atmosphere for 100 h (Fig. 7(b)) was first kept at 600 °C in O2 for 72 h to deliberately introduce delamination along the grain boundaries (Fig. 7(c)). Subsequently, the sample was re-sintered at 1400 °C in an Ar atmosphere for 24 h to re-connect the grain boundary with embedded NiO particles (Fig. 7(d)). When this sample was further exposed to a reducing atmosphere, there was no risk of grain boundary delamination, since the embedded NiO particles were reduced to smaller Ni particles (Fig. 7(e)). A key point that must be emphasized here is that during the re-sintering step, it was vital to protect NiO from reduction to Ni and also avoid Ni cations diffusing into the BZY20 lattice again. Hence, Ni metal was placed next to the samples (about 5 mm in distance) to control the oxygen partial pressure in the Ar atmosphere. The oxygen partial pressure corresponding to the equilibrium, 2Ni + O2 = 2NiO, may not be sufficient to further oxidize divalent Ni cations to trivalent ones, which is a necessary condition for Ni cations to diffuse into the BZY20 lattice.11 Such a re-sintering strategy appeared to be effective since a partially re-connected grain boundary was observed (Fig. 4(e)). However, a very small peak (close to the noise level) belonging to Ni K appeared in the STEM-EDS spectra of the intra-grain area, as shown in Fig. 4(f). This result indicated that a very small amount of Ni cations, diffused back into the BZY20 lattice during the re-sintering process. As a consequence, the bulk conductivity (plots (4-1), (4-2) and (4-3) in Fig. 1(a)) is smaller than that of BZY20 without the NiO additive, but obviously higher than the as-sintered BZY20–5NiO sample. It is worth noting that the grain boundary and total conductivities were relatively stable with the atmosphere altering between wet H2 and wet O2. And the total conductivity of profiles (4-1) and (4-3) is obviously higher than that of the as-sintered BZY20–5NiO in wet H2 (plot (1-2) in Fig. 1(c)).A summary of the total conductivity at 600 °C of BZY20–5NiO after different heat-treatment scenarios is displayed in Fig. 8. The value after the high temperature reduction cleaning (HTRC) process in wet H2 (0.0062 and 0.0067 S cm−1) is about three times larger than that of the as-sintered sample (0.0023 S cm−1). Although a more tailored control of the oxygen partial pressure in the atmosphere during the re-sintering step needs further attention, it is clear that the HTRC process demonstrated in this work is very effective for the recovery of the electrical conductivity of electrolytes contaminated by impurity cations.
4. Conclusion
A novel high temperature reduction cleaning process was demonstrated in this work to recover the electrical conductivity of NiO-contaminated Y-doped BaZrO3. Ni cations diffused into the BZY lattice were observed to be expulsed and segregated at the grain boundary in the form of Ni metal particles after heating at 1400 °C in a Ti-deoxidized Ar atmosphere. As a consequence, the conductivity of BZY returned to the value of those without being contaminated by NiO. However, the segregated Ni particles induced delamination along the grain boundary when they are oxidized to the NiO particles, and a series of sequential heat-treatments in the atmosphere with carefully controlled partial pressure of oxygen were designed to effectively solve such a problem.Acknowledgements
This work was supported by Grant-in-Aid for Scientific Research A (Grant No. 15H02311) from the Japan Society for the Promotion of Science (JSPS). The authors thank Prof. K. T. Jacob at Indian Institute of Science for valuable comments and Dr Susumu Tsukimoto at Tohoku University for STEM-EDS analysis.References
- Y. Yamazaki, R. Hernandez-Sanchez and S. M. Haile, Chem. Mater., 2009, 21, 2755 CrossRef CAS.
- D. Pergolesi, E. Fabbri, A. D'Epifanio, E. D. Bartolomeo, A. Tebano, S. Sanna, S. Licoccia, G. Balestrino and E. Traversa, Nat. Mater., 2010, 9, 846 CrossRef CAS PubMed.
- D. Han, Y. Nose, K. Shinoda and T. Uda, Solid State Ionics, 2012, 213, 2 CrossRef CAS.
- D. Han, K. Shinoda, S. Sato, M. Majima and T. Uda, J. Mater. Chem. A, 2015, 3, 1243 RSC.
- D. Han, N. Hatada and T. Uda, J. Am. Ceram. Soc., 2016 DOI:10.1111/jace.14377.
- K. Katahira, Y. Kohchi, T. Shimura and H. Iwahara, Solid State Ionics, 2000, 138, 91 CrossRef CAS.
- Y. Guo, Y. Lin, H. Shi, R. Ran and Z. Shao, Chin. J. Catal., 2009, 30, 479 CrossRef CAS.
- S. P. Shafi, L. Bi, S. Boulfrad and E. Traversa, J. Electrochem. Soc., 2015, 162, F1498 CrossRef CAS.
- C. Duan, J. Tong, M. Shang, S. Nikodemski, M. Sanders, S. Ricote, A. Almansoori and R. O'Hayre, Science, 2015, 349, 1321 CrossRef CAS PubMed.
- S. Robinson, A. Manerbino, W. Grover Coors and N. P. Sullivan, Fuel Cells, 2013, 4, 584 CrossRef.
- D. Han, K. Shinoda, S. Tsukimoto, H. Takeuchi, C. Hiraiwa, M. Majima and T. Uda, J. Mater. Chem. A, 2014, 2, 12552 RSC.
- C. Y. Yoo, D. S. Yun, J. H. Joo and J. H. Yu, J. Alloys Compd., 2015, 621, 263 CrossRef CAS.
- E. Kim, Y. Yamazaki, S. M. Haile and H. I. Yoo, Solid State Ionics, 2015, 275, 23 CrossRef CAS.
- D. Han, Y. Otani, Y. Noda, T. Onishi, M. Majima and T. Uda, RSC Adv., 2016, 6, 19288 RSC.
- W. Sun, L. Yan, Z. Shi, Z. Zhu and W. Liu, J. Power Sources, 2010, 195, 4727 CrossRef CAS.
- Z. Sun, E. Fabbri, L. Bi and E. Traversa, J. Am. Ceram. Soc., 2012, 95, 627 CrossRef CAS.
- J. Xiao, W. Sun, Z. Zhu, Z. Tao and W. Liu, Mater. Lett., 2012, 73, 198 CrossRef CAS.
- E. Fabbri, L. Bi, H. Tanaka, D. Pergolesi and E. Traversa, Adv. Funct. Mater., 2011, 21, 158 CrossRef CAS.
- L. Bi, E. Fabbri, Z. Sun and E. Traversa, Energy Environ. Sci., 2011, 4, 1352 Search PubMed.
- I. Luisetto, S. Licoccia, A. D'Epifanio, A. Sanson, E. Mercadelli and E. D. Bartolomeo, J. Power Sources, 2012, 220, 280 CrossRef CAS.
- W. Sun, Z. Shi, M. Liu, L. Bi and W. Liu, Adv. Funct. Mater., 2014, 24, 5695 CrossRef CAS.
- H. Bae, J. Choi, K. Kim, D. Park and G. Choi, Int. J. Hydrogen Energy, 2015, 40, 2775 CrossRef CAS.
- H. Bae and G. Choi, J. Power Sources, 2015, 285, 431 CrossRef CAS.
- Y. Liu, Y. Guo, R. Ran and Z. Shao, J. Membr. Sci., 2012, 415–416, 391 CrossRef CAS.
- J. M. Polfus, M. Fontaine, A. Thøgersen, M. Riktor, T. Norby and R. Bredesen, J. Mater. Chem. A, 2016, 4, 8105 RSC.
- J. Tong, D. Clark, L. Bernau, M. Sanders and R. O'Hayre, J. Mater. Chem., 2010, 20, 6333 RSC.
- J. Tong, D. Clark, M. Hoban and R. O'Hayre, Solid State Ionics, 2010, 181, 496 CrossRef CAS.
- S. Nikodemski, J. Tong and R. O'Hayre, Solid State Ionics, 2013, 253, 201 CrossRef CAS.
- R. Akila, K. T. Jacob and A. K. Shukla, Bull. Mater. Sci., 1986, 8, 453 CrossRef CAS.
- T. H. Okabe, R. O. Suzuki, T. O. Oishi and K. Ono, Mater. Trans. JIM, 1991, 32, 485 CrossRef CAS.
- Z. Cao, W. Xie, I. Jung, G. Du and Z. Qiao, Metall. Mater. Trans. B, 2015, 46, 1782 CrossRef CAS.
Footnote |
| † Electronic supplementary information (ESI) available. See DOI: 10.1039/c6ta03552c |
| This journal is © The Royal Society of Chemistry 2016 |

