DOI:
10.1039/C6TA01749E
(Paper)
J. Mater. Chem. A, 2016,
4, 10454-10466
Novel cobalt-free BaFe1−xGdxO3−δ perovskite membranes for oxygen separation†
Received
27th February 2016
, Accepted 12th June 2016
First published on 14th June 2016
Abstract
A cobalt-free perovskite-type mixed ionic and electronic conductor (MIEC) is of technological and economic importance in many energy-related applications. In this work, a new group of Fe-based perovskite MIECs with BaFe1−xGdxO3−δ (0.025 ≤ x ≤ 0.20) compositions was developed for application in oxygen permeation membranes. Slight Gd doping (x = 0.025) can stabilize the cubic structure of the BaFe1−xGdxO3−δ perovskite. The Gd substitution of BaFe1−xGdxO3−δ materials increases the structural and chemical stability in the atmosphere containing CO2 and H2O, and decreases the thermal expansion coefficient. The BaFe0.975Gd0.025O3−δ membrane exhibits fast oxygen surface exchange kinetics and a high bulk diffusion coefficient, and achieves a high oxygen permeation flux of 1.37 mL cm−2 min−1 for a 1 mm thick membrane at 950 °C under an air/He oxygen gradient, and can maintain stability at 900 °C for 100 h. Compared to the pristine BaFeO3−δ and the well-studied Ba0.95La0.05FeO3−δ membranes, a lower oxygen permeation activation energy and higher oxygen permeability are obtained for the 2.5 at% Gd-doped material, which might be attributed to the expanded lattice by doping large Gd3+ cations and a limited negative effect from the strong Gd–O bond. A combination study of first principles calculation and experimental measurements was further conducted to advance the understanding of Gd effects on the oxygen migration behavior in BaFe1−xGdxO3−δ. These findings are expected to provide guidelines for material design of high performance MIECs.
1. Introduction
Oxygen, as one of the most popular resources and worldwide produced chemicals, plays a very crucial role in many fields of human economic and biological activities, such as high efficiency energy-saving technology, smelt manufacturing, chemical industries, waste disposal, aircraft, submarines and medical treatment.1–5 With the rapid spread and deep development of oxygen-related applications, the gas separation industry is facing ever-increasing demands on oxygen supply. However, due to the high energy consumption and production costs, cryogenic air separation technology, as the most popular method being employed in the present oxygen production process, leads to numerous challenges and great stress for the industrial community.6,7 Additionally, on account of the environmental pollution and energy exhaustion crisis becoming more severe, searching for alternatives to reduce the costs and environmental impacts is becoming increasingly urgent. Therefore, dense ceramic oxygen separation membrane technology attracts great attention as a promising alternative for oxygen production due to the outstanding features including simple processing, continuous operation on separation, infinite selectivity, high permeability, and particularly, combination with some chemical reactions to reduce costs and improve efficiency.8,9 And it is encouraging that this technology has already been exemplified by the Fraunhofer Institute for Ceramic Technologies and Systems.10
Mixed ionic and electronic conductors (MIECs) are the best candidates for application in dense ceramic oxygen permeation membranes. The oxygen molecules obtain electrons and are reduced to oxygen ions on the high oxygen partial pressure side of the membrane surface, which then migrate through the membrane to the other side driven by the oxygen partial pressure gradient. After bulk diffusion, the lattice oxygen will be released to the atmosphere on the oxygen-poor side, leaving electrons inside the material, which then travel in the opposite direction to replenish the electron depletion in the oxygen reduction reaction. For practical application of ceramic membranes in gas separation, many determinants, such as oxygen permeability, operation stability, and material costs, should be taken into consideration for acquiring feasible and prospective separator construction.7
During the past decades, many kinds of MIEC materials have been developed, and their structure and properties were extensively investigated. Among them, oxygen-deficient perovskite-type oxides with the formula ABO3−δ are always illustrated to be optimal materials for oxygen permeation membranes due to their high oxygen vacancy concentration and isotropic oxygen ionic migration paths. The A-site cations are mostly alkaline earth metal elements or lanthanides (Ba, Sr, La, Pr, etc.),11–14 and the B-site cations are always some transition metal elements such as Co, Fe, Mn, Cu, Cr and Ce.15–20 Many perovskite-type materials for oxygen permeation are modified at either the A-site or B-site. The two perovskites of Ba0.5Sr0.5Co0.8Fe0.2O3−δ (BSCF) and BaCo0.7Fe0.2Nb0.1O3−δ with outstanding oxygen permeability seem to be exemplified as the most promising candidates for oxygen separation.21,22 Both of them have Ba2+ occupying at the A-site, of which the lattice structure substantially takes advantages of the large radius and low valence, leading to a big lattice volume and high oxygen vacancy concentration. For the B-site, a high concentration of cobalt ions occupies the center of BO6 octahedra, resulting in high overlap between the 3d orbital of cobalt ions and 2p orbital of O ions, which provides a fast electron hopping route along B–O–B bonds.23 The weak Co–O bond energy is also favourable for oxygen vacancy migration. However, the phase decomposition of Co-based perovskite membranes, associated with the easy reduction of cobalt ions under a reducing atmosphere at high temperatures, always causes membrane structure deterioration and oxygen permeability degradation.24–26 Since the instability of cobalt-based perovskite materials seriously inhibits their practical applications, scientists have been trying to modify these materials by substituting cobalt with some anti-reduction metal ions with high valency, such as Nb, Zr, Ta and Mo.22,27,28 However, this approach still cannot completely solve the structural instability problem.
To address this issue, many kinds of cobalt-free perovskite-type materials were developed. BaFeO3−δ-based materials are proven to be promising alternatives because of the strong anti-reduction ability of iron ions, which have aroused increasing interest in the past few years.29–32 However, from a structural point of view, the A-site Ba2+ ion is too large to match the B-site Fe3/4+ ion to form a cubic perovskite structure, and thus phase transformations from the cubic structure to some other phases, such as hexagonal, rhombohedral and tetragonal structures, always take place at temperatures below ∼850 °C. Lattice doping is an effective way to dismiss the mismatch between A-site and B-site cations for stabilizing the cubic structure. Regarding the BaFeO3 material, there are two possible doping options: either substituting the A-site element with smaller cations, such as Sr, Gd and La,16,33,34 or replacing the B-site element with bigger ones, such as Zr, La, Nb, Y, In and Ce.30–32,35,36 In contrast to decreasing the unit cell volume of the cubic lattice by applying the first option, the partial substitution of the B-site with larger dopants would be a better choice, because it can expand the unit cell volume and thus provide more space for oxygen migration. Additionally, it is much more feasible to substitute cations with a lower valence (2+/3+) for Fe3/4+ cations at the B-site than doping monovalent cations at the A-site of BaFeO3−δ to introduce more oxygen vacancies into the lattice, according to the charge balance principle.
In this work, Gd was selected to partially substitute for Fe in consideration of its large ionic radius (Gd3+(VI) = 0.938 Å) and stable trivalent oxidation state, which would be beneficial for stabilizing the cubic perovskite structure and increasing the oxygen vacancy concentration. With the partial substitution of Gd for Fe at the B-site of BaFe1−xGdxO3−δ, the crystal structure, thermal reduction behavior, oxygen vacancy concentration, electrical conductivity, oxygen permeability and chemical stability would be actually changed. These physicochemical characteristics are systematically investigated to evaluate the feasibility and prospective of Gd-doped BaFeO3−δ as an oxygen separation membrane.
2. Experimental
2.1 Materials preparation
BaFe1−xGdxO3−δ (0 ≤ x ≤ 0.20) oxides were prepared via an ethylenediamine tetraacetic acid (EDTA)–citric acid combustion method as described previously.37,38 The stoichiometric raw materials of Ba(NO3)2 (AR, Sinopharm), Fe(NO3)3·9H2O (AR, Sinopharm), and Gd2O3 (AR, Sinopharm) were dissolved in distilled water with the addition of several drops of nitric acid (65–68%, AR, Sinopharm) to obtain a clear metal nitrate solution. Thereafter, EDTA and citric acid were added into the solution at a molar ratio of 1![[thin space (1/6-em)]](https://www.rsc.org/images/entities/char_2009.gif) :1.5:1 to the total number of metal ions. The pH value was adjusted to 8 with ammonia (28.0–30.0%, AR, Sinopharm). After being heated to evaporate water in a bath at 80 °C, the solution turned to a transparent gel, which was then pre-fired at 250 °C and calcined at 850 °C in air for 6 h to get oxide powder precursors. The obtained powders were thoroughly ground in a mortar adding several drops of 1 wt% PVA, and then pressed into disks (Φ ∼ 19 mm, thickness of 1–2 mm) and bars (2 × 7.5 × 42 mm3) under uniaxial pressure of 300 MPa followed by sintering in air at 1200 °C for 4 h. The sintered disks were polished to a proper thickness for oxygen permeation studies. The Ba0.95La0.05FeO3−δ membrane was reported to perform with a high oxygen permeability recently,34 and was prepared with the same method and under identical conditions for comparison with the designed BaFe1−xGdxO3−δ.
:1.5:1 to the total number of metal ions. The pH value was adjusted to 8 with ammonia (28.0–30.0%, AR, Sinopharm). After being heated to evaporate water in a bath at 80 °C, the solution turned to a transparent gel, which was then pre-fired at 250 °C and calcined at 850 °C in air for 6 h to get oxide powder precursors. The obtained powders were thoroughly ground in a mortar adding several drops of 1 wt% PVA, and then pressed into disks (Φ ∼ 19 mm, thickness of 1–2 mm) and bars (2 × 7.5 × 42 mm3) under uniaxial pressure of 300 MPa followed by sintering in air at 1200 °C for 4 h. The sintered disks were polished to a proper thickness for oxygen permeation studies. The Ba0.95La0.05FeO3−δ membrane was reported to perform with a high oxygen permeability recently,34 and was prepared with the same method and under identical conditions for comparison with the designed BaFe1−xGdxO3−δ.
2.2 Materials characterization
The phase composition and crystal structure of the synthesized samples were examined by powder X-ray diffraction (XRD) using a Rigaku D/max-A diffractometer. Measurements were conducted with Cu Kα1 radiation (λ = 1.5406 Å) in the 10–100° range. High temperature XRD studies were performed in air up to 900 °C on a Panalytical Empyrean diffractometer equipped with an Anton Paar 1200N oven chamber and PIXcel3D detector. The temperature program was set with 10 °C min−1 heating and cooling rates, and XRD data were collected in the 10–110° range at each temperature with an interval of 100 °C. After equilibration at the desired temperature for 5 min, the scan lasts around 50 min. The Rietveld method was applied to refine the recorded XRD patterns using a General Structure Analysis System (GSAS) with the EXPGUI graphical user interface.39,40
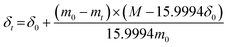
The temperature-dependent weight of the BaFe1−xGdxO3−δ (x = 0.025, 0.05 and 0.15) samples was characterized by thermogravimetric analysis (TGA) on Netzsch STA 449 apparatus in air or argon (Ar) with a flow rate of 60 mL min−1 from 25 to 850 °C. According to the TGA results and the initial oxygen non-stoichiometry δ0, which was evaluated with the iodometric titration method,41 the oxygen non-stoichiometry δt at high temperatures was calculated using eqn (1):
| |  | (1) |
where
m0 is the initial weight and
mt is the weight at a particular temperature point, and
M is the molar mass of BaFe
1−xGd
xO
3 (
x = 0.025, 0.05 and 0.15) with a stoichiometric oxygen content.
In order to evaluate the chemical stability of the materials in atmospheres containing H2O and CO2, the membranes with different doping contents were heat-treated in a furnace at 900 °C for 10 h under 10 vol% CO2/N2 and 7.5 vol% H2O/N2 atmospheres, respectively. The surface structure and morphology of these heat-treated membranes were examined to evaluate the chemical stability by XRD and scanning electron microscopy (SEM, LEO-1450), respectively.
The electrical conductivity of the considered materials was measured by the four-terminal DC method in air from 200 to 900 °C. The chemical bulk diffusion coefficient (Dchem) and surface exchange coefficient (kchem) were determined with the electrical conductivity relaxation (ECR) method. Before measuring, the densified bar was placed in a furnace at each temperature with an interval of 50 °C between 650 to 850 °C and supplied with a 10 vol% O2/N2 gas mixture at a constant flux of 200 mL min−1 for about 1 h to reach a steady state. By abruptly switching the atmosphere from 10 vol% to 20 vol% O2/N2 gas, the electrical conductivity would be changed due to the varied oxygen partial pressure, of which the dependence on time was recorded by the four-terminal DC method using a high precision digital multimeter (Keithley 2100). Then the oxygen ion diffusion and surface exchange coefficients can be obtained by fitting the electrical conductivity relaxation curves based on Fick's second law.42,43
2.3 Oxygen permeation measurement
The oxygen permeation properties of the considered BaFe1−xGdxO3−δ membranes were measured by the gas chromatography method using a vertical high temperature oxygen permeation apparatus described in previous work.44,45 After being polished, the as-prepared BaFe1−xGdxO3−δ membranes, with a thickness of 0.5–1.2 mm, were sealed on a quartz tube by a silver ring, with an effective inner circular area of 1.28 cm2. Compressed air was applied to sweep one side of the membrane as the feed gas, with a flow rate of 120 mL min−1 (STP). On the other side of the membrane, high purity helium (>99.999%) was introduced into the quartz tube as a carrier gas, with a flow rate of 60 mL min−1 (STP). The gas flow rates were monitored by a mass flow meter (Sevenstar, DC-07, China). The outlet gas, a mixture of helium and permeated oxygen, was then injected into the gas chromatograph with a TCD detector (GC, SP2100, China). In the present work, no nitrogen leaks were detected, confirming that the membranes were well sealed and gas-tight. The oxygen permeation flux was calculated using eqn (2):| |  | (2) |
where CO2 stands for the measured oxygen concentration in the outlet gas on the sweep side, F is the flow rate of helium, and S is the effective inner circular area of the membranes.
2.4 First principles calculation
In order to understand the Gd doping effect on the oxygen ion transport properties, the oxygen migration barrier energies were calculated through CASTEP (Cambridge Serial Total Energy Package) code,46,47 which is based on the density functional theory (DFT) and plane-wave pseudo-potential (PWP) method. For the exchange–correlation potential in the generalized gradient approximation (GGA), the Perdew–Wang 91 (PW91) scheme was employed.48 The cut-off energy of the plane-waves was chosen as 400 eV, and the atomic coordinates of the simulated structures were optimized by an iterative process using the Broyden–Fletcher–Goldfarb–Shanno (BFGS) algorithm,49 in order to minimize the energy with respect to the atomic positions. Tolerance for self-consistence was set at 5 × 10⁻⁶ eV per atom for the total energy, 0.01 eV Å−1 for force, 0.02 GPa for maximum stress, and 5 × 10⁻⁴ Å for the maximum displacement. The Brillouin zone integrations were approximated using the special 3 × 3 × 3 k-point sampling scheme of Monkhorst–Pack for the unit cell.50 The valence electronic configurations were taken as O 2s22p4, Fe 3d64s2, Gd 4f75s25p65d16s2 and Ba 5s25p66s2, for the ground state electronic structure calculations. The spin polarization calculation was adopted, and the formal spin was used as the initial one. After successful geometry optimization on defective supercells of the starting and ending configuration, the linear synchronous transit/quadratic synchronous transit (LST/QST) was used to calculate the oxygen transition barrier energies.51
3. Results and discussion
3.1 Crystal structure
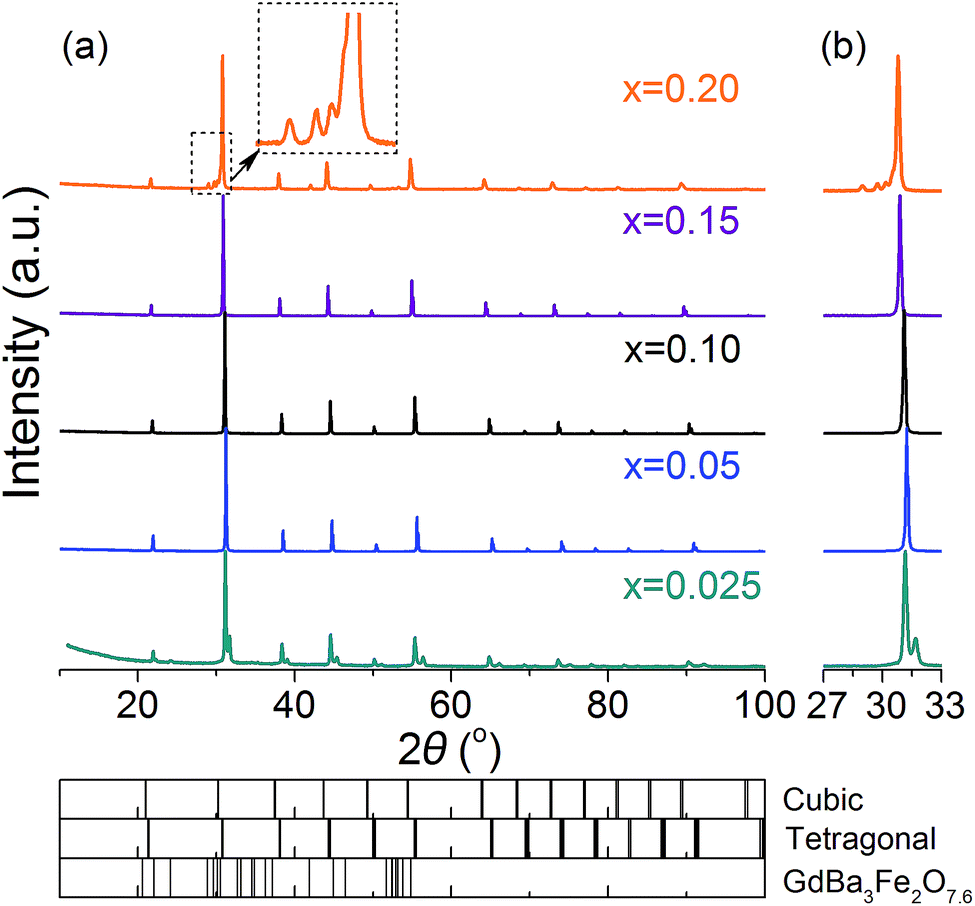
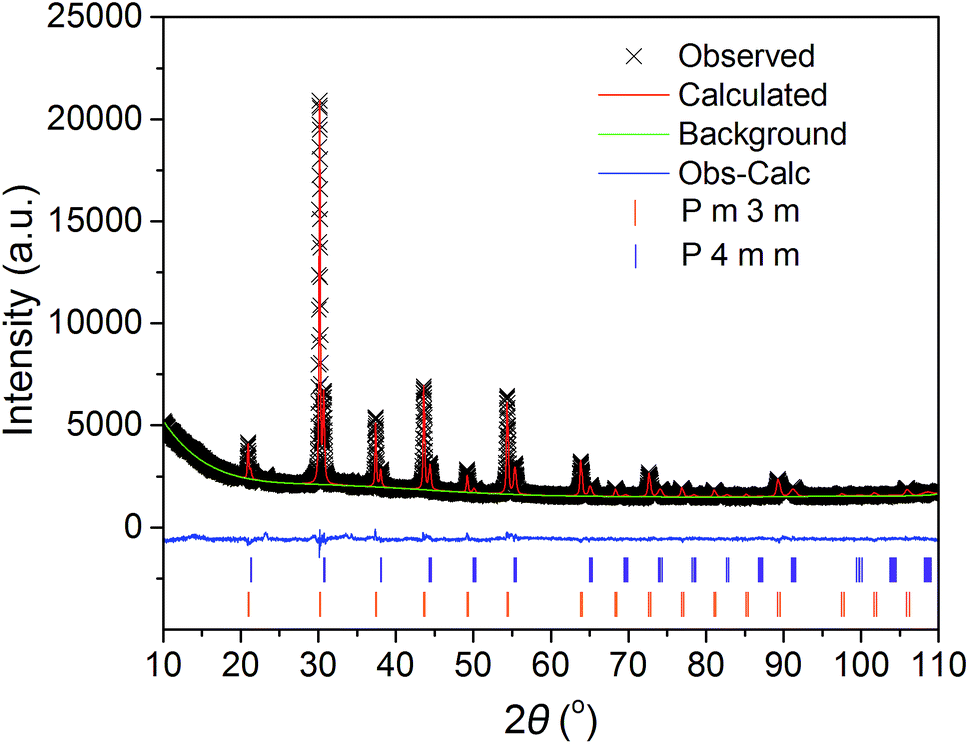
The crystal structure of the BaFe1−xGdxO3−δ (x = 0.025–0.20) membranes after being densified was examined by XRD measurements and the results are presented in Fig. 1. The major detected reflections of sample x = 0.025 can be indexed to the cubic perovskite structure, however, there is always a weak shoulder peak appearing to the right of them, indicating the existence of other phases. As a consequence of the big mismatch between the A/B-site cations (Ba and Fe), it is obvious that slight Gd doping cannot completely release the lattice distortion, resulting in the x = 0.025 sample having a set of complicated diffraction peaks. Rietveld refinement was performed on the XRD pattern (Fig. 2) and the results reveal that the sample x = 0.025 can be well indexed to a dual-phase composite with space groups Pm![[3 with combining macron]](https://www.rsc.org/images/entities/char_0033_0304.gif) m and P4mm. The fitted structural parameters of the cubic and tetragonal phases are listed in Table 1. The P4mm phase shows an octahedral tilting of a00a00c0+,52 which is very close to that of a cubic perovskite structure Pmm, suggesting that the lattice distortion is partially accommodated by doping 2.5 at% big Gd3+ at the B-site.
m and P4mm. The fitted structural parameters of the cubic and tetragonal phases are listed in Table 1. The P4mm phase shows an octahedral tilting of a00a00c0+,52 which is very close to that of a cubic perovskite structure Pmm, suggesting that the lattice distortion is partially accommodated by doping 2.5 at% big Gd3+ at the B-site.
 |
| | Fig. 1 XRD patterns for the as-prepared BaFe1−xGdxO3−δ (x = 0.025–0.20) materials. | |
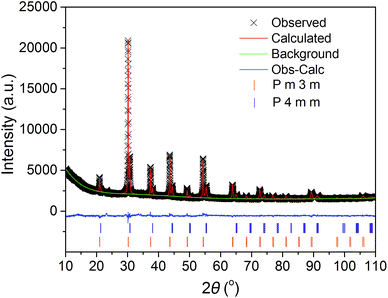 |
| | Fig. 2 Structure refinement of the BaFe0.975Gd0.025O3−δ sample before high temperature XRD at 25 °C. | |
Table 1 Refined structural parameters of BaFe0.975Gd0.025O3−δ. P4mm phase with a = 4.0033(4) Å and c = 4.0157(6) Å, and Pmm phase with a = 4.0725(2) Å. Rwp = 3.14%, Rp = 2.31%, and χ2 = 2.037
|
|
Atom |
Site |
x
|
y
|
z
|
Occupancy |
|
P4mm |
Ba |
1a |
0 |
0 |
0 |
1 |
| Fe |
1b |
0.5 |
0.5 |
0.498(14) |
0.975 |
| Gd |
1b |
0.5 |
0.5 |
0.498(14) |
0.025 |
| O1 |
1b |
0.5 |
0.5 |
0.083(9) |
1 |
| O2 |
2c |
0.5 |
0 |
0.554(9) |
1 |
|
Pmm |
Ba |
1a |
0 |
0 |
0 |
1 |
| Fe |
1b |
0.5 |
0.5 |
0.5 |
0.975 |
| Gd |
1b |
0.5 |
0.5 |
0.5 |
0.025 |
| O |
3c |
0 |
0.5 |
0.5 |
1 |
When the Gd doping level further increases to x = 0.05, the cubic perovskite structure is successfully stabilized at room temperature. The samples with x up to 0.15 show a single perfect cubic structure without any impurities. Some weak impurity reflections, however, are observed for the x = 0.20 sample on the left of the Miller index (110) of the cubic perovskite phase, as displayed in the magnified section of Fig. 1(a), which can be assigned to the GdBa3Fe2O7.6 phase (PDF: 48-0776). It is demonstrated that the solid solution limit of Gd in BaFe1−xGdxO3−δ is below 0.20 in the present experimental conditions. All of the XRD peaks shift gradually to a low degree angle with increasing the doping level from x = 0.05 to 0.15, as shown in Fig. 1(b) for the enlarged range 27–33°, confirming the incorporation of bigger Gd3+ cations into the B-site of the BaFeO3−δ sublattice.
The phase structure evolution of sample x = 0.025 was further evaluated by high temperature XRD measurement with a 10 °C min−1 heating/cooling rate. As shown in Fig. 3, the impurity reflections of the P4mm phase come to disappear gradually and merge into the peaks of the cubic perovskite Pmm phase when the temperature reaches 300 °C. The phase transformation temperature is notably decreased with Gd doping compared to the pristine BaFeO3−δ material.53 The cubic perovskite structure of sample x = 0.025 stays stable within the temperature range of oxygen permeation operation. During the cooling process, the sample maintains its high temperature-type cubic structure down to room temperature, different from its initial tetragonal state. This phenomenon is also observed in other reported work54 and is possibly related with the thermal treatment history of the samples. The membrane x = 0.025 after experiencing the oxygen permeation test at 900 °C also keeps a cubic structure (ESI Fig. S1†), which is consistent with the consecutive high temperature XRD results.
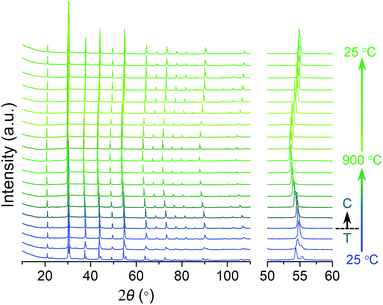 |
| | Fig. 3 High temperature XRD patterns of the BaFe0.975Gd0.025O3−δ sample. | |
With Rietveld refinement, the lattice parameters of different BaFe1−xGdxO3−δ samples (x = 0.025–0.20) are obtained and plotted in Fig. 4. In the case of sample x = 0.025, the data are derived from the cooling process to 25 °C (Fig. 3). A linear relationship could be sketched between x = 0.025 and 0.15, demonstrating that the change of the lattice parameters follows Vegard's rule.55 This is another indication that the Gd ions are successfully introduced into the lattice structure. For sample x = 0.20, there is an offset from the preceding linear relationship, which results from the actual lower Gd content in the lattice due to the co-existence of a Gd-enriched secondary phase GdBa3Fe2O7.6 (Fig. 1(a)).
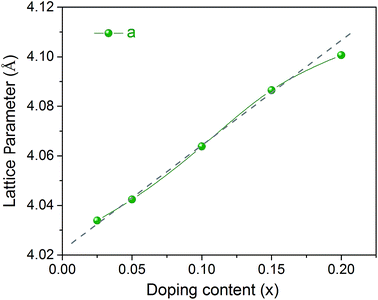 |
| | Fig. 4 Lattice parameters of the BaFe1−xGdxO3−δ samples (x = 0.025–0.20) as a function of Gd content. | |
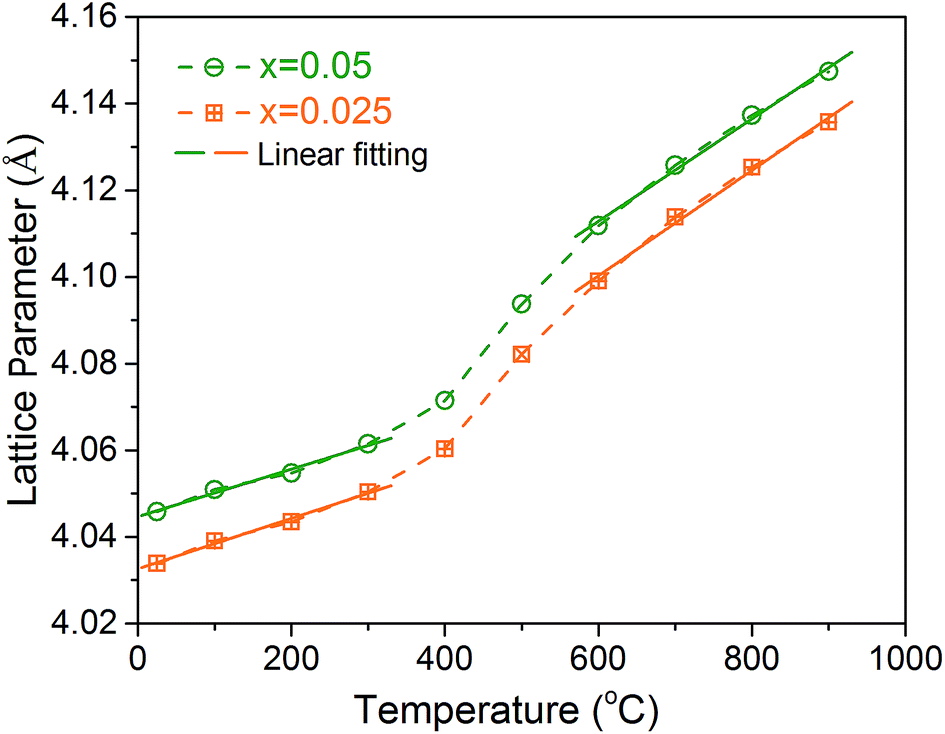
3.2 Temperature dependence of lattice parameters
To understand the lattice expansion behavior with temperature, the lattice parameters of the BaFe0.975Gd0.025O3−δ and BaFe0.95Gd0.05O3−δ samples at different temperatures were refined based on the high temperature XRD results during the cooling process. As presented in Fig. 5, both of them proceed in ascending order with increasing temperature and have a turning at about 400 °C. The thermal expansion coefficient (TEC) of each sample can be derived by fitting the lattice parameter plots in different temperature ranges. The calculated TEC values are summarized in Table 2, which are comparable with similar materials reported in the literature under the same testing conditions.15,54 The TEC values in the high temperature range (600–900 °C) are always larger than these in the low temperature range for both samples. The abrupt increase of the TEC around 500 °C is a common phenomenon for most mixed ionic and electronic conductors (MIECs).53,54 It is ascribed to the lattice oxygen release at high temperature,15,31 which generates more oxygen vacancies and causes electrostatic repulsion between two neighbour B-site cations. Meanwhile, the lattice oxygen loss will induce the valence decrease of Fe ions as the charge compensation, resulting in an ionic radius increase.30 Both of them are responsible for the increase in the TEC values. Fortunately, Gd doping decreases the TEC values of BaFeO3-based materials, as shown in Table 2, probably due to the strong Gd–O bond and thus suppresses oxygen release as confirmed by the following TGA test (Section 3.3). Additionally, it is worth noting that the TECs obtained from the HT-XRD results based on the calculation of lattice parameters would be larger than the test values of the densified samples by the thermal dilatometer, because of no buffer of the subsistent holes.
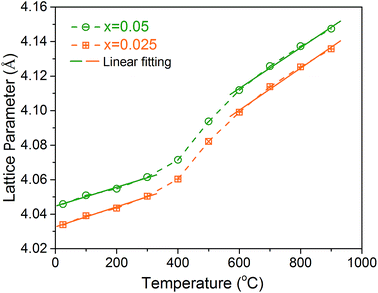 |
| | Fig. 5 Temperature dependence of lattice parameters of the BaFe0.975Gd0.025O3−δ and BaFe0.95Gd0.05O3−δ samples. | |
Table 2 Fitted TEC values of samples BaFe0.975Gd0.025O3−δ and BaFe0.95Gd0.05O3−δ in different temperature ranges
|
x
|
TEC (10−6 K−1) |
| 25–300 °C |
600–900 °C |
| 0.025 |
14.4 |
29.7 |
| 0.05 |
13.5 |
28.8 |
3.3 Thermogravimetric analysis and oxygen non-stoichiometric measurement
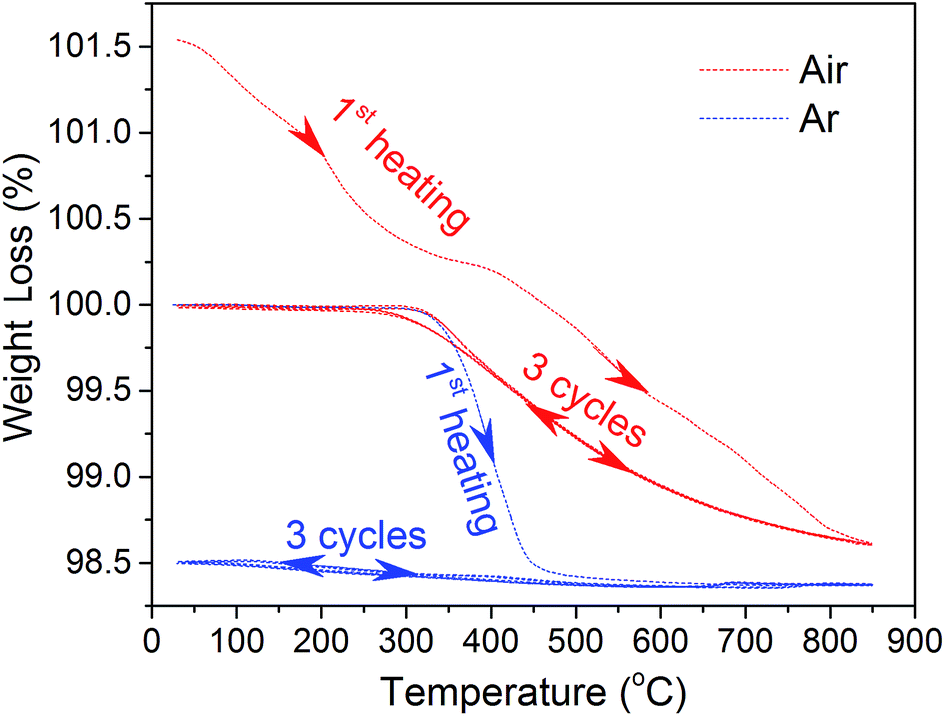
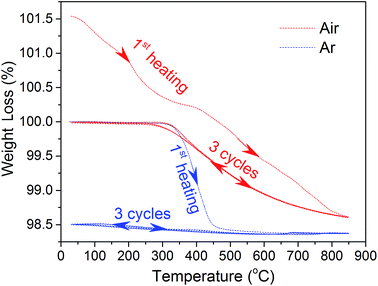
To further elucidate the thermal-induced oxygen release process, the weight change of sample x = 0.025 was examined under air and Ar atmospheres for three cycles. As shown in Fig. 6, the weight firstly decreases with temperature in air before 350 °C, and then reaches a brief stabilization, which is followed by continuous weight loss until to 850 °C. With the decreasing temperature, the weight of the sample is slowly restored from the lowest point and gets to a long platform from about 350 °C down to room temperature. The weight loss in the low temperature range cannot be regained with cycling in air, while that occurring in the high temperature range is restored. The initial irreversible weight loss at low temperatures is ascribed to various surface adsorbates such as CO2 and H2O during sample storage.56 After that, the sample was applied for another two thermal cycles in air followed by three more thermal cycles in high purity Ar gas. A very good reversibility of weight change was observed for the thermal cycles in air. The weight of the sample stays unchanged before 350 °C because all adsorbates have been removed during the first cycle in air. With a further rising temperature, the sample has a weight loss starting at the same temperature (350 °C), which is coincident with the inflection point of the lattice parameter change upon temperature (Fig. 5). By switching to Ar atmosphere with a much lower oxygen partial pressure, the weight loss process is sped up and intensified compared to the cycle in air, and the sample weight quickly becomes stable. Additionally, during cooling from high temperature, the weight remains fairly stable and stays unchanged even down to room temperature, which is because of the extremely low oxygen concentration in Ar atmosphere. It is reasonable to conclude that the weight loss/regain at about 350 °C is related to the oxygen release/uptake, which is consistent with the aggravated thermal expansion at around 400 °C (Fig. 5). It should be mentioned that after the first heating processes in either atmosphere, the sample presented completely reversible weight changes during thermal cycling, implying that the sample has excellent structural stability.
 |
| | Fig. 6 Weight changes of BaFe0.975Gd0.025O3−δ in air and Ar atmosphere for 3 thermal cycles. | |
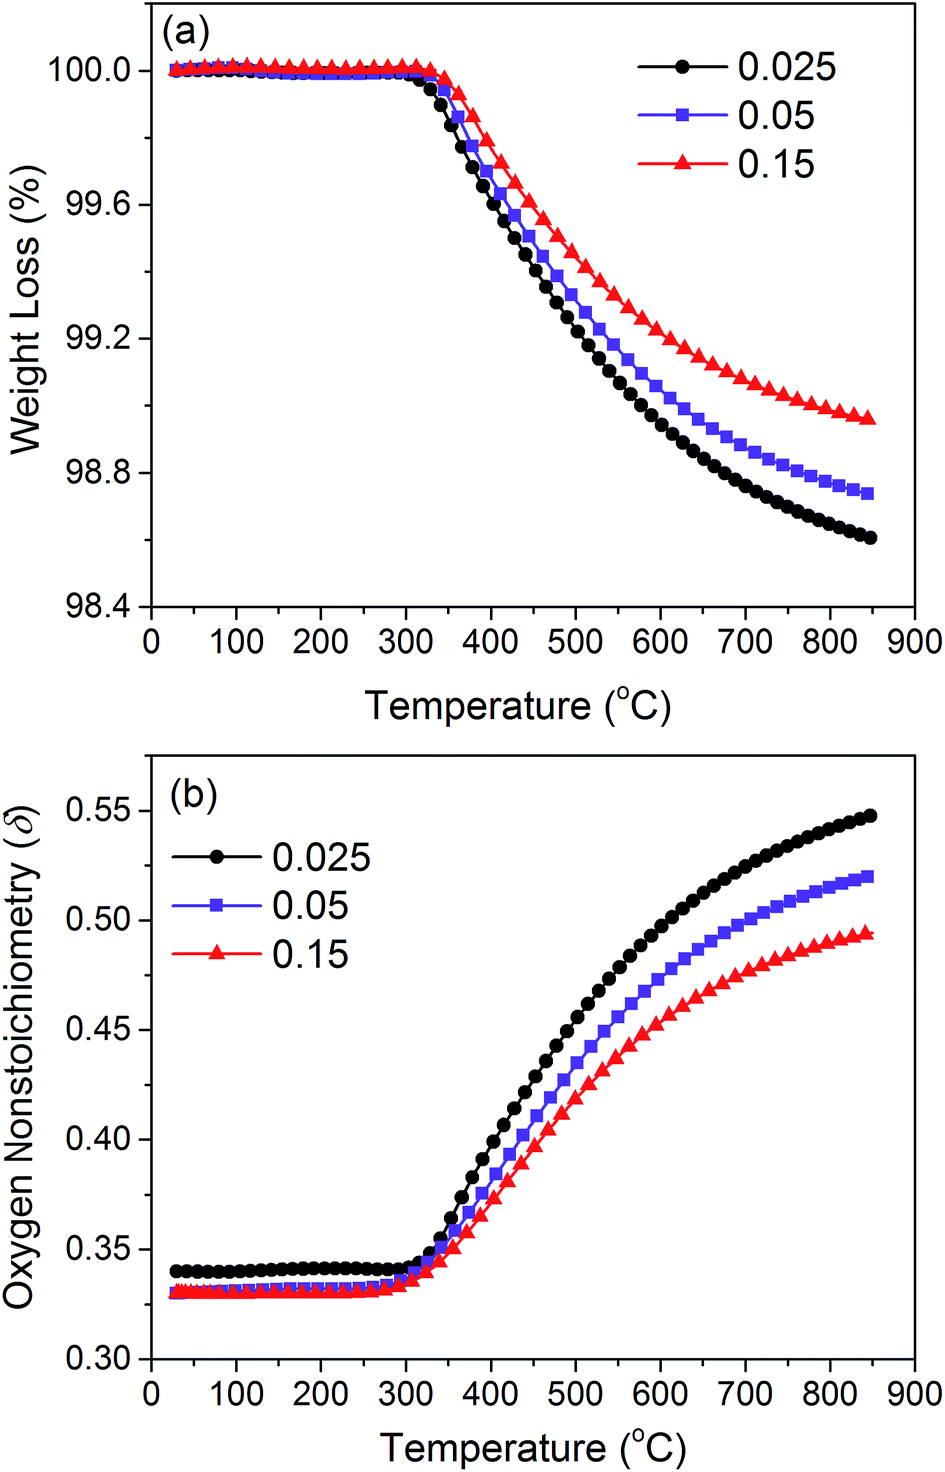
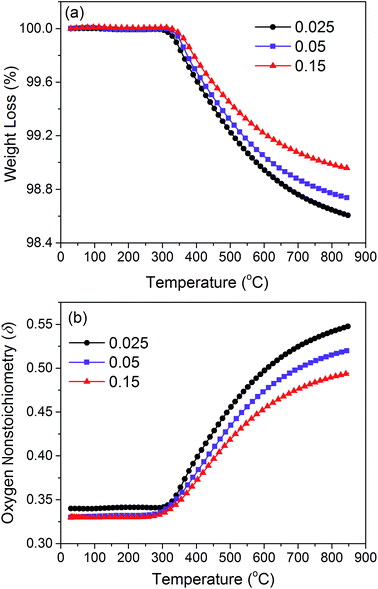
The lattice oxygen release would not only cause thermal expansion, but also exerts effects on the material structural stability by changing the oxygen vacancy concentration. TGA measurements were performed on samples x = 0.025, 0.05 and 0.15 in air to investigate the impacts of Gd doping on these characteristics. In order to exclude the influence of surface adsorption, the weight changes during the cooling process were taken into consideration. The results are shown in Fig. 7(a). With the increase of Gd content, the lattice oxygen release process is significantly decreased, which is beneficial for improving the structural stability and decreasing the thermal expansion coefficients.
 |
| | Fig. 7 (a) Weight and (b) oxygen non-stoichiometry changes of samples x = 0.025, 0.05, and 0.15 with temperature. | |
By employing the iodometric titration technique, the initial oxygen non-stoichiometric values of the investigated samples were determined (Table 3), which show almost the same values at room temperature. The calculated average valency of Fe ions for each sample indicates that the Gd substitution for Fe cations is charge compensated by increasing the B-site valence rather than the oxygen vacancy generation. With the weight change data shown in Fig. 7(a) and the initial oxygen non-stoichiometry listed in Table 3, the change of oxygen non-stoichiometry at high temperatures can be calculated according to eqn (1) as presented in Fig. 7(b). Fewer oxygen vacancies are generated during the thermal reduction process with doping more Gd3+ ions. From a defect chemistry point of view, Gd3+ doping is expected to increase the oxygen vacancy concentration considering its lower valence compared to the average valence of Fe3+/4+ ions. The decreased oxygen vacancy concentration most likely results from the stronger bond strength of Gd–O (719 kJ mol−1) than Fe–O (390.4 kJ mol−1),57 which exerts strong attraction on oxygen anions and limits the lattice oxygen release. The slight substitution of Gd (x = 0.025) gives a high oxygen non-stoichiometry of δ = 0.54 at 850 °C and therefore is expected to show high oxygen permeability.
Table 3 Oxygen non-stoichiometry and average valence of Fe in the studied BaFe1−xGdxO3−δ (x = 0.025, 0.05 and 0.15) at different temperatures. Δδ and Δ![[N with combining macron]](https://www.rsc.org/images/entities/i_char_004e_0304.gif) are the differences of corresponding values between 25 °C and 850 °C. δ at 25 °C is determined by iodometric titration and the values at high temperature are derived from TGA curves
are the differences of corresponding values between 25 °C and 850 °C. δ at 25 °C is determined by iodometric titration and the values at high temperature are derived from TGA curves
|
x
|
Oxygen non-stoichiometry (δ) |
Average valence of Fe () |
| 25 °C |
800 °C |
850 °C |
Δδ |
25 °C |
800 °C |
850 °C |
Δ |
| 0.025 |
0.34 |
0.54 |
0.55 |
0.21 |
3.33 |
2.92 |
2.90 |
0.43 |
| 0.05 |
0.33 |
0.52 |
0.52 |
0.19 |
3.36 |
2.96 |
2.96 |
0.40 |
| 0.15 |
0.33 |
0.49 |
0.49 |
0.16 |
3.40 |
3.02 |
3.02 |
0.38 |
3.4 Oxygen ion bulk diffusion and surface exchange
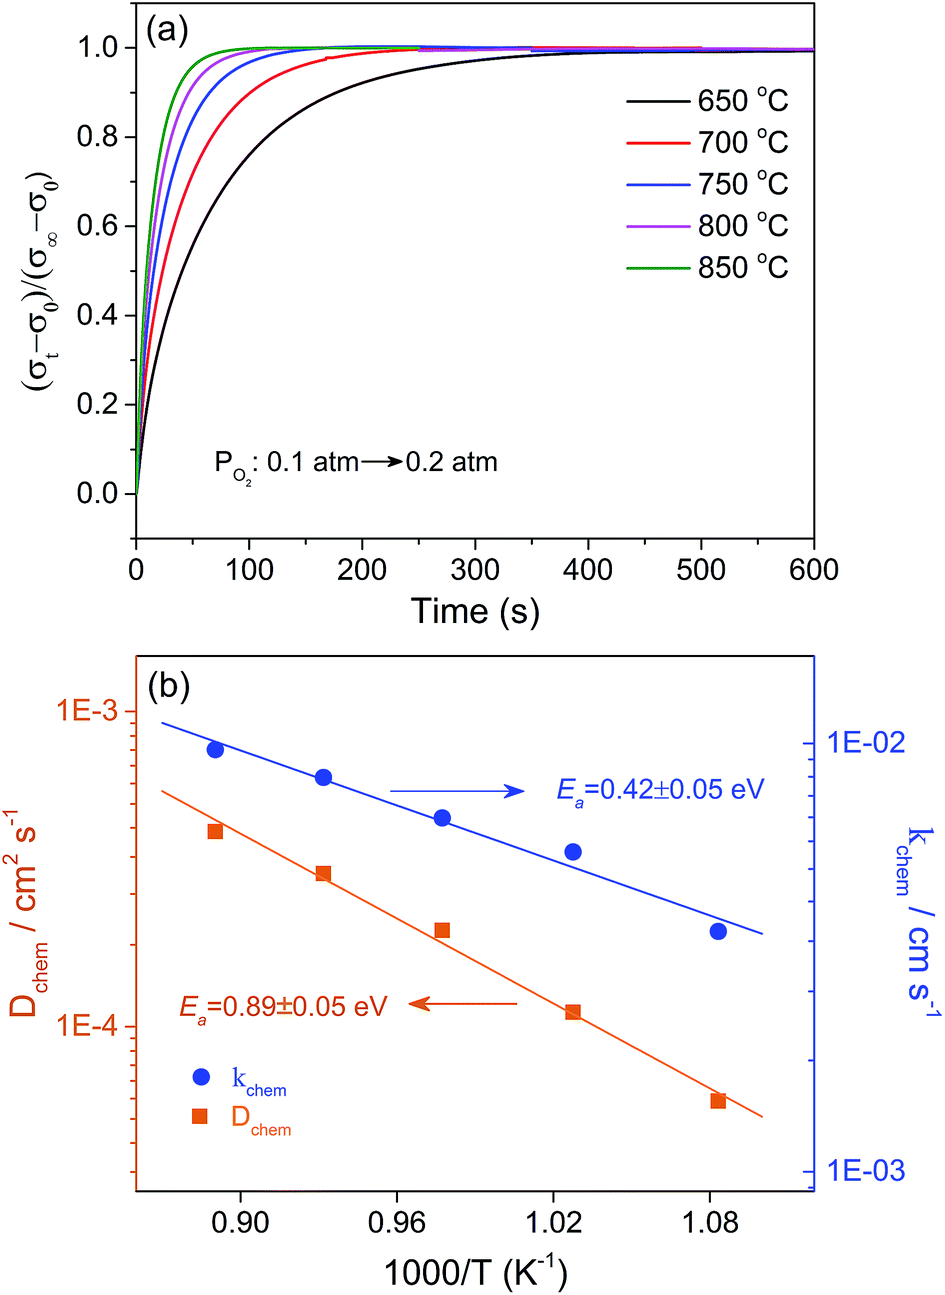
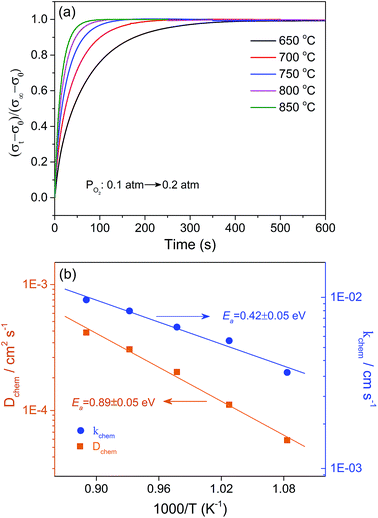
Besides the oxygen vacancy concentration, the oxygen ion diffusion and surface exchange kinetics are two other crucial factors that affect the oxygen permeability of ceramic membranes. The oxygen bulk diffusion coefficient (Dchem) and surface exchange coefficient (kchem) were determined by the ECR method. The measured ECR response curves of the dense sample BaFe0.975Gd0.025O3−δ and the temperature dependence of the fitted Dchem and kchem from 650 to 850 °C are depicted in Fig. 8. Both parameters increase with temperature, indicating the thermal activation feature of these two processes. The derived activation energies for oxygen ion migration and the surface oxygen exchange process are 0.42 ± 0.04 and 0.89 ± 0.05 eV, respectively. Dchem and kchem at 800 °C are 3.06 × 10⁻⁴ cm2 s−1 and 8.33 × 10⁻³ cm s−1, which are comparable with those of some advanced perovskite materials, such as SrCo1−xScxO3−δ and BSCF,58,59 indicating the favourable oxygen diffusivity and surface catalytic activity of the B-site 2.5 at% Gd-doped material. The good kinetics performance is closely related to the stabilized cubic perovskite structure, expanded lattice and high oxygen vacancy concentration, which are preferred for achieving good oxygen permeability.
 |
| | Fig. 8 (a) ECR response curves of BaFe0.975Gd0.025O3−δ after a sudden change of oxygen partial pressure from 0.1 to 0.2 atm in the temperature range of 650–850 °C, and (b) the temperature dependence of the fitted Dchem and kchem. | |
3.5 Electrical conductivity
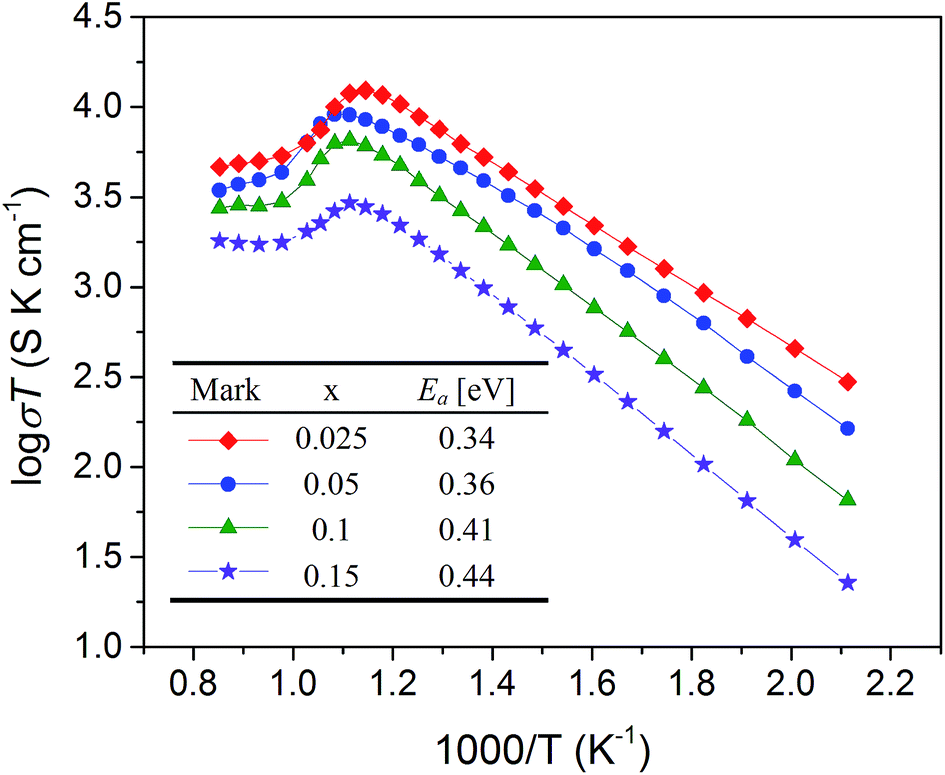
The electronic and oxygen ionic conductivities are two essential core properties that provide the basis for oxygen permeation in MIEC membranes. For most perovskite-type MIEC materials, the electronic conductivity is always much higher than the oxygen ionic conductivity.31 Thus, the electrical conductivities of the BaFe1−xGdxO3−δ (x = 0.025–0.15) samples in air tested by four-terminal DC measurements can be approximately considered as the electronic conductivity alone. As shown in Fig. 9, the electronic conductivities increase with temperature and follow a linear relationship in Arrhenius plots between 200 and 600 °C, implying that the small polarons take a conductive role via B–O–B transmission paths with respect to a mechanism known as the Zener double exchange.23 After reaching the highest point, the electrical conductivities begin to decrease due to the release of lattice oxygen, as certified by the high temperature XRD and TGA measurements, which is caused by the annihilation of electron holes and the generation of oxygen vacancies. With increasing the Gd doping level, the electronic conductivities decrease because of the enhanced obstruction of the fixed valence dopant (Gd3+) in B–O–B conduction paths for the Zener double exchange mechanism. The activation energies for electron conduction, fitted from the linear Arrhenius plots, increase with increasing Gd doping, as shown in the inset table of Fig. 9. This is attributed to the interference of Gd3+ ions in the B–O–B hopping route and the growing length of the B–O bond resulting from lattice expansion upon Gd substitution.
 |
| | Fig. 9 Temperature dependence of electronic conductivities of sample BaFe1−xGdxO3−δ (x = 0.025–0.15) in air. | |
3.6 Oxygen permeation flux
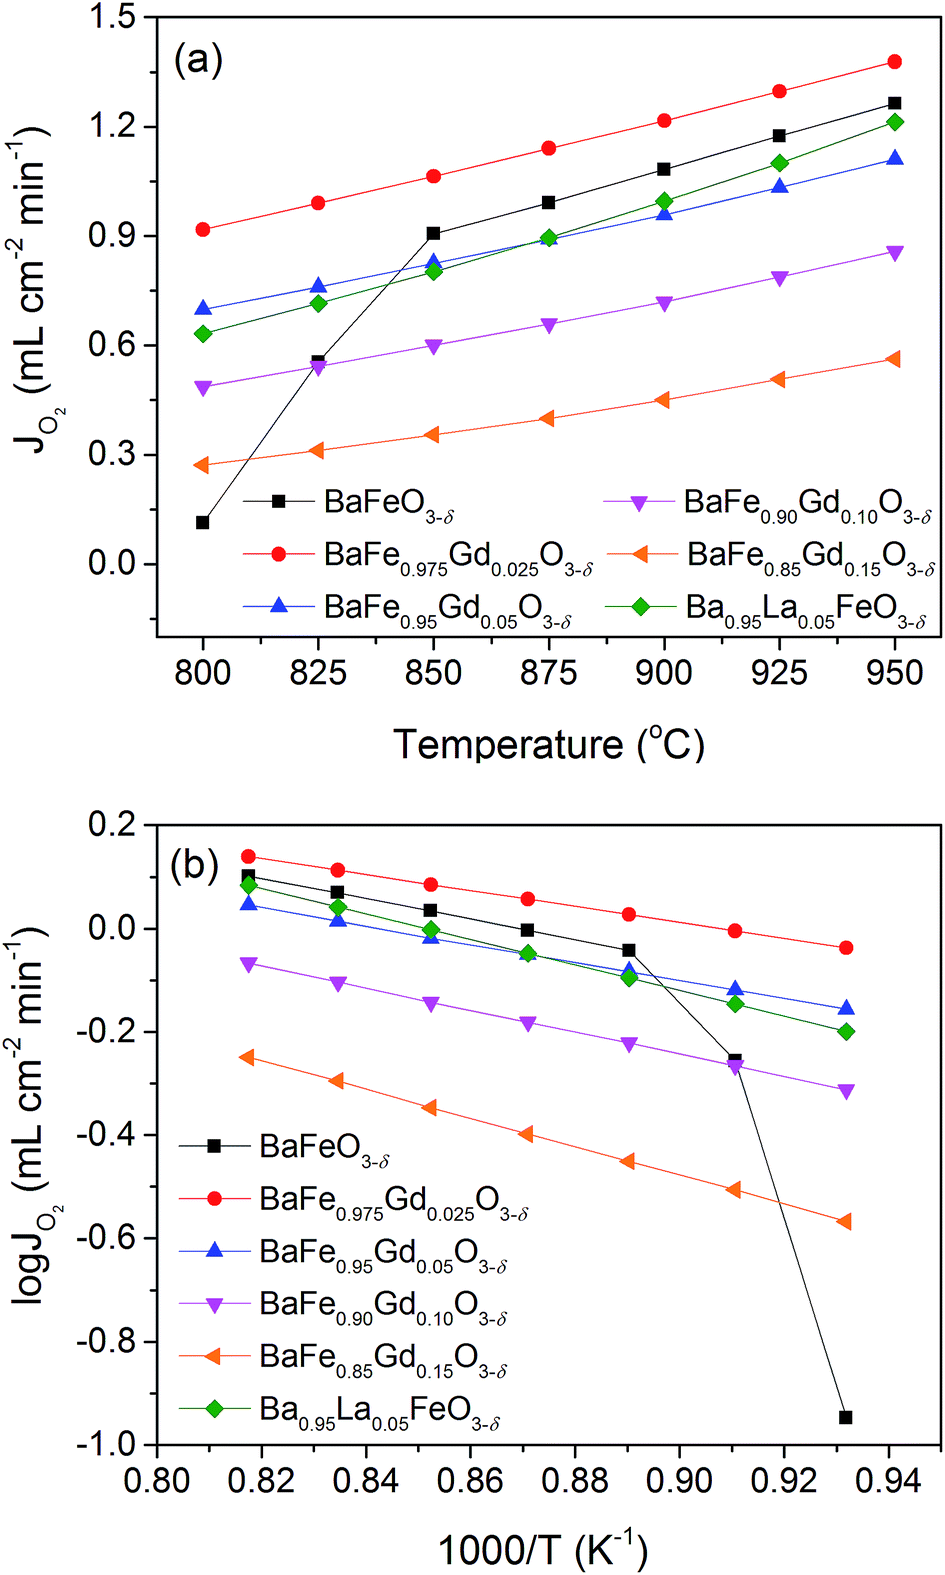
The oxygen permeation flux was tested on well densified pellets with 1 mm thickness under conditions of 60/120 mL min−1 He/air from 800 to 950 °C. The oxygen permeation fluxes of the Gd-doped membranes increase with temperature gradually, as shown in Fig. 10(a). For the series of samples BaFe1−xGdxO3−δ (x = 0.025–0.15), the oxygen permeability decreases with Gd doping and presents the highest value of 1.37 mL cm−2 min−1 for the x = 0.025 membrane at 950 °C. This should be closely related with the content of oxygen vacancy concentration, as shown in Table 3. With respect to the pristine BaFeO3−δ membrane, it exhibits a very low permeability at 800 °C but shows a sudden increasing trend in 800–850 °C, which should be on account of phase transformation from a hexagonal structure character with low oxygen ionic conductivity to the cubic perovskite structure with high ionic conductivity. The BaFeO3−δ membrane delivers oxygen permeation fluxes after 850 °C higher than samples x = 0.05–0.15 while still lower than that of the x = 0.025 sample. Meanwhile, the good performing Ba0.95La0.05FeO3−δ membrane was also prepared in our laboratory in order to make a comparison with the investigated Gd-doped materials.34 As depicted in Fig. 10(a), the oxygen permeability of the Ba0.95La0.05FeO3−δ membrane is comparable with that of BaFe0.95Gd0.05O3−δ, but obviously lower than that of BaFe0.975Gd0.025O3−δ.
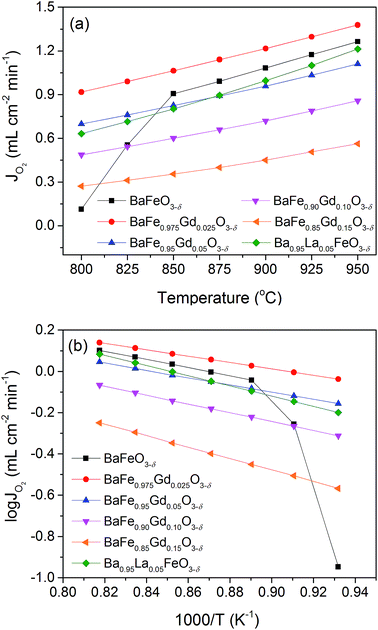 |
| | Fig. 10 Temperature dependence of oxygen permeation fluxes of samples BaFe1−xGdxO3−δ (x = 0–0.15) and Ba0.95La0.05FeO3−δ (a), and the corresponding Arrhenius plots (b). | |
To gain insight into the Gd doping effect on oxygen migration inside the membranes, the corresponding Arrhenius plots are derived and illustrated in Fig. 10(b). The good linear regularities of these data demonstrate that a single mechanism controls the oxygen permeation in these conditions. Since the membrane thickness (1 mm) in the oxygen permeation experiments is larger than the calculated characteristic thickness (Lc = Dchem/kchem) of 0.37 and 0.44 mm from ECR measurements at 800 and 850 °C, the limiting step for oxygen permeation should be the oxygen migration process. Thus, the calculated oxygen permeation activation energies by fitting the corresponding Arrhenius plots (Fig. 10) should correspond to the oxygen bulk diffusion process as shown in Fig. 11. It has to be mentioned that the discrepancy in activation energy derived from the oxygen permeation with that from Dchem for the x = 0.025 sample may be explained by the highly different oxygen gradients of the oxygen potentials in the two methods.60–63
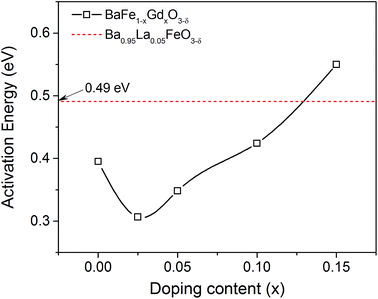 |
| | Fig. 11 Comparison of calculated oxygen permeation energies between the BaFe1−xGdxO3−δ (x = 0–0.15) and Ba0.95La0.05FeO3−δ membranes. | |
As shown in Fig. 11, the oxygen permeation activation energy is decreased by the substitution of 2.5 at% Gd for Fe, but tends to increase gradually from 0.31 to 0.55 eV once the content of the stabilizing cubic perovskite structure is reached. It seems to be coincide with the increasing average bond strength of the material upon Gd concentration, which is unfavourable for oxygen migration. Interestingly, the oxygen permeation activation energy of sample x = 0.025 is lower than that of BaFeO3−δ (Ea = 0.40 eV) and even the good performing Ba0.95La0.05FeO3−δ (Ea = 0.49 eV) with excellent oxygen permeability. A similar effect of large B-site ions on the oxygen permeation activation energy can be found in the published works of Ce- and Y-doped BaFeO3−δ materials.20,32
In contrast to the smaller ion substitution at the A-site for stabilizing the cubic perovskite structure, the B-site substitution of Fe3+/4+ ions by larger ions would expand the crystal structure with increasing the lattice free volume and critical radius.30,64 Considering the migration of oxygen in the lattice, both parameters are closely associated with the oxygen migration barrier energy, because the values of them represent how much space and how large a saddle point the structure can offer for oxygen migration. Therefore, the oxygen permeability of the B-site Gd3+-doped membrane would have great advantages of the large lattice free volume and big critical radius in contrast to the Ba0.95La0.05FeO3−δ membrane. The calculated oxygen permeation activation energies confirm that the 5 at% La-doped material does really have a higher oxygen permeation energy than the Gd-doped material (x = 0.025–0.10), and even than that of the pristine BaFeO3−δ one. The decreased activation energy of oxygen permeation of the B-site Gd-doped materials would be favourable for oxygen permeability, especially for these x = 0.025 and 0.05 membranes. However, more Gd doping may deteriorate the oxygen permeability, such as in the x = 0.10 and 0.15 membranes. In this case, some other factors, such as the stronger bond strength of Gd–O and the decreased oxygen vacancy concentration would transcend the promotion on oxygen migration by expanding the lattice and be detrimental for the oxygen permeability.
3.7 First principles calculation
First principles computation was applied to calculate the oxygen migration barrier energies in both doped and pristine BaFeO3 lattices with the aim of elucidating the effects of Gd doping on oxygen ion migration. A 2 × 2 × 2 supercell of Ba8Fe7GdO24 with substituting one Gd for an Fe atom was built, as shown in Fig. 12. For comparison, a 2 × 2 × 2 supercell for a pristine BaFeO3 lattice was also constructed. Instead of there being only one kind of oxygen anion/vacancy occupation circumstance in the pristine BaFeO3 lattice, those anions/vacancies in Ba8Fe7GdO24 supercells can be classified into three kinds of categories depending on the different octahedral coordination environments, which can be denoted as O1/VO1, O2/VO2 and O3/VO3 according to the distance from Gd cations, respectively. The possible oxygen ion transport paths between different kinds of oxygen anions and vacancies in Ba8Fe7GdO24 are illustrated in Fig. 12, and the corresponding migration barrier energies are calculated and listed in Table 4.
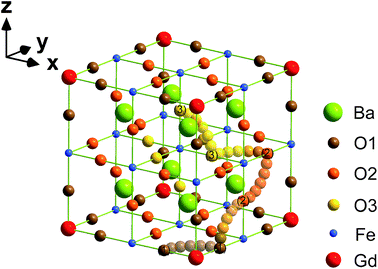 |
| | Fig. 12 Possible oxygen ion transport paths in a Ba8Fe7GdO24 supercell. | |
Table 4 Calculated oxygen ion migration barrier energies for different transport paths in a Ba8Fe7GdO24 supercell
|
|
Migration barrier energy (eV) |
| VO1 |
VO2 |
VO3 |
| O1 |
1.62 |
0.99 |
|
| O2 |
0.17 |
0.51 |
0.35 |
| O3 |
|
0.78 |
0.49 |
The two highest barrier energy values come from the migration of oxygen from O1 to neighbouring VO1 and VO2, with the energies of 1.62 and 0.99 eV, respectively. They are much higher than those through other paths in the supercell Ba8Fe7GdO24 and even higher than that in the pristine BaFeO3 lattice (0.91 eV). Meanwhile, the migration barrier for O2 transporting to VO1 has a much lower energy of 0.17 eV. It suggests that the Gd cations strongly attract oxygen ions to get closer, and limit the migration of the closest O1 atoms to the neighbouring vacancy positions. Nevertheless, the oxygen migration barrier energies involved in Gd cations are lower than those in the pristine lattices of 0.91 eV and also comparable with the 0.60 eV in SrCoO3, 0.42 eV in BSCF and 0.44 eV in La0.6Sr0.4Co0.2Fe0.8O3−δ.65–68 The results imply that a proper amount of Gd doping can facilitate the oxygen transport process due to the presence of these favourable migration paths, while too much Gd substitution may transcend the improvement in oxygen migration and impede the oxygen diffusion due to the attraction on oxygen anions. The complex contradictions between the structural factor and oxygen migration features need to be carefully studied.
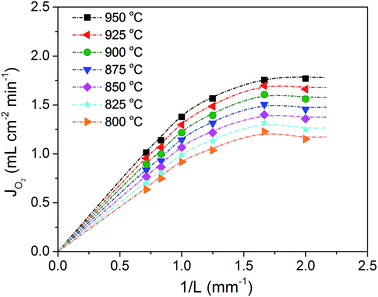
3.8 Thickness dependence of oxygen permeation and long term stability
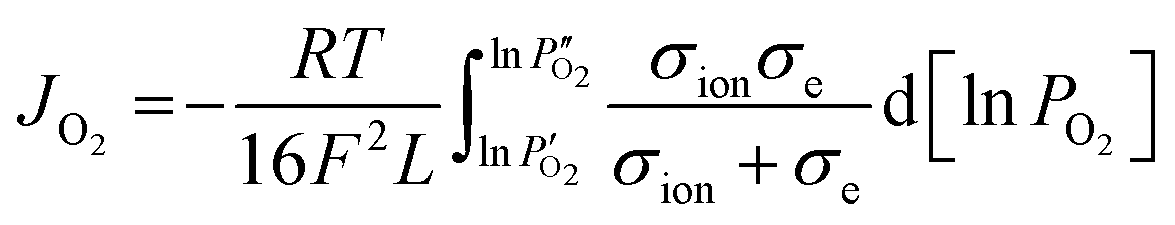
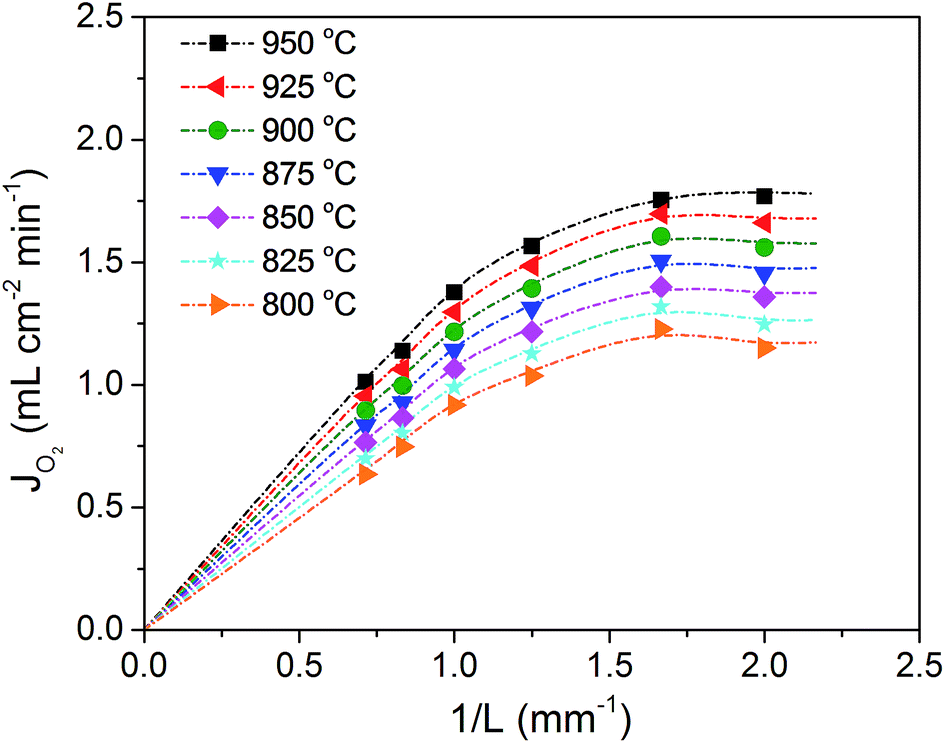
The dependence of oxygen permeation flux of BaFe0.975Gd0.025O3−δ on membrane thickness was investigated and the result is shown in Fig. 13. The oxygen permeation flux increases linearly with the reciprocal of membrane thickness in the thickness range from 1.5 mm to 1.0 mm, while it shows a curved increasing trend on further decreasing the thickness, and even remains unchanged once below 0.6 mm. This is described in the Wagner eqn (3):| |  | (3) |
where R, F, T, L, σe, σion, P′O2 and P′′O2 denote the gas constant, Faraday constant, temperature, thickness of the membrane, electronic conductivity, ionic conductivity, and the oxygen partial pressure on the feed side and on the sweep side, respectively. If the oxygen bulk diffusion takes a dominant role, the oxygen permeation flux is inversely proportional to the membrane thickness under a constant oxygen partial pressure gradient. Otherwise, the surface oxygen exchange process would come to play an important role if the membrane thickness is thin enough. As a result, a deviation of oxygen flux from the linear trend with a much slower increase in rate will be observed upon thickness reduction. The results shown in Fig. 13 demonstrate that the surface exchange comes to be the rate limiting process when the thickness is reduced below 0.6 mm, which presents a little difference with the results derived from ECR measurements. This difference should be also associated with the testing conditions: one is in a static environment while another is under kinetic conditions.
 |
| | Fig. 13 Oxygen permeation flux of the BaFe0.975Gd0.025O3−δ membranes with different thicknesses. | |
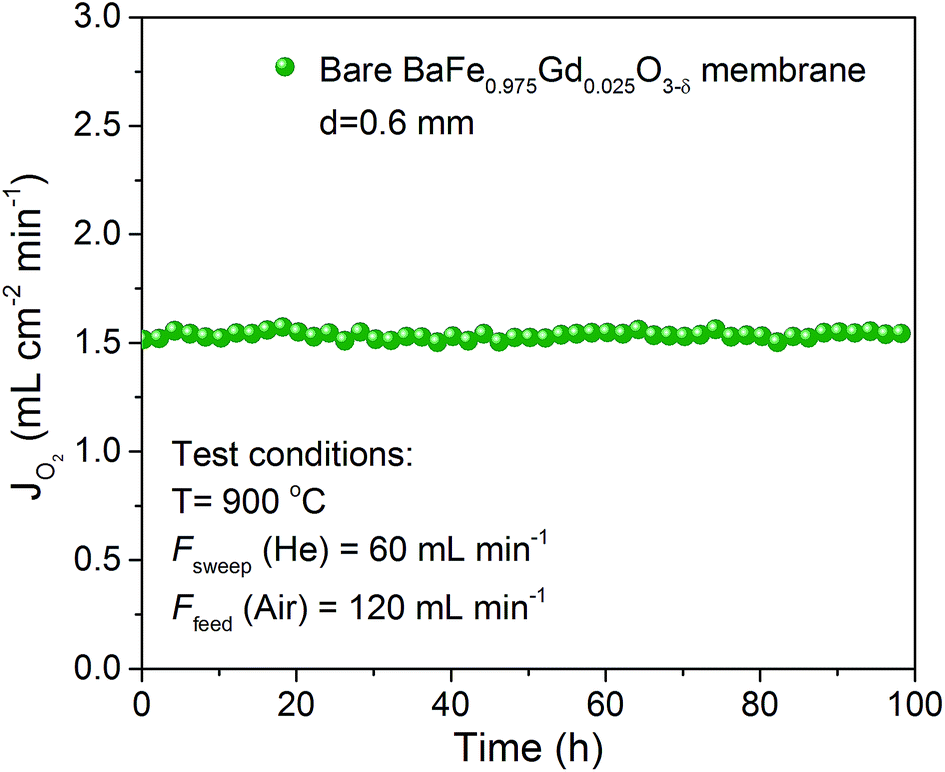
Long term stability is a crucial factor for the practical application of oxygen permeation membranes. The BaFe0.975Gd0.025O3−δ membrane with 0.6 mm thickness was operated under He/air atmosphere at 900 °C for 100 h to examine the long term stability performance and the results are presented in Fig. 14. The oxygen permeability can remain stable with no attenuation under low oxygen partial pressure conditions at a high temperature for 100 h, implying good long term stability of the slight Gd-doped BaFeO3−δ membrane.
 |
| | Fig. 14 Long term oxygen permeation performance of the BaFe0.975Gd0.025O3−δ membrane with 0.6 mm thickness at 900 °C. | |
3.9 Structural and chemical stability
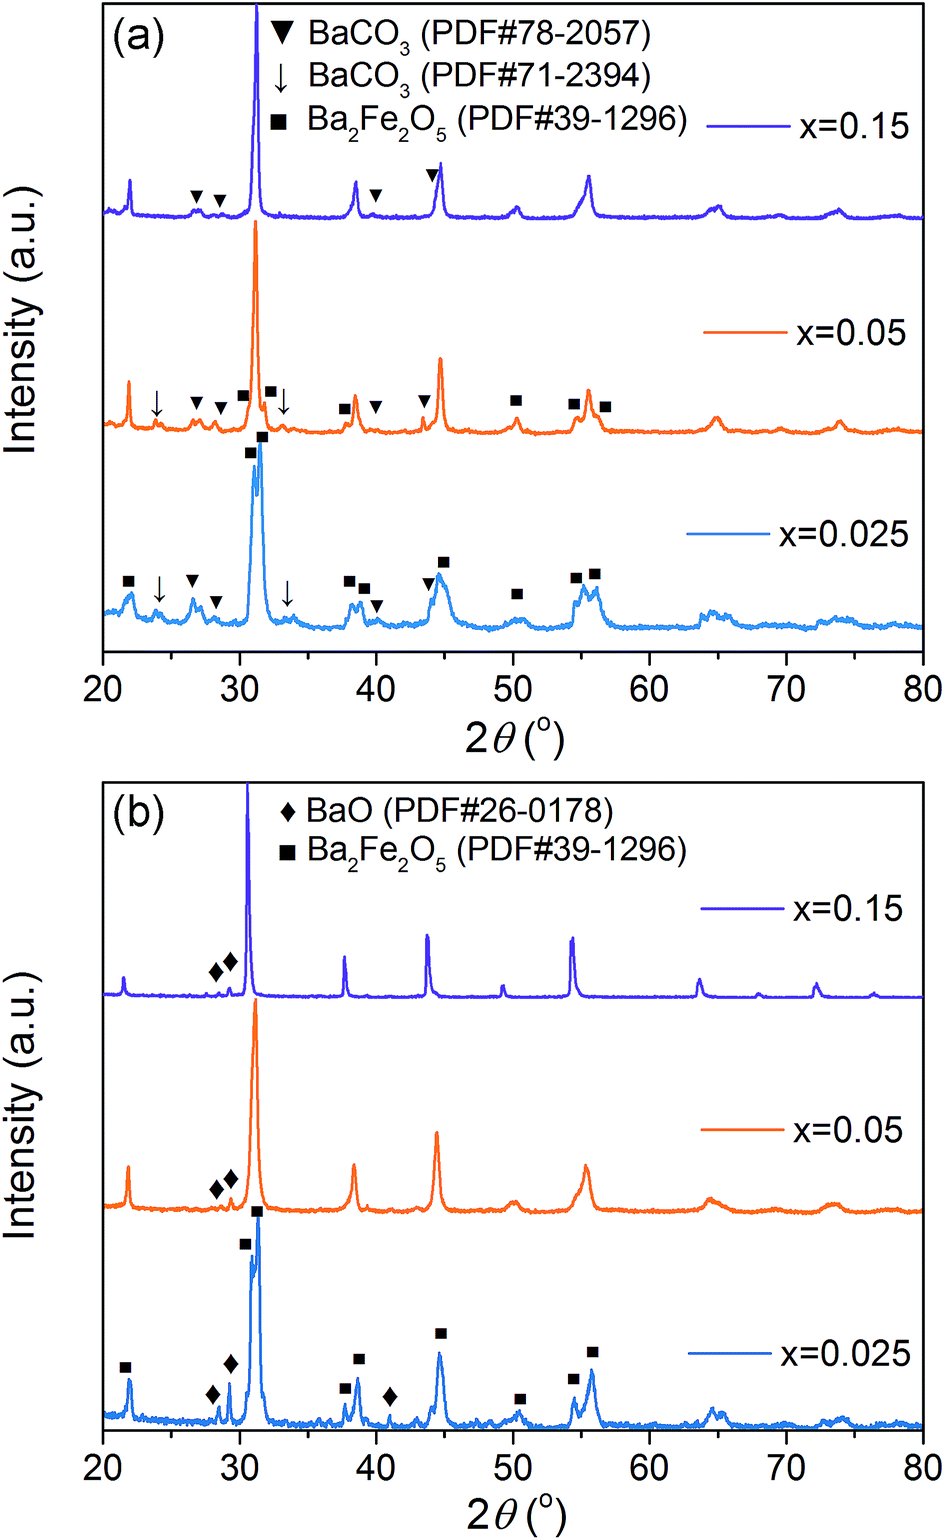
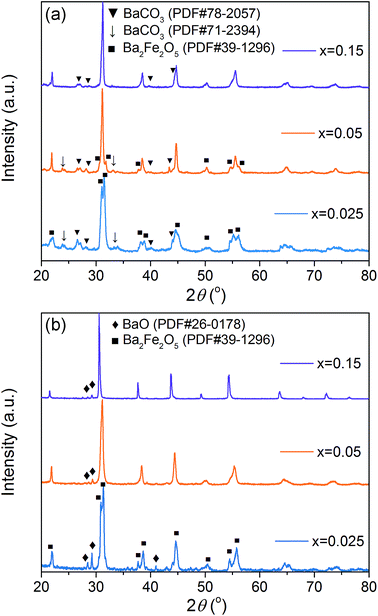
The structural and chemical stability of the materials in atmosphere containing H2O and CO2 is also a key requirement for oxygen separation membranes.69 The membranes of x = 0.025, 0.05 and 0.15 were subjected to heat treatment in a furnace at 900 °C for 10 h under 10 vol% CO2/N2 and 7.5 vol% H2O/N2 atmospheres. The structure and surface morphology of these treated membranes were examined by XRD and SEM to evaluate their structural and chemical stability. As shown in the XRD patterns (Fig. 15), some impurity phases of BaCO3 and Ba2Fe2O5 were observed in the sample treated in 10 vol% CO2/N2. With increasing the Gd doping content, the impurity phases were remarkably decreased and only some weak impurity peaks were detected for samples x = 0.05 and 0.15. For the case of treating in 7.5 vol% H2O/N2, impurity phases of BaO and Ba2Fe2O5 were present. Similarly, Gd doping enhances significantly the resistance of the materials against steam corrosion. Only a trace number of impurities can be detected for samples x = 0.05 and 0.15, and the perovskite structure is mainly maintained.
 |
| | Fig. 15 Surface XRD patterns of the BaFe1−xGdxO3−δ membranes with x = 0.025, 0.05 and 0.15 membranes treated (a) in 10 vol% CO2/N2 and (b) in 7.5 vol% H2O/N2 at 900 °C for 10 h. | |
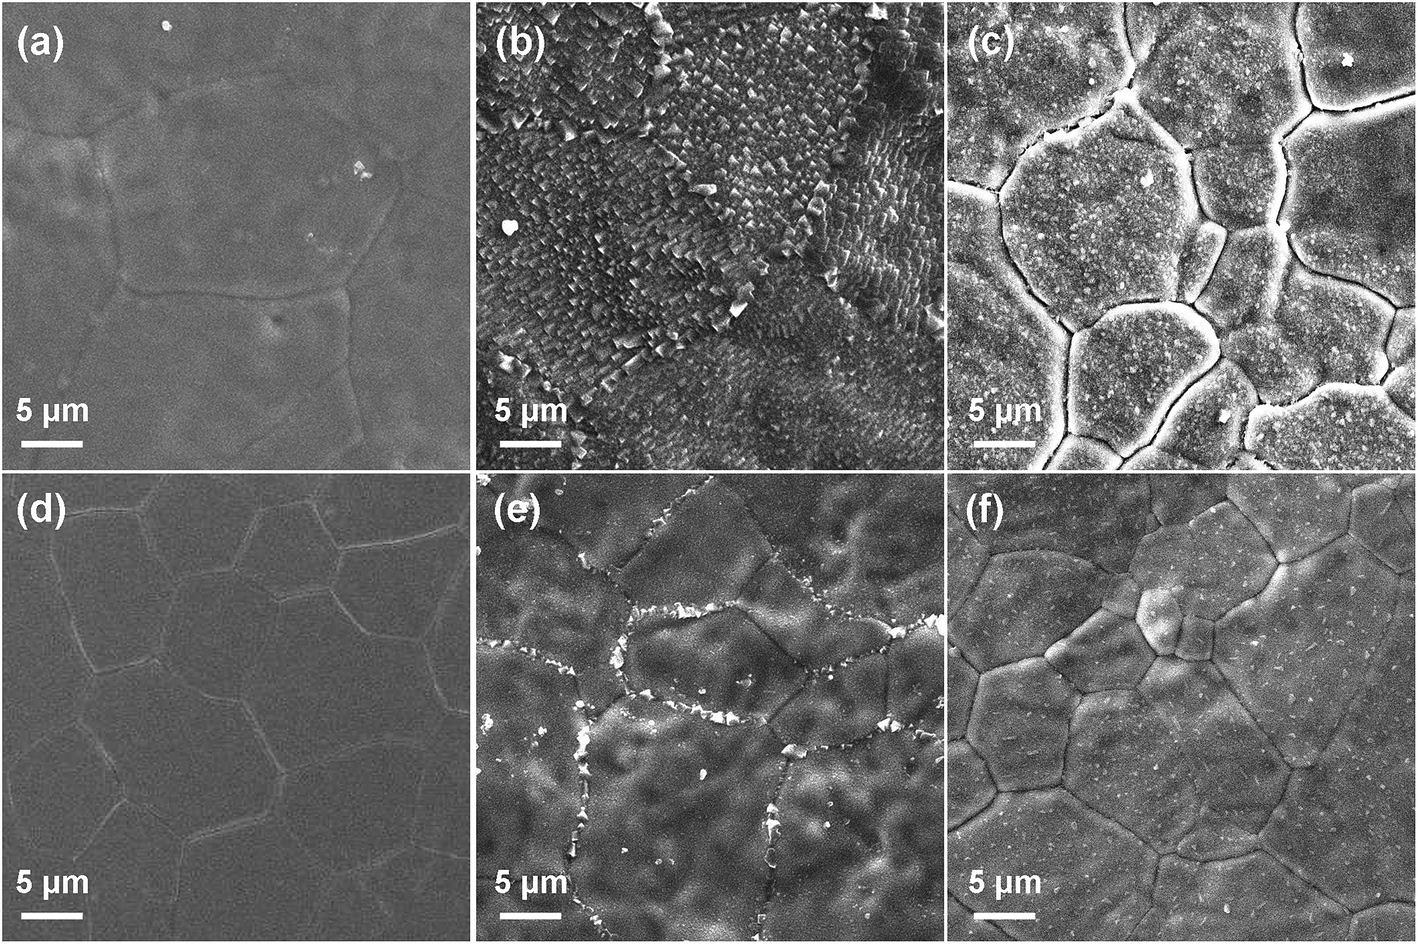
SEM observation was performed on the membrane surface of samples x = 0.025 and 0.15 before and after heat treatment in steam and CO2 atmosphere. As shown in Fig. 16, in contrast to the fresh membrane surface, the surfaces of treated membranes are changed to different degrees. Both membranes show phase segregation after treatment in CO2 and H2O atmospheres. The segregated particles should be BaCO3 and BaO, according to the surface XRD results (Fig. 15). Compared with treatment in H2O atmosphere, the CO2 treatment delivers a more serious deterioration to the membranes. It is worth noting that sample x = 0.15 exhibits obviously less phase segregation compared to sample x = 0.025 in both atmospheres, suggesting that Gd doping enhances considerably the chemical stability of the BaFe1−xGdxO3−δ membranes. This favourable effect of Gd doping on chemical stability is associated with the stronger bond strength of Gd–O than Fe–O, which provides a high attractive interaction towards oxygen from the dopant at the center of the BO6 octahedra and ensures high acidity and structural stability of the perovskite.70–73 Both of them contribute to the improvement of the structural and chemical stability against H2O and CO2 attack.
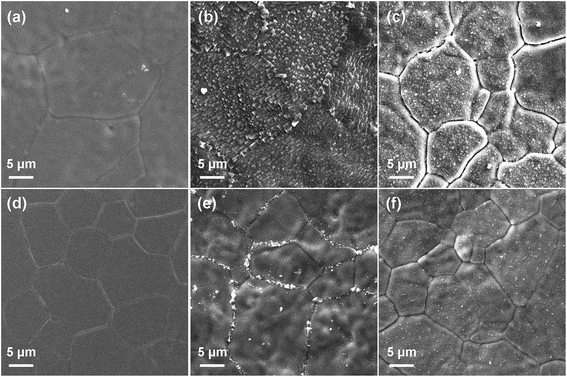 |
| | Fig. 16 Surface morphology of the BaFe1−xGdxO3−δ membranes with x = 0.025 (a–c) and 0.15 (d–f) membranes under different heat treatment conditions. Conditions: (a and d) fresh membranes for comparison, (b and e) in 10 vol% CO2/N2 at 900 °C for 10 h, and (c and f) in 7.5 vol% H2O/N2 at 900 °C for 10 h. | |
4. Conclusions
A series of novel BaFe1−xGdxO3−δ (0.025 ≤ x ≤ 0.20) materials was synthesized by the EDTA–citric acid combustion method and systematically evaluated as potential materials for oxygen separation ceramic membranes. The cubic perovskite structure of BaFe1−xGdxO3−δ can be stabilized down to room temperature with Gd doping in the range of x = 0.05–0.15. The sample with x = 0.025 shows a dual-phase structure with major cubic and minor tetragonal structures. On heating to 300 °C, the tetragonal phase disappears, completely transforming to a cubic structure, which can be kept down to room temperature after heat treatment. Gd doping alleviates the lattice oxygen loss process and thus increases the structural stability and reduces the thermal expansion coefficient of the BaFe1−xGdxO3−δ membranes. Meanwhile, the oxygen vacancy concentration decreases with increasing the Gd doping level in the lattice. The electronic conductivity and oxygen permeability are suppressed with increasing the Gd concentration, due to the interference of the Gd cation with a fixed valence on the B–O–B electron hopping route and the strong Gd–O bond that restricts the oxygen ion movement. The first principles calculation reveals that the migration energy is higher for oxygen close to the Gd dopant while lower for that far from Gd. The oxygen permeation tests show that the apparent activation energy for oxygen permeation increases with the Gd doping content, and the material with x = 0.025 has the lowest migration energy, even lower than that of pristine BaFeO3−δ and the good performing Ba0.95La0.05FeO3−δ, due to the expanded lattice structure. The BaFe0.975Gd0.025O3−δ membrane exhibits the highest oxygen permeation flux of 1.37 mL cm−2 min−1 for a 1 mm thick membrane at 950 °C and good long term operation stability at high temperatures. With increasing the doping content, the chemical stability of Gd-doped materials in CO2 and H2O atmosphere is also improved. This work not only advances the technology of oxygen permeation membranes but also provides a strategy for material design with a broad interest of mixed conductor applications.
Acknowledgements
This work was financially supported by National Basic Research Program of China (2013CB934003, 2012CB215405), Guangdong Industry-Academy-Research Alliance (2012B091100129), National Nature Science Foundation of China (51302275) and Program of Introducing Talents of Discipline to Universities (B14003).
References
- D. Chen, C. Chen, Z. M. Baiyee, Z. Shao and F. Ciucci, Chem. Rev., 2015, 115, 9869–9921 CrossRef CAS PubMed.
- A. S. Yu, J. M. Vohs and R. J. Gorte, Energy Environ. Sci., 2014, 7, 944–953 Search PubMed.
- A. Thursfield, A. Murugan, R. Franca and I. S. Metcalfe, Energy Environ. Sci., 2012, 5, 7421–7459 Search PubMed.
- S. Gupta, M. K. Mahapatra and P. Singh, Mater. Sci. Eng., R, 2015, 90, 1–36 CrossRef.
- S. Gupta, J. J. Adams, J. R. Wilson, E. G. Eddings, M. K. Mahapatra and P. Singh, Appl. Energy, 2016, 165, 72–80 CrossRef CAS.
- Y. Wei, W. Yang, J. Caro and H. Wang, Chem. Eng. J., 2013, 220, 185–203 CrossRef CAS.
- P. M. Geffroy, J. Fouletier, N. Richet and T. Chartier, Chem. Eng. Sci., 2013, 87, 408–433 CrossRef CAS.
- J. Sunarso, S. Baumann, J. M. Serra, W. A. Meulenberg, S. Liu, Y. S. Lin and J. C. Diniz da Costa, J. Membr. Sci., 2008, 320, 13–41 CrossRef CAS.
- H. J. M. Bouwmeester, Catal. Today, 2003, 82, 141–150 CrossRef CAS.
- Fraunhofer Institute for Ceramic Technologies and Systems online, http://www.ikts.fraunhofer.de/en/research/environmental_process_engineering/high_temperature_separation.html, accessed October 1st, 2013.
- F. Yang, H. Zhao, J. Yang, M. Fang, Y. Lu, Z. Du, K. Świerczek and K. Zheng, J. Membr. Sci., 2015, 492, 559–567 CrossRef CAS.
- J. Yi, M. Schroeder and M. Martin, Chem. Mater., 2013, 25, 815–817 CrossRef CAS.
- K. Efimov, T. Klande, N. Juditzki and A. Feldhoff, J. Membr. Sci., 2012, 389, 205–215 CrossRef CAS.
- K. Partovi, F. Liang, O. Ravkina and J. Caro, ACS Appl. Mater. Interfaces, 2014, 6, 10274–10282 Search PubMed.
- Z. Zhang, Y. Chen, M. O. Tade, Y. Hao, S. Liu and Z. Shao, J. Mater. Chem. A, 2014, 2, 9666–9674 RSC.
- Y. Teraoka, H. Shimokawa, C. Y. Kang, H. Kusaba and K. Sasaki, Solid State Ionics, 2006, 177, 2245–2248 CrossRef CAS.
- K. Efimov, T. Halfer, A. Kuhn, P. Heitjans, J. Caro and A. Feldhoff, Chem. Mater., 2010, 22, 1540–1544 CrossRef CAS.
- S. Gupta, M. K. Mahapatra and P. Singh, Mater. Res. Bull., 2013, 48, 3262–3267 CrossRef CAS.
- S. Gupta, Y. Zhong, M. K. Mahapatra and P. Singh, Int. J. Hydrogen Energy, 2015, 40, 13479–13489 CrossRef CAS.
- X. Zhu, H. Wang and W. Yang, Solid State Ionics, 2006, 177, 2917–2921 CrossRef CAS.
- Z. Shao, G. Xiong, H. Dong, W. Yang and L. Lin, Sep. Purif. Technol., 2002, 25, 97–116 CrossRef.
- Y. Cheng, H. Zhao, D. Teng, F. Li, X. Lu and W. Ding, J. Membr. Sci., 2008, 322, 484–490 CrossRef CAS.
- J. B. Goodenough, Rep. Prog. Phys., 2004, 67, 1915–1993 CrossRef CAS.
- Y. Liu, X. Zhu, M. Li, R. P. O'Hayre and W. Yang, Nano Lett., 2015, 15, 7678–7683 CrossRef CAS PubMed.
- F. Liang, H. Jiang, H. Luo, J. Caro and A. Feldhoff, Chem. Mater., 2011, 23, 4765–4772 CrossRef CAS.
- K. Efimov, Q. Xu and A. Feldhoff, Chem. Mater., 2010, 22, 5866–5875 CrossRef CAS.
- H. Gasparyan, J. B. Claridge and M. J. Rosseinsky, J. Mater. Chem. A, 2015, 3, 18265–18272 RSC.
- H. Cheng, W. Yao, X. Lu, Z. Zhou, C. Li and J. Liu, Fuel Process. Technol., 2015, 131, 36–44 CrossRef CAS.
- K. Watenabe, M. Yuasa, T. Kida, Y. Teraoka, N. Yamazoe and K. Shimanoe, Adv. Mater., 2010, 22, 2367–2370 CrossRef CAS PubMed.
- F. Liang, K. Partovi, H. Jiang, H. Luo and J. Caro, J. Mater. Chem. A, 2013, 1, 746–751 RSC.
- D. Xu, F. Dong, Y. Chen, B. Zhao, S. Liu, M. O. Tade and Z. Shao, J. Membr. Sci., 2014, 455, 75–82 CrossRef CAS.
- X. Liu, H. Zhao, J. Yang, Y. Li, T. Chen, X. Lu, W. Ding and F. Li, J. Membr. Sci., 2011, 383, 235–240 CrossRef CAS.
- Y. Wang, Q. Liao, L. Zhou and H. Wang, J. Membr. Sci., 2014, 457, 82–87 CrossRef CAS.
- T. Kida, S. Ninomiya, K. Watanabe, N. Yamazoe and K. Shimanoe, ACS Appl. Mater. Interfaces, 2010, 2, 2849–2853 Search PubMed.
- Y. Lu, H. Zhao, X. Cheng, Y. Jia, X. Du, M. Fang, Z. Du, K. Zheng and K. Swierczek, J. Mater. Chem. A, 2015, 3, 6202–6214 RSC.
- X. Zhu, Y. Cong and W. Yang, J. Membr. Sci., 2006, 283, 158–163 CrossRef CAS.
- Z. Du, H. Zhao, Y. Shen, L. Wang, M. Fang, K. Swierczek and K. Zheng, J. Mater. Chem. A, 2014, 2, 10290–10299 RSC.
- Y. Shen, H. Zhao, K. Świerczek, Z. Du and Z. Xie, J. Power Sources, 2013, 240, 759–765 CrossRef CAS.
- B. Toby, J. Appl. Crystallogr., 2001, 34, 210–213 CrossRef CAS.
-
A. Larsen and R. Von Dreele, Report LAUR-86±748, Los Alamos National Laboratory, New Mexico, USA, 1994 Search PubMed.
- N. Xu, H. Zhao, Y. Shen, T. Chen, W. Ding, X. Lu and F. Li, Sep. Purif. Technol., 2012, 89, 16–21 CrossRef CAS.
- B. Hu, Y. Wang, Z. Zhu, C. Xia and H. J. M. Bouwmeester, J. Mater. Chem. A, 2015, 3, 10296–10302 RSC.
- M. W. den Otter, H. J. M. Bouwmeester, B. A. Boukamp and H. Verweij, J. Electrochem. Soc., 2001, 148, J1–J6 CrossRef CAS.
- T. Chen, H. Zhao, Z. Xie, J. Wang, Y. Lu and N. Xu, J. Power Sources, 2013, 223, 289–292 CrossRef CAS.
- T. Chen, H. Zhao, Z. Xie, N. Xu and Y. Lu, Ionics, 2015, 21, 1683–1692 CrossRef CAS.
- M. D. Segall, J. D. L. Philip, M. J. Probert, C. J. Pickard, P. J. Hasnip, S. J. Clark and M. C. Payne, J. Phys.: Condens. Matter, 2002, 14, 2717 CrossRef CAS.
- S. J. Clark, M. D. Segall, C. J. Pickard, P. J. Hasnip, M. I. Probert, K. Refson and M. C. Payne, Zeitschrift für Kristallographie – Crystalline Materials, 2005, 220, 567–570 CAS.
- J. P. Perdew, K. Burke and Y. Wang, Phys. Rev. B: Condens. Matter Mater. Phys., 1996, 54, 16533–16539 CrossRef CAS.
- B. G. Pfrommer, M. Côté, S. G. Louie and M. L. Cohen, J. Comput. Phys., 1997, 131, 233–240 CrossRef CAS.
- C. Zhang and P. D. Bristowe, RSC Adv., 2013, 3, 12267–12274 RSC.
- T. A. Halgren and W. N. Lipscomb, Chem. Phys. Lett., 1977, 49, 225–232 CrossRef CAS.
- H. T. Stokes, E. H. Kisi, D. M. Hatch and C. J. Howard, Acta Crystallogr., Sect. B: Struct. Sci., 2002, 58, 934–938 CrossRef.
- F. Dong, Y. Chen, D. Chen and Z. Shao, ACS Appl. Mater. Interfaces, 2014, 6, 11180–11189 Search PubMed.
- F. Dong, Y. Chen, R. Ran, D. Chen, M. O. Tade, S. Liu and Z. Shao, J. Mater. Chem. A, 2013, 1, 9781–9791 RSC.
- A. R. Denton and N. W. Ashcroft, Phys. Rev. A, 1991, 43, 3161–3164 CrossRef CAS.
- H. Cheng, J. Liu, X. Lu and W. Ding, ACS Appl. Mater. Interfaces, 2011, 3, 4032–4039 Search PubMed.
-
P. Vanysek, CRC Handbook of Chemistry and Physics, CRC Press, Boca Raton, 2001 Search PubMed.
- D. Chen, C. Chen, Z. Zhang, Z. M. Baiyee, F. Ciucci and Z. Shao, ACS Appl. Mater. Interfaces, 2015, 7, 8562–8571 Search PubMed.
- D. Chen and Z. Shao, Int. J. Hydrogen Energy, 2011, 36, 6948–6956 CrossRef CAS.
- P. M. Geffroy, Y. Hu, A. Vivet, T. Chartier and G. Dezanneau, J. Electrochem. Soc., 2014, 161, F153–F160 CrossRef CAS.
- V. V. Vashook, M. Al Daroukh and H. Ullmann, Ionics, 2001, 7, 59–66 CrossRef CAS.
- J. Maier, Solid State Ionics, 1998, 112, 197–228 CrossRef CAS.
- J. Maier, Solid State Ionics, 2000, 135, 575–588 CrossRef CAS.
- J. Wang, M. Saccoccio, D. Chen, Y. Gao, C. Chen and F. Ciucci, J. Power Sources, 2015, 297, 511–518 CrossRef CAS.
- R. Merkle, Y. A. Mastrikov, E. A. Kotomin, M. M. Kuklja and J. Maier, J. Electrochem. Soc., 2011, 159, B219–B226 CrossRef.
- Y. A. Mastrikov, R. Merkle, E. A. Kotomin, M. M. Kuklja and J. Maier, Phys. Chem. Chem. Phys., 2013, 15, 911–918 RSC.
- E. A. Kotomin, Y. A. Mastrikov, M. M. Kuklja, R. Merkle, A. Roytburd and J. Maier, Solid State Ionics, 2011, 188, 1–5 CrossRef CAS.
- Z. Wang, R. Peng, W. Zhang, X. Wu, C. Xia and Y. Lu, J. Mater. Chem. A, 2013, 1, 12932–12940 RSC.
- B. Hu, M. K. Mahapatra, M. Keane, H. Zhang and P. Singh, J. Power Sources, 2014, 268, 404–413 CrossRef CAS.
- Y. Han, J. Yi and X. Guo, Solid State Ionics, 2014, 267, 44–48 CrossRef CAS.
- J. Zhu, S. Guo, Z. Chu and W. Jin, J. Mater. Chem. A, 2015, 3, 22564–22573 RSC.
- J. Yi, M. Schroeder, T. Weirich and J. Mayer, Chem. Mater., 2010, 22, 6246–6253 CrossRef CAS.
- I. Kaus, K. Wiik, B. Krogh, M. Dahle, K. H. Hofstad and S. Aasland, J. Am. Ceram. Soc., 2007, 90, 2226–2230 CrossRef CAS.
Footnote |
| † Electronic supplementary information (ESI) available. See DOI: 10.1039/c6ta01749e |
|
| This journal is © The Royal Society of Chemistry 2016 |
Click here to see how this site uses Cookies. View our privacy policy here. 
 Open Access Article
 This Open Access Article is licensed under a