Factors affecting cycling life of LiNi0.8Co0.15Al0.05O2 for lithium-ion batteries†
Received
10th February 2016
, Accepted 19th April 2016
First published on 20th April 2016
Abstract
Factors affecting the cycling life of cylindrical lithium-ion batteries of LiNi0.8Co0.15Al0.05O2 (NCA) with graphite were examined in terms of the rechargeable capacity and polarization of NCA derivatives of LizNi0.8Co0.15Al0.05O2−δ (0.8 ≤ z ≤ 1.05). NCA derivatives with rock-salt domains in the structure were prepared by a co-precipitation method and the structures of [Li1−yNiy]3(b)[Ni,Co,Al]3(a)O26(c) based on a space group of R![[3 with combining macron]](https://www.rsc.org/images/entities/char_0033_0304.gif) m were refined by a Rietveld method of the XRD patterns. The electrochemical reactivity of the NCA derivatives with rock-salt domains was examined in non-aqueous lithium cells, and it was found that the rechargeable capacities (Q) of the samples decrease linearly as the amount of rock-salt domain (y) increases. An empirical relation is obtained to be Q = 181.4 − 725.5y in which Q reaches zero at y = 0.25, which is derived from not only the capacity loss owing to inactive rock-salt domains but also the polarization increase. The galvanostatic intermittent titration technique (GITT) measurement told us that polarization of NCA derivatives increases when the amount of rock-salt domains is above 2%, i.e., y > 0.02, and such a relation is remarkable in the lithium insertion direction into the structure, which is ascribed to slow lithium ion mobility due to nickel ions in the lithium layers. The NCA derivatives with increased rock-salt domains of above 2% deteriorate rapidly in non-aqueous lithium cells upon charge and discharge cycles, which is ascribed to the cumulative increase in polarization during charge and discharge. An extended cycling test for cylindrical lithium-ion batteries of the NCA derivatives with a graphite negative electrode at elevated temperature was performed and the quantitative relation is discussed thereof.
m were refined by a Rietveld method of the XRD patterns. The electrochemical reactivity of the NCA derivatives with rock-salt domains was examined in non-aqueous lithium cells, and it was found that the rechargeable capacities (Q) of the samples decrease linearly as the amount of rock-salt domain (y) increases. An empirical relation is obtained to be Q = 181.4 − 725.5y in which Q reaches zero at y = 0.25, which is derived from not only the capacity loss owing to inactive rock-salt domains but also the polarization increase. The galvanostatic intermittent titration technique (GITT) measurement told us that polarization of NCA derivatives increases when the amount of rock-salt domains is above 2%, i.e., y > 0.02, and such a relation is remarkable in the lithium insertion direction into the structure, which is ascribed to slow lithium ion mobility due to nickel ions in the lithium layers. The NCA derivatives with increased rock-salt domains of above 2% deteriorate rapidly in non-aqueous lithium cells upon charge and discharge cycles, which is ascribed to the cumulative increase in polarization during charge and discharge. An extended cycling test for cylindrical lithium-ion batteries of the NCA derivatives with a graphite negative electrode at elevated temperature was performed and the quantitative relation is discussed thereof.
Introduction
Lithium-ion batteries, which were designed as power sources for portable devices such as mobile phones and notebook computers, have been applied to large-sized energy storage devices for automotive and stationary purposes.1–4 For large-sized applications, positive electrode materials of manganese, iron, and/or nickel species have to be used rather than LiCoO2 with respect to a low risk for the resource crisis. Of these, LiNiO2-based materials are attractive because of a large rechargeable capacity of more than 150 mA h g−1, a moderately high operating voltage above 3.6 V vs. Li, and a characteristic S-shaped curve over the entire range of operation.5,6 The required performances of lithium-ion batteries for large-sized applications are quite challenging for researchers and engineers with respect to durability and safety, and hence operating conditions for lithium-ion batteries have to be monitored and be strictly controlled in terms of temperature, voltage and current to overcome these concerns.7–12 Deterioration of lithium-ion batteries by extended cycling or storage tests especially at elevated temperature has been reported by many research groups to be attributed to the degradation of positive electrode materials such as LiNi0.8Co0.15Al0.05O2 (NCA) in a microscopic or macroscopic scale.11–22 Degradation of the NCA-based positive electrode has been examined with respect to the increase in interfacial resistance at the positive electrode,13,17 generated micro-cracks in the particles,11,12 or formation of NiO-like rock-salt domains.11,12,15,16,22 The similarity of reaction products between exothermic reactions of positive electrode materials at high temperature above 150 °C and material degradation during cycling at 60 °C strongly suggests that positive electrode materials are key for tough and safe batteries.23–26 Our group has also reported the deterioration of lithium-ion batteries of NCA with graphite during extended cycling for more than 500 cycles at an elevated temperature above 60 °C, derived from the localized degradation of NCA to form NiO-like rock-salt domains in the structure.20,21 Electrochemical impedance spectroscopy (EIS) measurement of the 500 mA h class cylindrical lithium-ion batteries of NCA with graphite revealed that the rise in internal resistance of the batteries was dominated by the rise in the charge-transfer resistance of the positive electrode, which corresponds to the right semicircle resistance in the lower frequency range in the Nyquist plots of two semicircles.19 Temperature dependence of the charge-transfer resistance of NCA before and after the cycling test indicated that the impedance rise of the NCA positive electrode was caused by a reduction in the number of active sites for the charge-transfer process, hence NiO-like rock-salt domains localized at the surface of the NCA particles were considered to be inactive to reduce the number of active sites.27 Electrochemical reactivity of the rock-salt domains is actually not obvious and the relation between the formation of rock-salt domains and the deterioration of lithium-ion batteries has not been quantitatively understood because only trace amounts of rock-salt domains are generated after extended cycling at elevated temperature. In this paper, NCA derivatives of LizNi0.8Co0.15Al0.05O2−δ (0.8 ≤ z ≤ 1.05) having quantitatively-controlled rock-salt domains in the structure were prepared and electrochemical measurements were performed to clarify the relationship between the rock-salt domains and electrochemical reactivity in terms of the rechargeable capacity and polarization. An extended cycling test of the 500 mA h class cylindrical lithium-ion batteries of NCA derivatives was also performed, and a possible way to improve battery performance is discussed thereof.
Experimental
A co-precipitation method was applied to prepare LizNi0.8Co0.15Al0.05O2−δ samples. A mixed solution of nickel, cobalt, and aluminum nitrates and an aqueous solution of lithium hydroxide were dripped simultaneously into a stirred flask. For the reaction product to be a precipitate it was washed several times with distilled water, and dried at 80 °C for 12 hours. The obtained powder of nickel, cobalt, and aluminum species was mixed with lithium carbonate, and the reaction mixture was heated at 750 °C under an oxygen stream. The value of z in LizNi0.8Co0.15Al0.05O2−δ was adjusted by the molar ratios of lithium to nickel, cobalt, and aluminum ions in the starting materials.
The obtained samples of LizNi0.8Co0.15Al0.05O2−δ were characterized by powder X-ray diffraction using a RINT-TTR II powder diffractometer (Rigaku Corp., Japan) with Cu Kα radiation, and a Rietveld method using the GSAS package with the EXPGUI interface28 based on the structural model of [Li1−yNiy]3(b)[Ni,Co,Al]3(a)O26(c) assuming a space group of Rm.
The X-ray absorption spectral measurements of LizNi0.8Co0.15Al0.05O2−δ were carried out at a BL33XU beam line in SPring-8. A Si(111) channel-cut crystal monochromator was used for incident X-rays, and harmonic contamination of the beam was prevented using a Rh-coated Si mirror. The intensities of the incident and transmitted X-rays were measured by the ion chamber detectors at room temperature.
The electrochemical behavior of LizNi0.8Co0.15Al0.05O2−δ was examined using the sandwich-type electrochemical cell of Type TJ-AC (Tomcell Co. Ltd., Japan) with a lithium foil supported on a stainless steel plate as the negative electrode. The positive and negative electrodes separated by a microporous polypropylene film were immersed in 1 M LiPF6 ethylene carbonate (EC)/dimethyl carbonate (DMC)/ethyl methyl carbonate (EMC) (3/4/3; volume ratio) electrolyte. 500 mA h class cylindrical lithium-ion batteries consisting of wound sheets of the LizNi0.8Co0.15Al0.05O2−δ positive electrode and graphite negative electrode with a microporous polypropylene film were also fabricated to examine the cycling stability at an elevated temperature of 60 °C. A black viscous slurry of the positive electrode mix consisting of 85 wt% LizNi0.8Co0.15Al0.05O2−δ, 10 wt% carbon black, and 5 wt% polyvinylidene fluoride (PVdF) binder dissolved in N-methyl-2-pyrrolidone (NMP) was painted on one side of an aluminum foil for the electrochemical cell or on both sides for the cylindrical lithium-ion batteries, and was dried under vacuum at 120 °C for 12 h. The painted sheets were pressed to increase the electrode density and cut to be the positive electrodes. The graphite negative electrodes were prepared in the same way as the positive electrode, which consists of 95 wt% graphite and 5 wt% PVdF binder coated on copper foil.
The electrochemical cells were operated in a galvanostatic mode at C/10-rate in a voltage window of 4.2–2.5 V at 20 °C to examine the electrochemical reactivity of LizNi0.8Co0.15Al0.05O2−δ. Intermittent charge and discharge measurement in a galvanostatic intermittent titration technique (GITT) mode of the electrochemical cells was performed at C/10-rate at 20 °C. The cell operation was interrupted every 10 mA h g−1, and re-started when the voltage slope was below 1 mV h−1.
The extended cycling test for the cylindrical lithium-ion batteries of NCA derivatives with the graphite negative electrode was performed for 500 cycles at an elevated temperature of 60 °C in a voltage range of 4.1–3.0 V at 2C-rate.
Results and discussion
Preparation of LiNi0.8Co0.15Al0.05O2 derivatives with rock-salt domains
In order to prepare NCA derivatives with rock-salt domains, the ratios of lithium to metal ions in the starting materials were adjusted to be z = 1.05, 1.02, 1.00, 0.98, 0.95, 0.90, and 0.80 in LizNi0.8Co0.15Al0.05O2−δ, and X-ray diffraction (XRD) patterns of the obtained samples are displayed in Fig. 1. The chemical compositions of the samples were determined by inductively coupled plasma-atomic emission spectroscopy (ICP-AES), and are listed in Table S1.† The lithium amounts listed in Table S1† are 2–3% less than the z values, which are acceptable since these values can be explained by the 2–3% lithium evaporation during the heating process at 750 °C in preparation. The morphologies of the NCA derivatives (z = 1.05, 0.90, and 0.80) were observed by scanning electron microscopy (SEM) and are displayed in Fig. S1.† Irrespective of the chemical compositions of the NCA derivatives, the samples were comprised of large agglomerates of about 20 μm, which were composed of small particles of 0.5–1.5 μm in size. LizNi0.8Co0.15Al0.05O2−δ samples give XRD patterns of the single phase associated with the rhombohedral lattice, and hence miller indexes are given in the hexagonal setting. Of these, LizNi0.8Co0.15Al0.05O2−δ (z = 1.05; NCA) shown in Fig. 1(a) exhibits a large diffraction peak of (003) in comparison to that of (104) and a clear peak split of (006)/(102) or (108)/(110) in the XRD pattern, which indicates that LizNi0.8Co0.15Al0.05O2−δ (z = 1.05) has an α-NaFeO2-type layered structure. As the z value in LizNi0.8Co0.15Al0.05O2−δ decreases from 1.05 to 0.8, the (006) peak shifts to a higher diffraction angle toward the (102) peak, and the (110) peak approaches the (108) peak in its location. The (003) peak intensity decreases while that of (104) keeps a constant value. Such changes in the peak intensity and location are ascribed to increased transition metal ions especially nickel ions at the lithium layers in the α-NaFeO2-type layered structure.6,29 In NCA derivatives prepared in this work, the rock-salt domains should be uniformly distributed in the lithium layers. Scanning transmission electron microscopy (STEM) will give us more insight into the distribution of nickel ions in the lithium layers as has been reported in our previous papers.30,31 Such an approach is in progress in our research group. Rietveld analyses of the XRD patterns of the LizNi0.8Co0.15Al0.05O2−δ (0.8 ≤ z ≤ 1.05) samples were performed by assuming the structural model of [Li1−yNiy]3(b)[Ni,Co,Al]3(a)O26(c) based on a space group of Rm. The Rietveld analytical results on the sample of z = 0.90 are shown in Fig. 2 and the analytical results on those of 0.8 ≤ z ≤ 1.05 are summarized in Table 1. Oxygen positional parameters of Zox are 0.2591–0.2598, which are consistent with previous results.5,32,33 The y value is estimated to be 0.0023 at z = 1.05, and increases to 0.1280 at z = 0.8. The values of (1 − y)/(1 + y) were calculated to confirm the validity of the analysis, which should be comparable to the z value in LizNi0. 8Co0.15Al0.05O2−δ. As listed in Table 1, (1 − y)/(1 + y) values are 2–3% less than the z values, which are comparable to the analytical results by ICP-AES listed in Table S1.† The y values of the samples of z = 1.05 and 1.02 are positive numbers in spite of the lithium excess amount of z > 1.0 in preparation of the samples, which indicates that LiNiO2-based materials do not have lithium ions in transition metal layers as reported by Delmas' research group.6,33 Such a phenomenon is not the case for Li(Ni,Co,Mn)O2 positive electrode materials since layered lithium manganese oxides can accommodate lithium ions in transition metal layers like Li2MnO3 (or Li[Li1/3Mn2/3]O2 in a layered formulation).34–36 The hexagonal cell parameters, a and c, increase and the c/a ratio decreases as the y value increases as listed in Table 1. The c/a ratio of the cubic symmetry should be about 4.899, and hence the change in the c/a ratios from 4.95 to 4.94 indicates the change in symmetry from rhombohedral toward a cubic lattice. The a-axis parameter is the edge distance of the unit octahedron MO6 (M: Ni, Co, Al), which reflects the change in bond length of M–O, since the combination of a MO6 octahedron gives a two-dimensional layer forming the triangular lattice of sites.37 The increase in the a-axis parameter indicates that the M–O bond length increases, which is ascribed to the reduction of transition metal ions.29 In order to examine the oxidation states of nickel and cobalt ions in NCA derivatives, XAFS measurements were conducted and the Ni K-edge X-ray absorption near-edge structure (XANES) spectra are displayed in Fig. 3. The oxidation state of cobalt ions in NCA derivatives is invariable irrespective of the y values by the Co K-edge XANES spectra (Fig. S2†), which indicates that cobalt ions are as Co3+ in the oxidation state. As displayed in Fig. 3(a), a monotonous Ni K-edge shift to a lower energy is seen as the y value increases, indicating the reduction of nickel ions in NCA derivatives. Edge energies at a half-step height are displayed in Fig. 3(b), which are the energies at a normalized absorbance of 0.5 and are often used to estimate the oxidation state of nickel ions.38 The NCA sample of y = 0.0023 was prepared by a lithium excess amount z > 1, and therefore the oxidation state of nickel ions is close to Ni3+. The edge energy follows a descending line, which indicates that NCA derivatives having rock-salt domains are actually prepared to examine the cycling test of non-aqueous lithium cells and the cylindrical lithium-ion batteries.
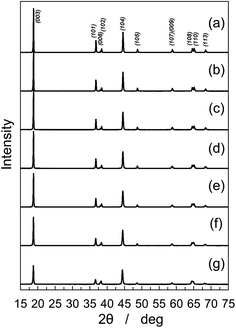 |
| | Fig. 1 XRD patterns of LizNi0.8Co0.15Al0.05O2−δ prepared by adjusting the Li/M ratios (M: Ni0.8Co0.15Al0.05) of z = (a) 1.05, (b) 1.02, (c) 1.00, (d) 0.98, (e) 0.95, (f) 0.90, and (g) 0.80. | |
 |
| | Fig. 2 Rietveld analytical result on LizNi0.8Co0.15Al0.05O2−δ (z = 0.90) assuming a space group of Rm. Open circles indicate the observed intensity and a solid curve indicates the calculated pattern using the parameters listed in Table 1. The difference between the observed and calculated patterns is shown at the bottom. | |
Table 1 Summary on the Rietveld analysis of LizNi0.8Co0.15Al0.05O2−δ (z = 0.8–1.05) to be the structure of [Li1−yNiy]3(b)[Ni,Co,Al]3(a)O2 based on a space group of Rm
|
z
|
Refined structure |
(1 − y)/(1 + y) |
Lattice parameter |
c/a |
Z
ox
|
wRp |
R
p
|
|
a-Axis |
c-Axis |
| 1.05 |
[Li0.9977Ni0.0023]3(b)[Ni0.7995Co0.1503Al0.0501]3(a)O2 |
0.995 |
2.864 Å |
14.180 Å |
4.951 |
0.2596 |
11.60 |
8.22 |
| 1.02 |
[Li0.9948Ni0.0052]3(b)[Ni0.7990Co0.1508Al0.0503]3(a)O2 |
0.990 |
2.864 Å |
14.182 Å |
4.952 |
0.2598 |
11.34 |
8.06 |
| 1.00 |
[Li0.9907Ni0.0093]3(b)[Ni0.7981Co0.1514Al0.0505]3(a)O2 |
0.982 |
2.865 Å |
14.185 Å |
4.951 |
0.2598 |
10.84 |
7.77 |
| 0.98 |
[Li0.9806Ni0.0194]3(b)[Ni0.7961Co0.1529Al0.0510]3(a)O2 |
0.962 |
2.866 Å |
14.187 Å |
4.950 |
0.2595 |
10.60 |
7.64 |
| 0.95 |
[Li0.9627Ni0.0373]3(b)[Ni0.7925Co0.1556Al0.0519]3(a)O2 |
0.928 |
2.867 Å |
14.191 Å |
4.950 |
0.2596 |
10.42 |
7.63 |
| 0.9 |
[Li0.9393Ni0.0607]3(b)[Ni0.7879Co0.1591Al0.0530]3(a)O2 |
0.886 |
2.870 Å |
14.197 Å |
4.947 |
0.2594 |
9.75 |
7.17 |
| 0.8 |
[Li0.8720Ni0.1280]3(b)[Ni0.7744Co0.1692Al0.0564]3(a)O2 |
0.773 |
2.876 Å |
14.214 Å |
4.942 |
0.2590 |
8.32 |
6.38 |
 |
| | Fig. 3 (a) Ni K-edge XANES spectra of LizNi0.8Co0.15Al0.05O2−δ corresponding to [Li1−yNiy]3(b)[Ni,Co,Al]3(a)O2 based on a space group of Rm. Edge energies at half-step heights as a function of the amount of rock-salt domain, y, are also displayed in (b). | |
As described above, NCA derivatives of LizNi0.8Co0.15Al0.05O2−δ (0.8 ≤ z ≤ 1.05) were prepared and refined by a Rietveld method of the XRD patterns to be [Li1−yNiy]3(b)[Ni,Co,Al]3(a)O26(c) (0.0023 ≤ y ≤ 0.1280) based on a space group of Rm. Nickel ions are reduced from the oxidation state of Ni3+ toward Ni2+ in the layered structure as the y value increases. Nickel ions of Ni2+ in the oxidation states are incorporated into the lithium layers because of the similarity of the ionic radii between Li+ and Ni2+ ions.6,33,39 These results indicate that the y values are the amount of rock-salt domains in NCA derivatives and the rock-salt domains correspond to the degradation of the positive electrode appearing during the extended cycling test of the cylindrical lithium-ion batteries at an elevated temperature above 60 °C.20,21 The amount of rock-salt domains in the NCA derivatives prepared in this work was as high as 12.8%, and can be quantitatively controlled in 0.23–12.8%. These NCA derivatives were applied to examine the electrochemical reactivity in the lithium cells and the extended cycling test at 60 °C of the cylindrical lithium-ion batteries with the graphite negative electrode.
Rechargeable capacities of LiNi0.8Co0.15Al0.05O2 derivatives
In order to examine the electrochemical reactivity of the NCA derivatives with rock-salt domains in terms of a voltage profile in non-aqueous lithium cells, constant current charge and discharge measurement was performed at C/10-rate in a voltage window of 4.2–2.5 V at 20 °C. Fig. 4 displays the voltage profiles of lithium cells of NCA derivatives. The lithium cell of NCA (y = 0.0023) exhibits an ascending curve from 3.6 to 4.2 V on charge and then the discharge curve just traces the charge one in a reverse direction. The first charge and discharge capacities were 205 and 177 mA h g−1, respectively, which means that a capacity of 28 mA h g−1 was lost during the first cycle, i.e., the so-called irreversible capacity. As the amount of rock-salt domains in the NCA derivatives increases, rechargeable capacities decrease from 177 mA h g−1 at y = 0.0023 to about 90 mA h g−1 at y = 0.1280 which corresponds to capacity fading due to increased rock-salt domains. Fig. 5 shows the rechargeable capacities as a function of the y values in [Li1−yNiy]3(b)[Ni,Co,Al]3(a)O26(c) (0.0023 ≤ y ≤ 0.1280) based on the space group of Rm. A dotted line of the rechargeable capacity is drawn in the figure by assuming that the nickel ions in lithium layers are inactive. Although a linear relation between the rechargeable capacities (Q) and y values is actually seen in the figure, the obtained rechargeable capacities are smaller than the dotted line. The empirical equation is obtained to be Q = 181.4 − 725.5y in which Q reaches zero at y ≈ 0.25, indicating that rechargeable capacities are completely lost when the nickel ions at the lithium layers increase to about 25% of NCA, which cannot be simply understood by the capacity loss derived from the increased inactive rock-salt domain in the structure. As shown in Fig. 4, decreased rechargeable capacities are associated with small first charge capacities and large irreversible capacities in the first cycle, and those are ascribed to not only to the capacity loss derived from the inactive rock-salt domain, but also the polarization increase which is shown in the voltage profiles as the large difference in operating voltage between the charge and discharge operations.
 |
| | Fig. 4 Voltage profiles of lithium cells of LizNi0.8Co0.15Al0.05O2−δ corresponding to [Li1−yNiy]3(b)[Ni,Co,Al]3(a)O2 based on a space group of Rm; y [z] = (a) 0.0023 [1.05], (b) 0.0093 [1.00], (c) 0.0194 [0.98], (d) 0.0373 [0.95], (e) 0.0607 [0.90], and (f) 0.1280 [0.80]. The cells were operated in a voltage window of 4.2–2.5 V at C/10-rate at 20 °C. | |
 |
| | Fig. 5 Discharge capacities as a function of y in [Li1−yNiy]3(b)[Ni,Co,Al]3(a)O2 based on a space group of Rm. A dotted line was drawn by assuming that the nickel ions in lithium layers were inactive. | |
Change in polarization of LiNi0.8Co0.15Al0.05O2 derivatives during charge and discharge
The impedance spectrum for NCA electrodes with a counter electrode of lithium metal includes the impedance behavior of the lithium metal electrode.40 In our group, the cylindrical lithium-ion batteries of NCA with graphite or the symmetric cells of two identical electrodes prepared at the same potential were fabricated and their EIS measurements were performed to examine the change in impedance of the positive and/or negative electrodes.19,20,27,40,41 In this paper, lithium-ion mobility in the bulk structure rather than the reaction at the interface was examined by the intermittent charge and discharge measurement of lithium cells of NCA derivatives in a galvanostatic intermittent titration technique (GITT) mode.42–44Fig. 6 displays voltage profiles of the NCA derivatives of y = 0.0023, 0.0607, and 0.1280, and their polarization is defined as the difference in voltage after the lapse of 2 s to the end of the relaxation period, which is associated with mass transfer since ohmic and charge-transfer resistance appear in a short time within 2 s. As shown in Fig. 6(a), polarization of NCA (y = 0.0023) is quite small with 2.3–3.4 mV on both charge and discharge over the entire range of the cell operation. Increased polarization is seen at the low voltage region of about 3.5–3.6 V on both charge and discharge. A NCA derivative with increased rock-salt domains (y = 0.0607) exhibits larger polarization than that of NCA (y = 0.0023) especially at the end of charge or discharge, which draws U-shaped curves of polarization. Such degradation in electrochemical reactivity drawing U-shaped curves of polarization is more obvious in a NCA derivative having the largest amount of rock-salt domains (y = 0.1280). Fig. 6(c) clearly shows increased polarization at the end of charge or discharge, and polarization on discharge is larger than that on charge over the entire range of the cell operation. At the end of charge, increased polarization is one of the reasons of the decrease in rechargeable capacities as a function of the amount of rock-salt domains, and at the end of discharge, large polarization is characteristic of the appearance of the irreversible capacity seen in the first cycle.
 |
| | Fig. 6 Intermittent charge and discharge curves in a GITT mode of lithium cells of [Li1−yNiy]3(b)[Ni,Co,Al]3(a)O2 of y = (a) 0.0023, (b) 0.0607, and (c) 0.1280 at C/10-rate at 20 °C. The cell operation was interrupted every 10 mA h g−1, and re-started when the voltage slope was below 1 mV h−1. Polarization, defined as the difference in voltage after the lapse of 2 s to the end of the relaxation period, is also displayed. Polarization on charge is given in a positive number and that on discharge is in a negative number. | |
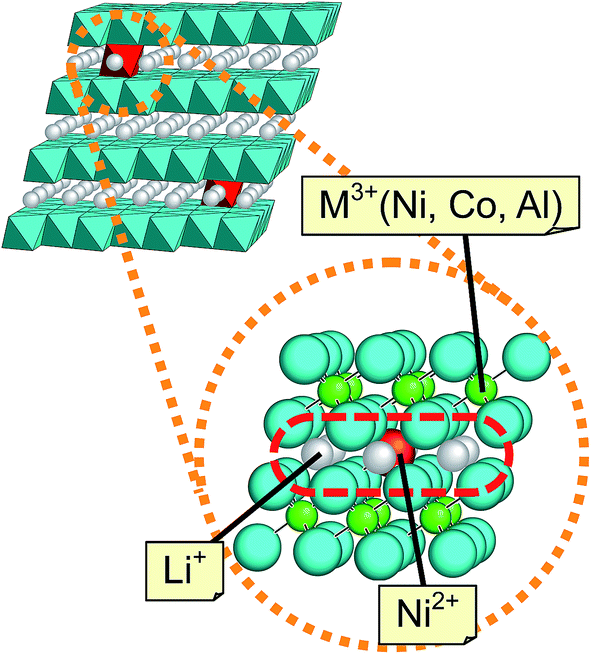
In order to examine the electrochemical reactivity in the irreversible region, intermittent charge and discharge operation of NCA (y = 0.0023) was continued through the irreversible region and the voltage profile is shown in Fig. S3.† The open-circuit voltages on discharge in the irreversible region are the same as those on charge, and the cell can be discharged back to the initial 0 mA h g−1, which indicates that the irreversible capacity in the first cycle can be recovered by an intermittent mode. Fig. S4† displays the voltage profiles of NCA (y = 0.0023) operated in a 200 mA h g−1 capacity-limited mode at 20, 60, and 80 °C. Although NCA exhibits 25 mA h g−1 of the irreversible capacity at 20 °C, this can be recovered with low voltage discharge below 2.0 V. As shown in Fig. S4,† the so-called irreversible capacity shrinks from 25 mA h g−1 at 20 °C to below 10 mA h g−1 at elevated temperature. These results indicate that the irreversible capacity is under kinetic control. Fig. 7 displays the crystal structure of a NCA derivative with rock-salt domains. The mechanisms of the irreversible capacity have been proposed by several research groups, and have been discussed from a viewpoint of lithium ion mobility in the crystal structure. Delmas et al. proposed the mechanism associated with Ni2+ ions placed in the lithium layers.33 During the first charge, the Ni2+ ions in the lithium layers oxidize to smaller Ni3+ ions, which induce a local collapse in the structure. The local collapse makes it difficult to insert lithium ions back to the structure. Ceder et al. discussed lithium ion mobility in terms of monovacancy or divacancy hopping associated with an interlayer distance in the layered structure, and then Dahn et al. and Kang et al. discussed the irreversible capacity on the basis of the results on Ceder's calculation.45–49 Our results on the irreversible capacity displayed in Fig. S3 and S4† strongly suggest that the irreversible capacity is derived from kinetic limitation of lithium insertion into the structure. According to the relation between the increased irreversible capacity at the end of discharge and the polarization increase over the entire range of the operation, the increased polarization of the NCA derivatives with a large amount of rock-salt domains especially in the discharge direction or lithium insertion direction into the structure are mainly derived from slow lithium ion mobility due to the nickel ions in the lithium layers.
 |
| | Fig. 7 Nickel ions at the lithium sheets in a layered structure of [Li1−yNiy]3(b)[Ni,Co,Al]3(a)O2 based on a space group of Rm. | |
Fig. 8 shows polarization of NCA derivatives at the midpoint of the rechargeable capacity as a function of the y values in [Li1−yNiy]3(b)[Ni,Co,Al]3(a)O26(c) based on the space group of Rm. Polarization of NCA derivatives on discharge corresponding to lithium insertion into the structure is larger than that on charge. According to the results on the irreversible capacity, increased polarization of the NCA derivatives with rock-salt domains especially in the discharge direction is ascribed to slow lithium ion mobility due to the rock-salt domains. Polarization increases when the amount of rock-salt domains is above 2%, i.e., y > 0.02, and the largest amount of 12.8% of rock-salt domains among the NCA derivatives examined causes the largest polarization of 41 mV on charge and 125 mV on discharge.
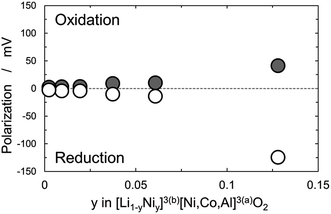 |
| | Fig. 8 Polarization at the midpoint of rechargeable capacity as a function of y in [Li1−yNiy]3(b)[Ni,Co,Al]3(a)O2 obtained by GITT experiments at C/10-rate at 20 °C. | |
Charge and discharge cycling stability of LiNi0.8Co0.15Al0.05O2 derivatives in lithium cells or cylindrical lithium-ion batteries with a graphite negative electrode
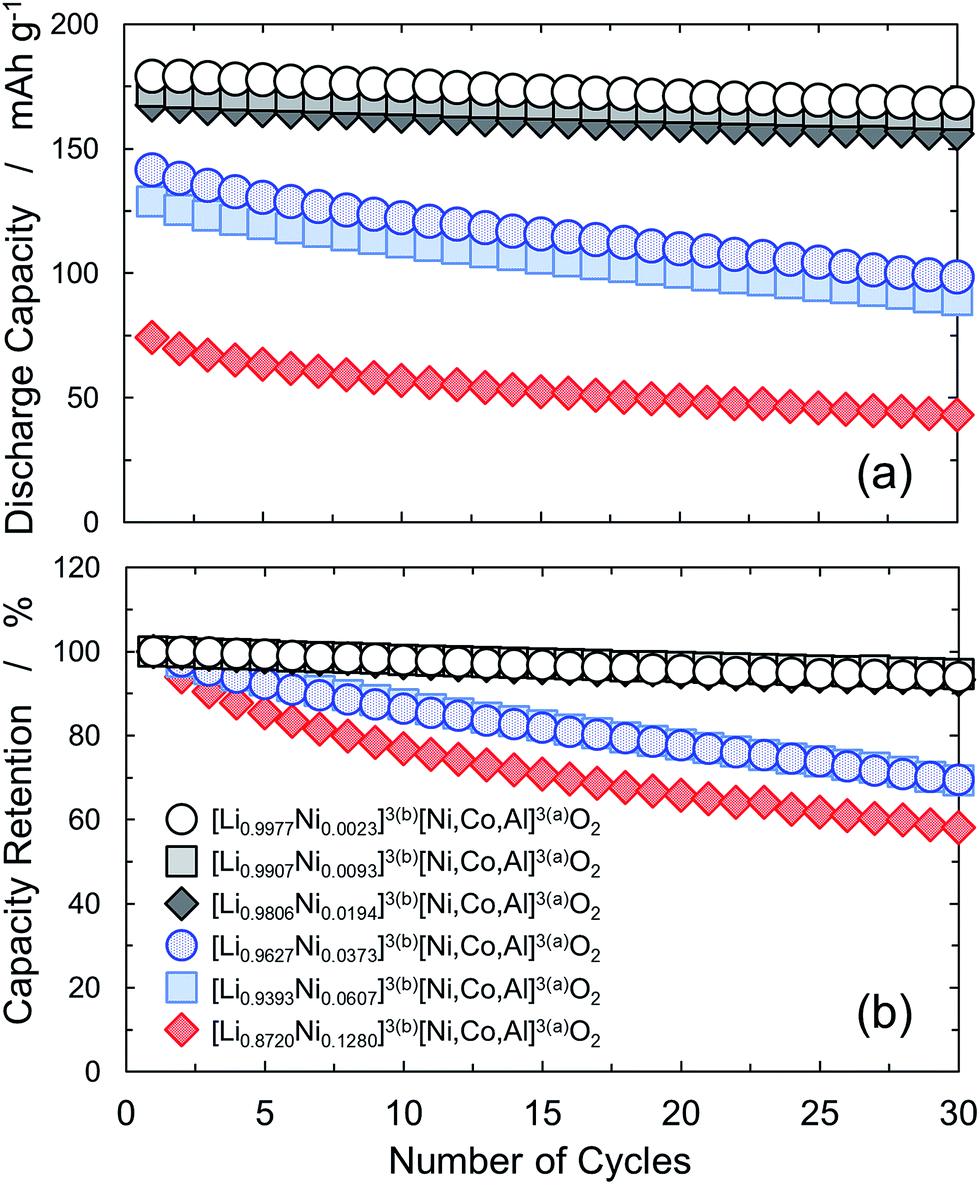
In order to examine the cumulative increase in polarization of the NCA derivatives during charge and discharge cycles, the cycling test of lithium cells of the NCA derivatives was performed at a low rate of C/10 at 20 °C. This measurement is appropriate to examine materials degradation since the materials are exposed in a charged state at high voltage for almost a month and other factors of battery deterioration can be excluded. Fig. 9 displays discharge capacities and capacity retentions of lithium cells of the NCA derivatives. As shown in Fig. 9(a), discharge capacities decrease as the amount of rock-salt domains increases. Of these, discharge capacities of the NCA derivatives in y < 0.02 draw parallel lines during 30 cycles. This means that the capacity retentions are almost the same values of 93–95% in 30 cycles for the samples having rock-salt domains of below 2% as shown in Fig. 9(b). Capacity retentions decrease to 69–70% when the amount of rock-salt domains exceeds 2%. The NCA derivative having the largest amount of 12.8% of rock-salt domains exhibits the lowest capacity retention of 58% for 30 cycles among the NCA derivatives. There seems to be a one-to-one correspondence between the capacity retentions for 30 cycles and the amount of rock-salt domains in terms of the increased polarization examined by GITT measurement associated with the slow lithium ion mobility derived from the rock-salt domains.
 |
| | Fig. 9 (a) Discharge capacities and (b) capacity retentions for the lithium cells of [Li1−yNiy]3(b)[Ni,Co,Al]3(a)O2 based on a space group of Rm operated in a voltage window of 4.2–2.5 V at C/10-rate at 20 °C. | |
Such a polarization increase during cycling is also superposed on the extended cycling test for the cylindrical lithium-ion batteries at an elevated temperature of 60 °C. The NCA derivatives of y = 0.0023 and 0.0607 were chosen to fabricate the cylindrical lithium-ion batteries with a graphite negative electrode because they exhibited the characteristic capacity retentions in the lithium cells for 30 cycles. The extended cycling test for the cylindrical lithium-ion batteries were performed for 500 cycles at 2C-rate at an elevated temperature of 60 °C. Fig. 10 displays the capacity retentions of the cylindrical lithium-ion batteries for 500 cycles. NCA of y = 0.0023 gives 83% capacity retention in the cylindrical lithium-ion battery after 500 cycles at 60 °C, and the capacity retention of the NCA derivative of y = 0.0607 in the cylindrical battery is 73%, which is lower than that of NCA. Battery deterioration derived from materials degradation of NCA is accelerated when the NCA derivatives have a large amount of rock-salt domains. Increased polarization during cycling due to nickel ions at the lithium layers is the main factor affecting the accelerated deterioration of cycling life. These results on the NCA derivatives strongly suggest that the materials innovation to prevent the formation of rock-salt domains will improve the cycling life of the cylindrical lithium-ion batteries at elevated temperature. Substitution of metal ions of lower oxidation states such as Mg2+ for nickel ions in NCA, which can act to increase the oxidation state of nickel ions, is one of the effective ways to improve battery performance. A part of our research works has been reported in our previous papers.10,19,27,50
 |
| | Fig. 10 Capacity retention for the 500 mA h class cylindrical lithium-ion batteries of y = 0.0023 and 0.0607 in [Li1−yNiy]3(b)[Ni,Co,Al]3(a)O2 with a graphite negative electrode operated in a voltage window of 4.1–3.0 V at 2C-rate at 60 °C. | |
Conclusions
NCA derivatives of LizNi0.8Co0.15Al0.05O2−δ (0.8 ≤ z ≤ 1.05) or [Li1−yNiy]3(b)[Ni,Co,Al]3(a)O26(c) based on a space group of Rm, in which the y value is the amount of rock-salt domains, were prepared by adjusting the Li/(Ni, Co, Al) ratios and electrochemical measurements in non-aqueous lithium cells were performed to clarify the relation between the amount of rock-salt domains and electrochemical reactivity in terms of rechargeable capacity and polarization. The rechargeable capacities of NCA derivatives in non-aqueous lithium cells decrease linearly as a function of the y value and reach zero at y ≈ 0.25 by extrapolating the straight line. Such a relation is derived from not only the lost capacity due to inactive rock-salt domains but the increased polarization. GITT measurement told us that nickel ions at the lithium layers in NCA of above 2% cause a polarization increase especially during discharge operation or of lithium insertion into the structure, which is ascribed to slow lithium ion mobility due to nickel ions in the lithium layers. The low rate cycling test of non-aqueous lithium cells of NCA derivatives indicated that the accelerated capacity fading is associated with the increased polarization. The extended cycling test of the cylindrical lithium-ion batteries with a graphite negative electrode at an elevated temperature of 60 °C indicated that the rock-salt domains in NCA cause and accelerate further degradation. Materials innovation to prevent the formation of rock-salt domains will be an effective way to improve the cycling life of lithium-ion batteries at elevated temperature. Substitution of Mg2+ ions for nickel ions in NCA will be discussed with respect to rechargeable capacity, polarization, and capacity retention in our forthcoming papers.
Conflict of interest
The authors declare no competing financial interest.
Acknowledgements
The authors wish to thank Mr Yasuhito Kondo for ICP-AES measurements and Mr Juntaro Seki for SEM observations. The synchrotron radiation experiments were performed at the BL33XU of SPring-8 with the approval of the Japan Synchrotron Radiation Research Institute (JASRI) (Proposal No. 2014A7008 and 2014B7008).
References
- M. S. Whittingham, Chem. Rev., 2004, 104, 4271 CrossRef CAS PubMed.
- T. Ohzuku and R. J. Brodd, J. Power Sources, 2007, 174, 449 CrossRef CAS.
- B. L. Ellis, K. T. Lee and L. F. Nazar, Chem. Mater., 2010, 22, 691 CrossRef CAS.
- V. Etacheri, R. Marom, R. Elazari, G. Salitra and D. Aurbach, Energy Environ. Sci., 2011, 4, 3243 CAS.
- T. Ohzuku, A. Ueda and M. Nagayama, J. Electrochem. Soc., 1993, 140, 1862 CrossRef CAS.
- C. Delmas, M. Ménétrier, L. Croguennec, I. Saadoune, A. Rougier, C. Pouillerie, G. Prado, M. Grüne and L. Fournès, Electrochim. Acta, 1999, 45, 243 CrossRef CAS.
- S. Tobishima and J. Yamaki, J. Power Sources, 1999, 81–82, 882 CrossRef CAS.
- R. A. Leising, M. J. Palazzo, E. S. Takeuchi and K. J. Takeuchi, J. Electrochem. Soc., 2001, 148, A838 CrossRef CAS.
- T. Ohsaki, T. Kishi, T. Kuboki, N. Takami, N. Shimura, Y. Sato, M. Sekino and A. Satoh, J. Power Sources, 2005, 146, 97 CrossRef CAS.
- T. Sasaki, V. Godbole, Y. Takeuchi, Y. Ukyo and P. Novák, J. Electrochem. Soc., 2011, 158, A1214 CrossRef CAS.
- S. Watanabe, M. Kinoshita, T. Hosokawa, K. Morigaki and K. Nakura, J. Power Sources, 2014, 258, 210 CrossRef CAS.
- S. Watanabe, M. Kinoshita, T. Hosokawa, K. Morigaki and K. Nakura, J. Power Sources, 2014, 260, 50 CrossRef CAS.
- K. Amine, C. H. Chen, J. Liu, M. Hammond, A. Jansen, D. Dees, I. Bloom, D. Vissers and G. Henriksen, J. Power Sources, 2001, 97–98, 684 CrossRef CAS.
- J. Shim, R. Kostecki, T. Richardson, X. Song and K. A. Striebel, J. Power Sources, 2002, 112, 222 CrossRef CAS.
- D. P. Abraham, R. D. Twesten, M. Balasubramanian, I. Petrov, J. McBreen and K. Amine, Electrochem. Commun., 2002, 4, 620–625 CrossRef CAS.
- D. P. Abraham, R. D. Twesten, M. Balasubramanian, J. Kropf, D. Fischer, J. McBreen, I. Petrov and K. Anine, J. Electrochem. Soc., 2003, 150, A1450 CrossRef CAS.
- Y. Itou and Y. Ukyo, J. Power Sources, 2005, 146, 39 CrossRef CAS.
- R. Kostecki, J. Lei, F. McLarnon, J. Shim and K. Striebel, J. Electrochem. Soc., 2006, 153, A669 CrossRef CAS.
- H. Kondo, Y. Takeuchi, T. Sasaki, S. Kawauchi, Y. Itou, O. Hiruta, C. Okuda, M. Yonemura, T. Kamiyama and Y. Ukyo, J. Power Sources, 2007, 174, 1131 CrossRef CAS.
- T. Sasaki, T. Nonaka, H. Oka, C. Okuda, Y. Itou, Y. Kondo, Y. Takeuchi, Y. Ukyo, K. Tatsumi and S. Muto, J. Electrochem. Soc., 2009, 156, A289 CrossRef CAS.
- S. Muto, Y. Sasano, K. Tatsumi, T. Sasaki, K. Horibuchi, Y. Takeuchi and Y. Ukyo, J. Electrochem. Soc., 2009, 156, A371 CrossRef CAS.
- T. Hayashi, J. Okada, E. Toda, R. Kuzuo, N. Oshimura, N. Kuwata and J. Kawamura, J. Electrochem. Soc., 2014, 161, A1007 CrossRef CAS.
- Y. Makimura, C. Okuda, T. Nonaka, Y. F. Nishimura, T. Sasaki and Y. Takeuchi, ECS Electrochem. Lett., 2014, 3, A66 CrossRef CAS.
- M. Guilmard, L. Croguennec, D. Denux and C. Delmas, Chem. Mater., 2003, 15, 4476 CrossRef CAS.
- M. Guilmard, L. Croguennec and C. Delmas, Chem. Mater., 2003, 15, 4484 CrossRef CAS.
- H.-J. Bang, H. Joachin, H. Yang, K. Amine and J. Prakash, J. Electrochem. Soc., 2006, 153, A731 CrossRef CAS.
- S. Muto, K. Tatsumi, Y. Kojima, H. Oka, H. Kondo, K. Horibuchi and Y. Ukyo, J. Power Sources, 2012, 205, 449 CrossRef CAS.
- B. H. Toby, J. Appl. Crystallogr., 2001, 34, 210 CrossRef CAS.
- A. Rougier, P. Gravereau and C. Delmas, J. Electrochem. Soc., 1996, 143, 1168 CrossRef CAS.
- S. Zheng, R. Huang, Y. Makimura, Y. Ukyo, C. A. J. Fisher, T. Hirayama and Y. Ikuhara, J. Electrochem. Soc., 2011, 158, A357 CrossRef CAS.
- Y. Makimura, S. Zheng, Y. Ikuhara and Y. Ukyo, J. Electrochem. Soc., 2012, 159, A1070 CrossRef CAS.
- T. Ohzuku, A. Ueda, M. Nagayama, Y. Iwakoshi and H. Komori, Electrochim. Acta, 1993, 38, 1159 CrossRef CAS.
- C. Delmas, J. P. Pérès, A. Rougier, A. Demourgues, F. Weill, A. Chadwick, M. Broussely, F. Perton, Ph. Biensan and P. Willmann, J. Power Sources, 1997, 68, 120 CrossRef CAS.
- B. Ammundsen and J. Paulsen, Adv. Mater., 2001, 13, 943 CrossRef CAS.
- T. Ohzuku, K. Ariyoshi, Y. Makimura, N. Yabuuchi and K. Sawai, Electrochemistry, 2005, 73, 2 CAS.
- M. M. Thackeray, S.-H. Kang, C. S. Johnson, J. T. Vaughey, R. Benedek and S. A. Hackney, J. Mater. Chem., 2007, 17, 3112 RSC.
- T. Ohzuku and Y. Makimura, Res. Chem. Intermed., 2006, 32, 507 CrossRef CAS.
- A. N. Mansour and C. A. Melendres, J. Phys. Chem. A, 1998, 102, 65 CrossRef CAS.
- R. D. Shannon, Acta Crystallogr., Sect. A: Cryst. Phys., Diffr., Theor. Gen. Crystallogr., 1976, 32, 751 CrossRef.
- N. Ogihara, S. Kawauchi, C. Okuda, Y. Itou, Y. Takeuchi and Y. Ukyo, J. Electrochem. Soc., 2012, 159, A1034 CrossRef CAS.
- N. Ogihara, Y. Itou, T. Sasaki and Y. Takeuchi, J. Phys. Chem. C, 2015, 119, 4612 CAS.
- W. Weppner and R. A. Huggins, J. Electrochem. Soc., 1977, 124, 1569 CrossRef CAS.
- D. W. Dees, S. Kawauchi, D. P. Abraham and J. Prakash, J. Power Sources, 2009, 189, 263 CrossRef CAS.
- R. Amin, D. B. Ravnsbæk and Y.-M. Chiang, J. Electrochem. Soc., 2015, 162, A1163 CrossRef CAS.
- A. Van der Ven and G. Ceder, Electrochem. Solid-State Lett., 2000, 3, 301 CrossRef CAS.
- J. R. Mueller-Neuhaus, R. A. Dunlap and J. R. Dahn, J. Electrochem. Soc., 2000, 147, 3598 CrossRef CAS.
- A. Van der Ven and G. Ceder, J. Power Sources, 2001, 97–98, 529 CrossRef CAS.
- K. Kang and G. Ceder, Phys. Rev. B: Condens. Matter Mater. Phys., 2006, 74, 094105 CrossRef.
- S.-H. Kang, W.-S. Yoon, K.-W. Nam, X.-Q. Yang and D. P. Abraham, J. Mater. Sci., 2008, 43, 4701 CrossRef CAS.
- K. Tatsumi, Y. Sasano, S. Muto, T. Yoshida, T. Sasaki, K. Horibuchi, Y. Takeuchi and Y. Ukyo, Phys. Rev. B: Condens. Matter Mater. Phys., 2008, 78, 045108 CrossRef.
Footnote |
| † Electronic supplementary information (ESI) available: Summary on the compositions of the samples determined by ICP-AES, SEM images, Co K-edge XANES spectra, intermittent charge and discharge curve, and voltage profiles in a lithium cell. See DOI: 10.1039/c6ta01251e |
|
| This journal is © The Royal Society of Chemistry 2016 |
Click here to see how this site uses Cookies. View our privacy policy here. 
 Open Access Article
 This Open Access Article is licensed under a Creative Commons Attribution-Non Commercial 3.0 Unported Licence