
 Open Access Article
 This Open Access Article is licensed under a
 Creative Commons Attribution 3.0 Unported Licence
Efficient solar cells are more stable: the impact of polymer molecular weight on performance of organic photovoltaics†
Z.
Ding‡
a,
J.
Kettle‡
*a,
M.
Horie
b,
S. W.
Chang
b,
G. C.
Smith
c,
A. I.
Shames
d and
E. A.
Katz
ef
aSchool of Electronics, Bangor University, Dean St, Bangor, Gwynedd, LL57 1UT, Wales, UK. E-mail: j.kettle@bangor.ac.uk; Fax: +44 (0)1248 382471
bDepartment of Chemical Engineering, National Tsing Hua University, 101, Sec. 2, Kuang-Fu Road, Hsinchu City 30013, Taiwan
cDepartment of Natural Sciences, University of Chester, Thornton Science Park, Chester CH2 4NU, UK
dDepartment of Physics, Ben-Gurion University of the Negev, P.O.B. 653, 8410501, Be'er-Sheva, Israel
eDepartment of Solar Energy and Environmental Physics, J. Blaustein Institutes for Desert Research, Ben-Gurion University of the Negev, Sede Boker Campus, 8499000, Israel
fIlse Katz Institute of Nano-Science and Technology, Ben-Gurion University of the Negev, Be'er Sheva 8410501, Israel
First published on 14th April 2016
Abstract
The principle remaining challenge in the research area of organic photovoltaic (OPV) materials is to develop solar cells that combine high efficiency, stability and reproducibility. Here, we demonstrate an experimental strategy which has successfully addressed this challenge. We produced a number of samples of the highly efficient PTB7 polymer with various molecular weights (Mn ∼ 40–220k). OPV cells fabricated with this polymer demonstrated significant improvement of the cell efficiency (by ∼90% relative) and lifetime (by ∼300% relative) with the Mn increase. We attribute these effects to the lower density of recombination centers (persistent radical defects revealed by EPR spectroscopy) and better photoactive layer morphology in the samples with higher Mn. Relevance of the observed correlation between the OPV efficiency and stability is discussed.
1. Introduction
Organic photovoltaics (OPVs) using a bulk heterojunction (BHJ) structure show promise as an alternative to inorganic semiconductors for solar electricity production and have shown power conversion efficiencies (PCE) in excess of 10%.1 Much of this success has come with conjugated polymer/fullerene combinations via optimization of polymer design and device fabrication procedures.2–4 Though the operational lifetime of OPVs is much shorter than that of commercial inorganic PV (∼25 years for Si devices), significant progress has been made in improving the stability of OPVs.5 However, the greatest challenge in this research area is to develop OPV devices combining high efficiency and stability. Indeed, the record outdoor operational lifetime of ∼2 years was demonstrated for low-efficient devices (P3HT-PCBM BHJ devices with PCE ∼1%).6 On the other hand, poly({4,8-bis[(2-ethylhexyl)oxy]benzo[1,2-b:4,5-b′]dithiophene-2,6-diyl}{3-fluoro-2-[(2-ethylhexyl)carbonyl]thieno[3,4-b]thiophenediyl}) (PTB7), an attractive low bandgap polymer,7 is found to exhibit PCE over 7% when blended with the fullerene derivative [6,6]-phenyl C71-butyric acid methyl ester (C71-PCBM)8 but suffers from poor stability.9–11Another vital drawback of polymer OPVs is poor reproducibility of the physical and electronic properties of polymer-based semiconductors. Different samples of the same polymer might differ by the molecular weight, amount of defects and residual impurities, and consequentially, different polymer batches might perform quite differently in OPV devices.12 To resolve this limitation an extensive experimental program with a wide international cooperation is currently planned.13
Recently, Troshin et al. suggested that Electron Paramagnetic Resonance (EPR) spectroscopy is a very powerful tool for assessment of the quality of different conjugated polymers used as the electron donor in OPV12 and monitoring their photochemical and thermal degradation.11 It has been shown that different batches of the same conjugated polymer might contain substantially different amounts of radical species behaving as traps for mobile charge carriers. Indeed, a correlation between the concentrations of radicals in various batches of conjugated polymers and PCE of the OPV cells on their basis has been revealed.12 Furthermore, the relative stability of materials was suggested to be quantified from the rates of radical accumulation estimated from their EPR spectra.11
In this paper, we present photovoltaic performance and lifetime of OPV devices fabricated with PTB7 synthesized by various methods or using different commercial sources. We report that the increase in polymer molecular weight results in decrease of the density of radical defects in the material and corresponding improvement of efficiency and stability of PTB7-based solar cells. We suggest that this relationship may also apply to other conjugated polymers. Furthermore, the study of various grades of the same polymer allows us to postulate a general rule: namely, a more efficient cell should be more stable. Indeed, photoinduced degradation of PV devices under operation is caused by sunlight. The larger the proportion of the incident sunlight power that is converted to electrical power, the smaller the part remaining for activation of degradation. This positive conclusion may be very important for future development of next generation PV.
2. Experimental
2.1 Synthesis of PTB7
2,6-Bis(trimethyltin)-4,8-bis(2-ethylhexyl)benzo[1,2-b:3,4-b′]dithiophene (66.6 mg, 0.085 mmol) and 2-ethylhexyl-4,6-dibromo-3-fluorothieno[3,2-c]thiophene-2-carboxlate (40.0 mg, 0.085 mmol) were dissolved in 0.96 mL p-xylene and 0.24 mL dimethylformamide (DMF) in a 5 mL Schlenk tube. Tris(dibenzylidenacetone)palladium(0) (2.3 mg, 0.003 mmol, 5 mol%) was added, and the reaction was stirred at 120 °C for 5.5 hours. Then 0.2 mL 4-bromoanisole was added and stirred at 120 °C for an hour. The resulting mixture was precipitated into a mixture of methanol (100 mL)/37% HCl aqueous solution (2 mL). The precipitate was washed by Soxhlet extraction with ethanol for one day followed by a further day with methylethylketone (MEK), and then extracted with CHCl3. The solution was filtered through a silica gel column (ca. 1 cm of silica gel in height). The chloroform solutions of the polymer were re-precipitated into methanol and then collected using centrifugation at 6000 rpm for 1 minute. The precipitates were dried in vacuum to yield deep blue powder PTB7-1 (57 mg, 89% yield). GPC: Mn = 41![[thin space (1/6-em)]](https://www.rsc.org/images/entities/char_2009.gif) 200, Mw/Mn = 2.55.
200, Mw/Mn = 2.55.
Similar procedure was applied using tetrakis-(triphenylphosphine)palladium(0) (2.0 mg, 0.003 mmol, 5 mol%) to yield deep blue powder PTB7-3 (63 mg, 98% yield). GPC: Mn = 108900, Mw/Mn = 2.56. PTB7-1 obtained from Pd2(dba)2 catalyst showed lower molecular weight of Mn = 41k than that of PTB7-3 obtained from Pd(PPh3)4 catalyst (Mn = 109k). The commercial polymers PTB7-2 and PTB7-4 showed relatively high molecular weight of Mn = 83k and very high molecular weight of Mn = 216k, respectively.
Polymer purification was carried out using the same approach adopted in an earlier paper.14 Impurity levels were measured using elemental analysis and content of the main impurities (P, B and Pd) were measured to be <0.3% (the measureable limit for our equipment).
2.2 Material characterisation
Molecular weight and polydispersity index (PDI) of the polymers were measured by gel permeation chromatography (GPC) using THF as an eluent and polystyrene standards. The optical and electrochemical properties of the polymers were examined by UV-vis absorption spectroscopy and cyclic voltammetry (CV). CV of the polymer films was performed on Pt plate in MeCN solution containing 0.10 M n-Bu4NPF6 with scan rate of 0.10 V s−1.2.3 EPR measurements
Room temperature (RT, T = 295 K) EPR measurements were done on both polycrystalline and thick film PTB7 samples using a EMX-220 X-band (ν = 9.4–9.8 GHz) spectrometer (Bruker Biospin, Rheinstetten, Germany) equipped with a Bruker ER 4102ST rectangular TE102 resonator and an Agilent 53150A frequency counter. Densities of paramagnetic centers Ns were determined by comparison of doubly integrated intensities of EPR lines from the samples under study with the intensity of the ERP signal of the purified 5 nm detonation nanodiamond powder with known density of S = 1/2 paramagnetic centers Ns = 6.3 × 10¹⁹ spin per g.15 Bruker's WIN-EPR and SimFonia as well as Origin (OriginLab Corp., Northampton, USA) software were used for processing and simulation of EPR spectra.Dark EPR spectra were measured on both initial polymer powders and films deposited on Si substrate. Prior to measurements all samples were kept under nitrogen atmosphere and in dark conditions. EPR spectra of PTB7 powders were recorded at the following instrumental conditions: non-saturating microwave power PMW = 0.2 mW, 100 kHz magnetic field modulation amplitude Amod = 0.03 mT, receiver gain = 2 × 10⁵, number of coherent acquisitions naqc = 25. In Fig. 1(a) peak-to-peak intensities of these spectra are normalized per 1 mg and, thus, reflect real spin densities in the samples under study. Due to both smaller effective weights of the polymer films as well as strong non-resonance absorption of microwave by the silicon substrate, the PTB7 film samples provide significantly less intensive EPR signals. For better accuracy of spin density estimation EPR spectra of films as well as the corresponding detonation nanodiamond reference sample, attached to the same substrate, were recorded in partially saturating (PMW = 5 mW) and over-modulated (Amod = 0.3 mT) conditions with receiver gain = 2 × 10⁶ and naqc = 100.
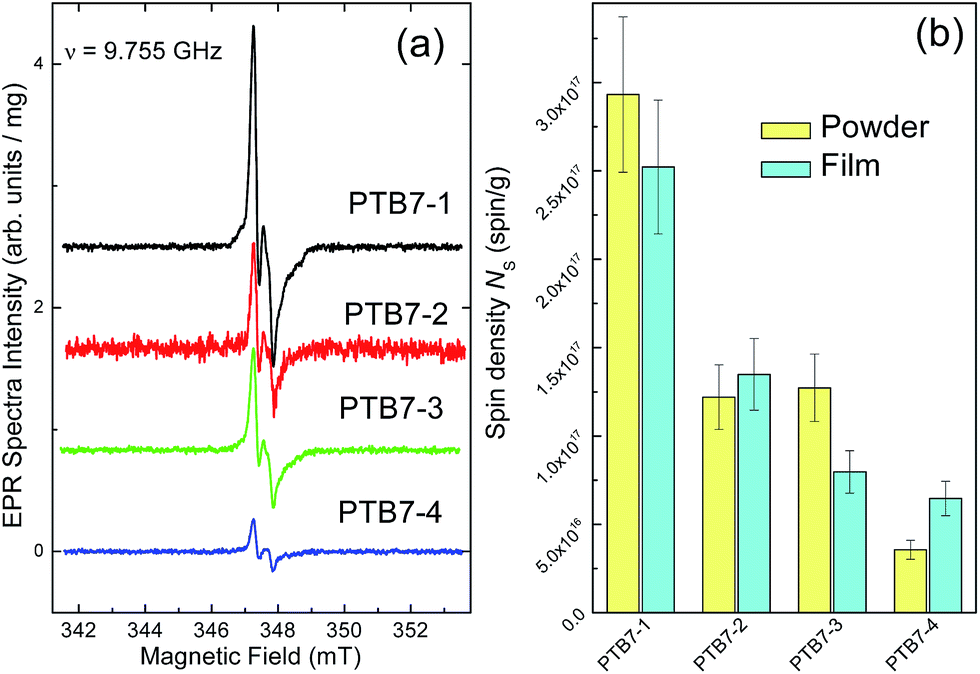 | ||
| Fig. 1 (a) X-band RT dark EPR spectra of PTB7 powders recorded at PMW = 0.2 mW, Amod = 0.03 mT, receiver gain = 2 × 10⁵, naqc = 25 and ν = 9.755 GHz. Background signals are subtracted, vertical scale is normalized per unit mass, spectra are vertically shifted for better presentation, differences in signal-to-noise ratios are due to variations in the weight of powders under study; (b) spin densities Ns of paramagnetic defects in PTB7 powders (yellow bars) and films (magenta bars). | ||
2.4 OPV fabrication and characterisation
Inverted OPV devices were initially prepared in a clean room environment using indium tin oxide (ITO) coated glass substrates (Rs = 16 Ω per square, transparency = 84% purchased from Xinyan Ltd.) that were first cleaned using deionised water, acetone and isopropanol in an ultrasonic cleaner, then treated in a UV-ozone reactor with oxygen plasma for 10 minutes. A zinc oxide (Zn) electron transporting layer was prepared from zinc acetate dehydrate (109 mg) dissolved in 2-methoxyethanol (1 mL) and ethanolamine (0.03 mL) solution, which was spin-coated at 2000 rpm on the ITO substrate. The samples were then annealed in the presence of atmospheric air at temperatures of 150 °C for the Zn acetate to calcinate into ZnO. Active layer BHJ blends using PTB7 (as a donor) and [6,6]-phenyl-C71-butyric acid methyl ester (C71-PCBM) (as an acceptor) with weight ratios 1:1.5 were prepared and mixed with chlorobenzene solvent with a concentration of 30 mg mL−1. Initial trials showed varying blend ratio and concentration for different PTB7 polymers led to the same optimal blend. Therefore, all results were obtained with PTB7 polymers which were prepared with the same ratio and concentration. To improve the performance and to be consistent with other reports, the processing additive 1,8-diiodoctane (DIO) was dissolved into the blend at a concentration of 2.5%.16–18 Prior to coating, the blend was allowed to dissolve for 1 hour on a hot plate at 45 °C. Samples were transferred into a nitrogen atmosphere glovebox ([O2], < 1 ppm; [H2O], <100 ppm), where the active layers was applied by spin-casting from a 45 °C solution. The active layer were annealed at 45 °C for 15 minute before thermal evaporation of the cathode was performed through a shadow mask to define device area and consisted of 8 nm of MoO3 and 100 nm of silver (Ag).
Devices were checked for initial performance prior to lifetime testing. The measurement system used to characterize the devices consisted of a Newport solar simulator with 100 mW cm−2 AM1.5G output calibrated using a silicon reference cell from RERA in the Netherlands. The open circuit voltage (Voc), short-circuit current density (Jsc), fill factor (FF) and PCE values are averaged from six cells (for each polymer). The devices were then placed under a halogen light source of 1 sun (calibrated by the silicon reference cell) for light soaking. Devices were kept at open circuit in between measurements and I–V measurements were made every 20 minutes, with more details of the procedure reported elsewhere.18 This was conducted in accordance with ISOS-L-2 standards.19 Devices were measured until the PCE reached 10% of its initial value.
3. Results
3.1 Material characterisation
PTB7 has been synthesized via Stille coupling reactions using two different palladium complex catalysts, Pd2(dba)2 or Pd(PPh3)4, giving PTB7-1 and PTB7-3, respectively, as shown in Scheme 1. For a comparison, PTB7-2 and PTB7-4 were purchased from Lumtec Inc., Taiwan and Ossila Ltd., UK, respectively. The polymer notation is in ascending order of the molecular weight (PTB7-1 and PTB7-4 possess the lowest and the highest molecular weight, respectively). These values and the polymer polydispersity indexes (PDI) are summarized in Table 1 and Fig. S1 in the ESI.†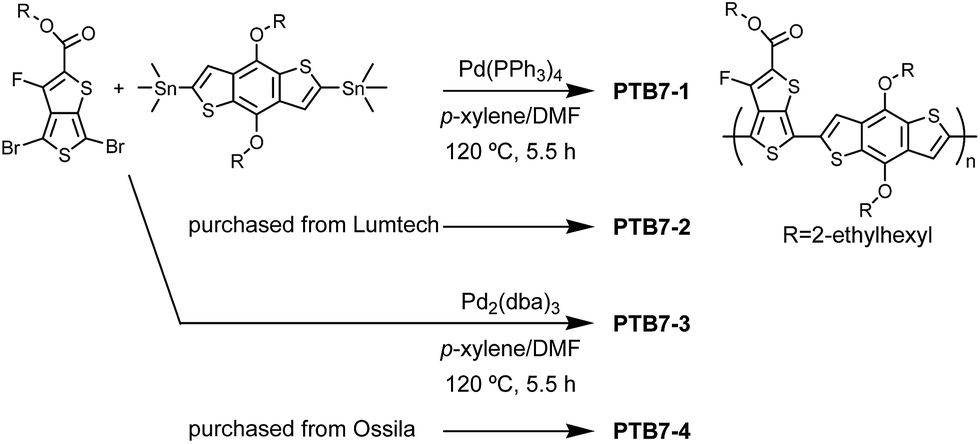 | ||
| Scheme 1 Preparation of PTB7, in order from low (PTB7-1) to high molecular weight (PTB7-4). | ||
| Polymer | M n (PDI) | λ max [nm] | E g [eV] | HOMOd [eV] | LUMOe [eV] | |
|---|---|---|---|---|---|---|
| Solution | Film | |||||
| a Measured by UV-vis light spectroscopy. b Measured by cyclic voltammetry (CV). c Optical band gap. d Highest occupied molecular orbital, HOMO = −(4.8 + Epa-onset − EFc). Half wave potential of ferrocene, EFc (=0.845 V vs. AgCl/Ag), was measured in MeCN solution. e Lowest occupied molecular orbital, LUMO = −(4.8 + Epc-onset − EFc). | ||||||
| PTB7-1 | 41200 (2.55) |
666 | 668 | 1.67 | −5.08 | −2.95 |
| PTB7-2 | 83300 (2.83) |
671 | 670 | 1.66 | −5.12 | −3.01 |
| PTB7-3 | 109900 (2.56) |
647 | 640 | 1.57 | −5.18 | −3.11 |
| PTB7-4 | 215700 (2.46) |
671 | 675 | 1.63 | −5.19 | −3.10 |
The absorption spectra of the PTB7 samples dissolved in THF and in thin film form are presented in Fig. S2† (see also Table 1). The absorption characteristics have some minor differences and this can be explained from the GPC data (see Fig. S1†). In particular, PTB7-3, has a small peak at the retention time around 18 min is seen, which corresponds to Mn ≈ 800k. This indicates that a high molecular weight fraction is present and this is likely to contribute to form the shoulder absorption around 750 nm. In any case, the variation in optical performance of the polymers is not significant enough to cause large variations in solar cell performance. The optical band gap (Eg) was estimated from the onset of the absorption spectra in thin film. PTB7-3 shows the lowest λmax and exhibits a broad absorption peak; therefore, it gives lower Eg of 1.57 eV than others (Eg = 1.66–1.67 eV). This is desirable from a photovoltaic point of view as it improves spectral match between the AM1.5G sunlight and the polymer absorption spectra. HOMO and LUMO levels were estimated from absorption and electrochemical measurements. For donor materials in OPV, deeper HOMO levels are preferred20 and based on this assertion, PTB7-4 is likely to be the best candidate, however, the data indicate that only a moderate difference in solar cell performance should be observed between PTB7-1–4 samples.
3.2 EPR of powders and films
Fig. 1(a) shows dark EPR spectra of PTB7 powders of various molecular weights recorded at the same instrumental conditions (see Methods). EPR spectra of all powders demonstrate the same complicated polycrystalline pattern characterized by the effective g-factors g1 = 2.0064 ± 0.0002, g2 = 2.0048 ± 0.0002 and g3 = 2.00384 ± 0.0002. The similarity of g-factors between polymers indicates similarity of paramagnetic species revealed in all samples. At PMW > 1 mW on both sides of the main signal, several broad satellite lines split by ∼0.4 mT are observed. Signals of similar shape have been recently reported for photothermally aged PTB7 films.11 Simulation of this spectrum done using the model of a single S = 1/2 radical having tentative rhombically distorted structure where the uncoupled electron spin interacts with six I = 1/2 nuclei in surrounding, provides the following spin-Hamiltonian parameters: g1 = 2.0068, g2 = 2.0038, g3 = 2.0026, and hyperfine proton couplings a1 = a2 < 0.06 mT and a3 = 0.36 mT (see Fig. S4†).Electron spin–lattice and spin–spin relaxation times were estimated from the saturation curves obtained for powder samples, and found to be the same (within ±30% estimation error) for all polymers under study: Tsl = 1.4 × 10⁻⁶ s and Tss = 1.4 × 10⁻⁸ s, respectively. This relatively short Tsl value found is similar to previous reports for undoped polymers that have been exposed to air at ambient temperature.21 EPR spectra of film samples being recorded under alternative instrumental conditions (see Methods) provide the same EPR patterns as their initial powders (spectra not shown).
Fig. 1(b) and Table 2 summarize densities of paramagnetic defects (positive polarons) in the samples, Ns, and evidence that in both powders and films the Ns density correlates inversely with the molecular weight: as lower is Mn as higher is Ns. Spin densities in polymers and films are found to be practically the same (within the experimental error) which indicates the film preparation and deposition do not create additional defects in polymer structures. This means that PTB7 samples do not incorporate spin-active units in their monomer structure and the observed radical defects present mostly on the polymer chain ends. Moreover, all results obtained on films correlated well with the OPV cell performance (see Table 2 and discussion below).
| Polymer samples | M n (Mw/Mn) | Defect spin density Nsa (spin per g) | V oc (V) | J sc (mA cm−2) | Fill factor | PCE (%) | t 1/2 (hours) | |
|---|---|---|---|---|---|---|---|---|
| Powder | Film | |||||||
| a Errors in spin density determination do not exceed ±15%. b Open circuit voltage. c Short-circuit current density. d Half lifetime of the OPV under 1 sun irradiation. | ||||||||
| PTB7-1 | 41200 (2.55) |
2.9 × 10¹⁷ | 2.5 × 10¹⁷ | 0.73 ± 0.01 | 10.1 ± 0.2 | 0.55 ± 0.01 | 4.02 ± 0.10 | 29.8 |
| PTB7-2 | 83300 (2.83) |
1.2 × 10¹⁷ | 1.3 × 10¹⁷ | 0.73 ± 0.01 | 12.1 ± 0.2 | 0.56 ± 0.01 | 4.92 ± 0.05 | 31.5 |
| PTB7-3 | 108900 (2.56) |
1.3 × 10¹⁷ | 8.0 × 10¹⁶ | 0.71 ± 0.01 | 13.9 ± 1.0 | 0.62 ± 0.03 | 6.04 ± 0.3 | 56.5 |
| PTB7-4 | 215700 (2.46) |
3.6 × 10¹⁶ | 6.5 × 10¹⁶ | 0.70 ± 0.01 | 15.7 ± 0.5 | 0.61 ± 0.02 | 6.71 ± 0.29 | 98.8 |
3.3 OPV performance
Fig. 2 shows the current density–voltage (J–V) characteristics of the BHJ OPV cells fabricated with PTB7-1, -2, -3 and -4 and C71-PCBM. Averaged principle parameters of these cells are summarized in Table 2. It appears that the highest molecular weight polymer (PTB7-4) leads to the highest PCE of 6.71% whilst the lowest molecular weight polymer (PTB7-1) leads to the poorest OPV performance (PCE = 4.02%). The medium molecular weight polymer, i.e.PTB7-2 and PTB7-3 showed medium PCE of 4.92% and 6.04%, respectively. The observed improvement in PCE with the Mn increase is caused mostly by differences in Jsc. Since the absorption spectra of the samples are relatively similar, we explain this by two reasons. First, relationships between Mn, Ns and Jsc indicate that samples with higher Mn contain fewer recombination centers in the polymer moiety of the photoactive layer and thus exhibit higher photocurrents.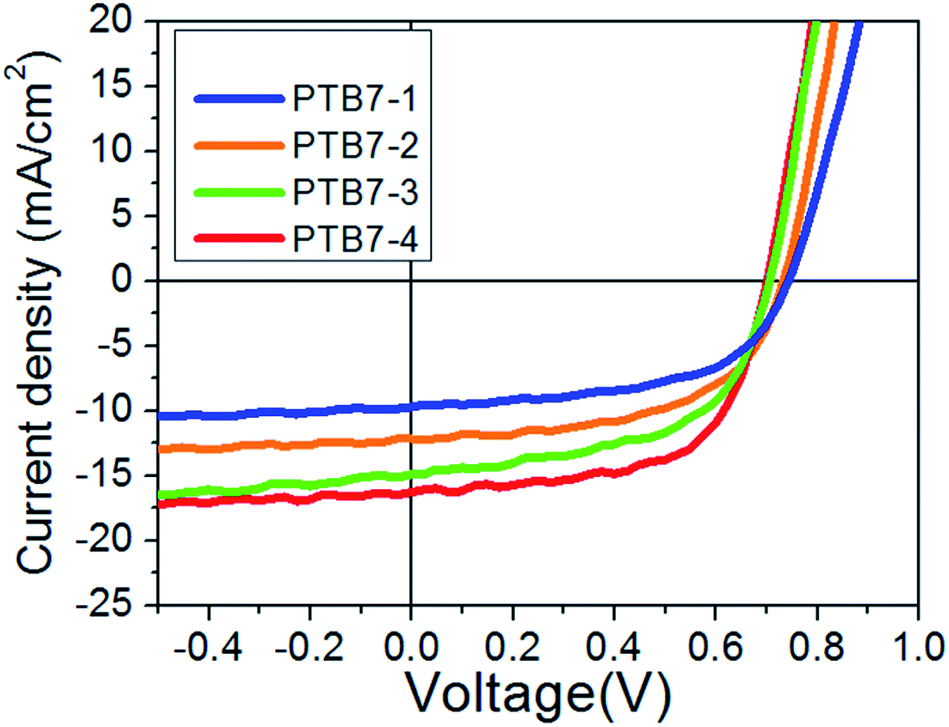 | ||
| Fig. 2 J–V characteristics of OPV devices fabricated with polymers PTB7-1–4 under AM1.5G illumination. | ||
Second, this trend can also be equated to differences in the morphology of the photoactive layer. Lower Mn samples have smaller donor/acceptor interface area and thus provide poorer exciton dissociation efficiency. This statement is supported by AFM images of the photoactive layers (Fig. 3a, c, e and g). The highest molecular weight polymer i.e.PTB7-4 (blended with C71-PCBM) yielded the smoothest surface with Root Mean Square (RMS) roughness = 2.0 nm (Fig. 3(g)) whilst the low molecular weight one i.e.PTB7-1 showed the highest: 7.2 nm (Fig. 3(a)). The PTB7-2 and PTB7-3 polymer with moderate Mn had an intermediate roughness of 5.9 nm and 4.9 nm, respectively. The discrete surface roughness is likely due to chain relaxation. Indeed, high molecular weight polymer, with high Tg, is difficult to move. Meanwhile, low molecular weight polymers, with lower Tg, are more mobile. Therefore they could relax from an as-spun ultra-smooth surface to a relatively rough surface during annealing and/or storage. Such relaxation could lead to undesirable phase separation21 and the increased film roughness could cause the decrease in the Jsc.22
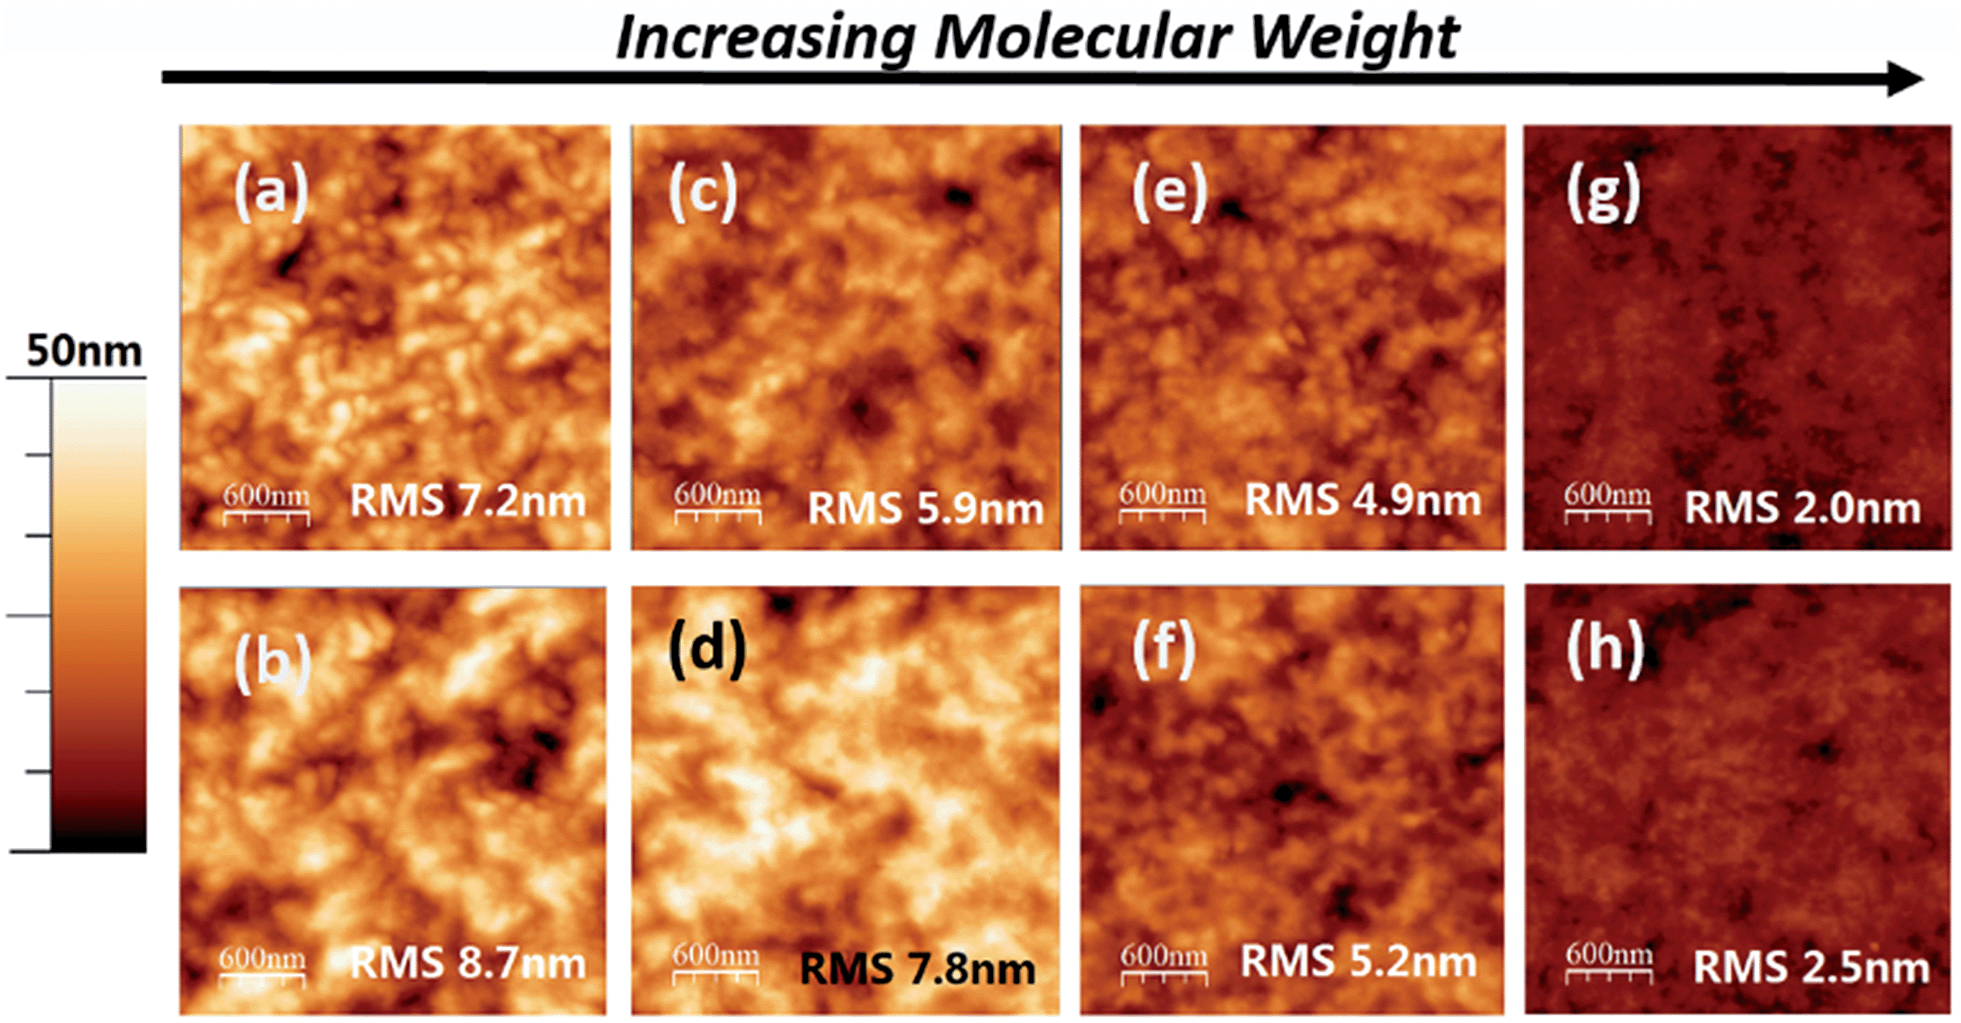 | ||
| Fig. 3 AFM images with indicated RMS values for PTB7:C71-PCBM blends before (a, c, e, g) and after (b, d, f, h) light soaking. (a, b) PTB7-1:C71-PCBM; (c, d) PTB7-2:C71-PCBM; (e, f) PTB7-3:C71-PCBM; (g, h) PTB7-4:C71-PCBM. | ||
3.4 OPV performance
Lifetime stability tests for non-encapsulated devices were carried out under continuous illumination at 1 sun (Fig. 4). Overall, the device fabricated with the high molecular weight polymer (i.e.PTB7-4, Mn = 216k) possessed the highest stability, where the time to reach 50% of its initial value (t1/2) was recorded at 96 hours. As the molecular weight of the polymer decreased, the stability of the devices appeared to reduce, as evidence by the fall in t1/2 values. The decrease observed in PCE seems to be determined primarily by a drop in Jsc and supplemented by the decrease in FF.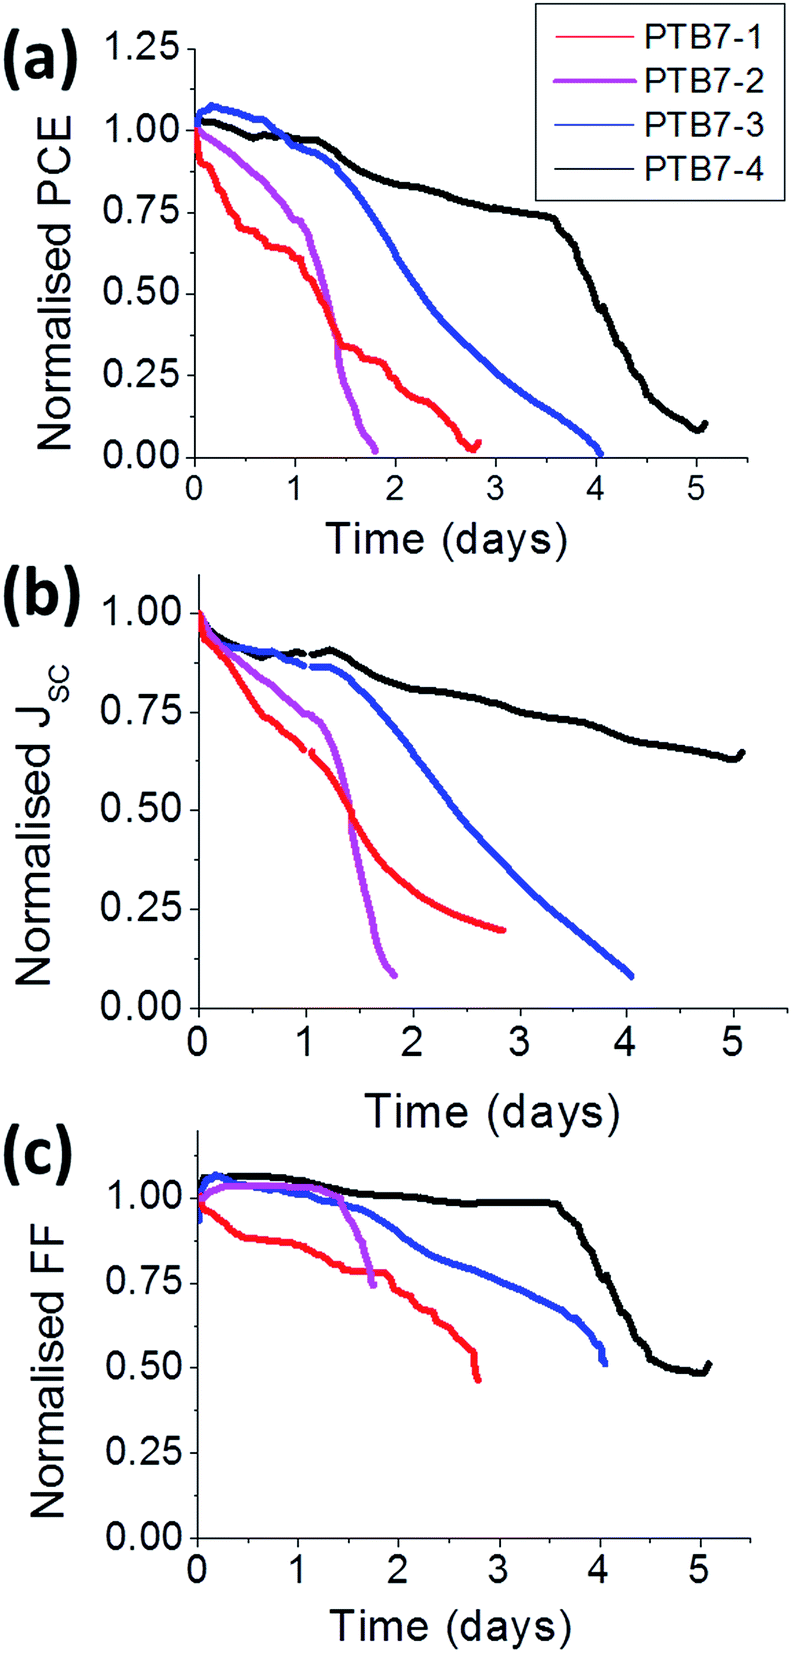 | ||
| Fig. 4 Device characteristics for non-encapsulated PTB7-1–4:C71-PCBM inverted solar cells as a function of time under illumination of 1 sun. Each parameter was normalised to the initial value at the start of the aging process. | ||
Difference in morphological degradation in the active layer of the cells (Fig. 3) may be among the reasons for the variation in Jsc degradation rates. Considering the topography before and after light soaking, it is clear that the most significant changes were observed for the lower molecular weight polymers. The RMS rose from 7.2 nm to 8.98 nm for PTB7-1 (Fig. 3a and b) and from 5.9 nm to 7.8 nm for PTB7-2 (Fig. 3c and d). At the same time, the PTB7-3 and PTB7-4 showed moderate increases of less than 0.5 nm (Fig. 3e–h). As discussed above, a drastic change of the photoactive layer morphology could lead to undesirable donor–acceptor interfaces and could be a reason for the rapid drop in Jsc in PTB7-1 and PTB7-2 during light soaking. It is clear from the AFM data that a morphological change occurred during ageing experiments, leading to potential phase segregation. At the same time, the density of recombination centers could increase. For the moment, it is difficult to distinguish which mechanism is more dominant and leading to the fall off in Jsc in Fig. 4.
On the other hand, the observed correlation between the cell PCE and lifetime suggests a general trend: the more efficient cells should be more stable. Indeed, photoinduced degradation of PV devices under operation is caused by sunlight. The more incident sunlight power converted to electrical power, the less remains for activation of degradation. During operation of polymer PVs, some fraction of the excitons generated under sunlight undergo non-radiative quenching leading to the photochemical degradation.11 Efficient PV conversion due to the donor–acceptor charge transfer suppresses this process. Indeed, adding acceptor (PCBM) to the polymer blends was found to slow considerably the polymer photochemical degradation, presumably via sub nanosecond quenching of the reactive excited state by forming a lower energy charge transfer complex.23,24 On the other hand, in small-molecule fullerene OPV cells, photochemical degradation of fullerenes was reported to occur by the same mechanism in both bi-layer and BHJ devices.25 However, the process in the BHJ is slower due to more rapid exciton quenching by charge-transfer.
At the present stage of research, it is probably too early to formulate this conclusion as a general rule. However, it should be taken into account for future development of various novel PV technologies (including OPV, and perovskite-based cells) and checked in further research.
4. Conclusions
In summary, we produced a number of PTB7 samples with various moleculaar weights (Mn ∼ 40–220k) and presented material characteristics and photovoltaic performance and lifetime of OPV devices fabricated with these samples. EPR spectroscopy revealed an inverse correlation between Mn and the densities of paramagnetic defects Ns in both powders and films of PTB7. This indicates that the observed radical defects present mostly on the polymer chain ends. Moreover, we demonstrated a gradual improvement in the PCE of PTB7:C71-PCBM OPV cells with the increase of Mn of PTB7 due to increases in the cell short-circuit current, Jsc. We attributed this effect to the lower density of recombination centers and better photoactive layer morphology in the samples with higher Mn. Finally, the correlation between PCE and stability of the OPV cells was documented, showing improvement of the OPV lifetime by ∼300% for high Mn samples.The reported findings constitute a basis for further research that should include on one hand more detailed EPR study of encapsulated and non-encapsulated blend films in as produced state as well as after various doses of solar illumination, and on other hand analyses extended to other polymers.
Acknowledgements
JK and EK would like to acknowledge the support of support of the European Commission's StableNextSol COST Action MP1307. JK would like to thank Sêr Cymru national research network in Advanced Engineering and Materials.References
- J. You, L. Dou, K. Yoshimura, T. Kato, K. Ohya, T. Moriarty and Y. Yang, A polymer tandem solar cell with 10.6% power conversion efficiency, Nat. Commun., 2013, 4, 1446 CrossRef PubMed.
- E. Bundgaard, M. Helgesen, J. E. Carlé, F. C. Krebs and M. Jørgensen, Advanced functional polymers for increasing the stability of organic photovoltaics, Macromol. Chem. Phys., 2013, 214(14), 1546–1558 CrossRef CAS.
- N. Kaur, M. Singh, D. Pathak, T. Wagner and J. M. Nunzi, Organic materials for photovoltaic applications: Review and mechanism, Synth. Met., 2014, 190, 20–26 CrossRef CAS.
- K. A. Mazzio and C. K. Luscombe, The future of organic photovoltaics, Chem. Soc. Rev., 2015, 44(1), 78–90 RSC.
- S. A. Gevorgyan, M. V. Madsen, B. Roth, M. Corazza, M. Hösel, R. R. Søndergaard and F. C. Krebs, Lifetime of Organic Photovoltaics: Status and Predictions, Adv. Energy Mater., 2015 DOI:10.1002/aenm.201501208.
- D. Angmo and F. C. Krebs, Over 2 Years of Outdoor Operational and Storage Stability of ITO-Free, Fully Roll-to-Roll Fabricated Polymer Solar Cell Modules, Energy Technol., 2015, 3(7), 774–783 CrossRef CAS.
- Z. He, C. Zhong, S. Su, M. Xu, H. Wu and Y. Cao, Enhanced power-conversion efficiency in polymer solar cells using an inverted device structure, Nat. Photonics, 2012, 6(9), 591–595 CrossRef.
- Y. Liang, Z. Xu, J. Xia, S. T. Tsai, Y. Wu, G. Li and L. Yu, For the bright future—bulk heterojunction polymer solar cells with power conversion efficiency of 7.4%, Adv. Mater., 2010, 22(20), E135–E138 CrossRef CAS PubMed.
- J. Razzell-Hollis, J. Wade, W. C. Tsoi, Y. Soon, J. Durrant and J. S. Kim, Photochemical stability of high efficiency PTB7:PC 70 BM solar cell blends, J. Mater. Chem. A, 2014, 2(47), 20189–20195 CAS.
- V. S. Balderrama, J. G. Sanchez, M. Estrada, J. Ferre-Borrull, J. Pallares and L. F. Marsal, Relation of Polymer Degradation in Air With the Charge Carrier Concentration in PTB1, PTB7, and PCBM Layers Used in High-Efficiency Solar Cells, IEEE Journal of Photovoltaics, 2015, 5(4), 1093–1099 CrossRef.
- L. A. Frolova, N. P. Piven, D. K. Susarova, A. V. Akkuratov, S. D. Babenko and P. A. Troshin, EPR spectroscopy for monitoring the photochemical and thermal degradation of conjugated polymers used as electron donor materials in organic bulk heterojunction solar cells, Chem. Commun., 2015, 51, 2242–2244 RSC.
- D. K. Susarova, N. P. Piven, A. V. Akkuratov, L. A. Frolova, M. S. Polinskaya, S. A. Ponomarenko, S. D. Babenkob and P. A. Troshin, EPR spectroscopy as a powerful tool for probing the quality of conjugated polymers designed for photovoltaic applications, Chem. Commun., 2015, 51, 2239–2241 RSC.
- http://stablenextsol.eu/ .
- J. Kettle, M. Horie, L. A. Majewski, B. R. Saunders, S. Tuladhar, J. Nelson and M. L. Turner, Optimisation of PCPDTBT solar cells using polymer synthesis with Suzuki coupling, Sol. Energy Mater. Sol. Cells, 2011, 95(8), 2186–2193 CrossRef CAS.
- V. Y. Osipov, A. I. Shames, T. Enoki, K. Takai, M. V. Baidakova and A. Y. Vul', Paramagnetic defects and exchange coupled spins in pristine ultrananocrystalline diamonds, Diamond Relat. Mater., 2007, 16, 2035–2038 CrossRef CAS.
- S. J. Lou, J. M. Szarko, T. Xu, L. Yu, T. J. Marks and L. X. Chen, Effects of additives on the morphology of solution phase aggregates formed by active layer components of high-efficiency organic solar cells, J. Am. Chem. Soc., 2011, 133(51), 20661–20663 CrossRef CAS PubMed.
- H. Waters, N. Bristow, O. Moudam, S. W. Chang, C. J. Su, W. R. Wu and J. Kettle, Effect of processing additive 1,8-octanedithiol on the lifetime of PCPDTBT based Organic Photovoltaics, Org. Electron., 2014, 15(10), 2433–2438 CrossRef CAS.
- J. Kettle, H. Waters, Z. Ding, M. Horie and G. C. Smith, Chemical changes in PCPDTBT:PCBM solar cells using XPS and TOF-SIMS and use of inverted device structure for improving lifetime performance, Sol. Energy Mater. Sol. Cells, 2015, 141, 139–147 CrossRef CAS.
- M. O. Reese, S. A. Gevorgyan, M. Jørgensen, E. Bundgaard, S. R. Kurtz, D. S. Ginley and F. C. Krebs, Consensus stability testing protocols for organic photovoltaic materials and devices, Sol. Energy Mater. Sol. Cells, 2011, 95(5), 1253–1267 CrossRef CAS.
- M. C. Scharber, D. Muhlbacher, M. Koppe, P. Denk, C. Waldauf, A. J. Heeger and C. J. Brabec, Design rules for donors in bulk-heterojunction solar cells-towards 10% energy-conversion efficiency, Adv. Mater., 2006, 18(6), 789 CrossRef CAS.
- J. C. W. Chien, G. E. Wnek, F. E. Karasz, J. M. Warakomski, L. C. Dickinson, A. J. Heeger and A. G. MacDiarmid, Electron Paramagnetic Resonance Saturation Characteristics of Pristine and Doped Polyacetylenes, Macromolecules, 1982, 15, 614 CrossRef CAS.
- F. Liu, W. Zhao, J. R. Tumbleston, C. Wang, Y. Gu, D. Wang and T. P. Russell, Understanding the morphology of PTB7:PCBM blends in organic photovoltaics, Adv. Energy Mater., 2014, 4(5) DOI:10.1002/aenm.201301377.
- C. J. Brabec, G. Zerza, G. Cerullo, S. D. Silvestri, S. Luzzati, J. C. Hummelen and S. Sariciftci, Tracing photoinduced electron transfer process in conjugated polymer/fullerene bulk heterojunctions in real time, Chem. Phys. Lett., 2001, 340, 232–236 CrossRef CAS.
- M. Manceau, S. Chambon, A. Rivaton, J.-L. Gardette, S. Guillerez and N. E. Lemaıtre, Effects of long-term UV-visible light irradiation in the absence of oxygen on P3HT and P3HT:PCBM blend, Sol. Energy Mater. Sol. Cells, 2010, 94, 1572–1577 CrossRef CAS.
- Q. Burlingame, X. Tong, J. Hankett, M. Slootsky, Z. Chen and S. R. Forrest, Photochemical origins of burn-in degradation in small molecular weight organic photovoltaic cells, Energy Environ. Sci., 2015, 8, 1005–1010 CAS.
Footnotes |
| † Electronic supplementary information (ESI) available. See DOI: 10.1039/c6ta00721j |
| ‡ These authors contributed equally to the writing of this paper. |
| This journal is © The Royal Society of Chemistry 2016 |