
 Open Access Article
 This Open Access Article is licensed under a
 Creative Commons Attribution 3.0 Unported Licence
An electrochemically functional layer of hydrogenase extract on an electrode of large and tunable specific surface area†
Stefanie
Schlicht
a,
Loïc
Assaud‡
a,
Moritz
Hansen
b,
Markus
Licklederer
a,
Mikhael
Bechelany
c,
Mirjam
Perner
b and
Julien
Bachmann
*a
aDepartment of Chemistry and Pharmacy, Friedrich-Alexander University Erlangen-Nürnberg, Egerlandstrasse 1, D-91058 Erlangen, Germany. E-mail: julien.bachmann@fau.de
bFaculty of Mathematics, Informatics and Biology, University of Hamburg, Biozentrum Klein Flottbek, Ohnhorststrasse 18, D-22609 Hamburg, Germany
cInstitut Européen des Membranes IEMM, ENSCM UM CNRS UMR5635, Place Eugène Bataillon, F-34095 Montpellier Cedex 5, France
First published on 30th March 2016
Abstract
Electrode supports are generated by electrospinning of polyacrylonitrile fibers and subsequent coating of a thin electrically conductive TiO2 layer by atomic layer deposition. The supports are then functionalized with a [NiFe]-hydrogenase-containing membrane fraction from Escherichia coli and are characterized structurally and electrochemically. The hydrogenase suspension generates a micron-thick organic film around the fiber mat, which exhibits electrocatalytic activity for hydrogen evolution. Furthermore, the electrode geometric surface area is varied systematically via the electrospinning procedure, which reduces the charge transfer resistance and increases the hydrogen evolution current density to >500 μA cm−2 at 0.3 V overpotential.
Introduction
Against the background of our society's need to capture and store renewable energy, molecular hydrogen provides a promising ‘energy currency’ which could be obtained via electrolytic or photoelectrolytic conversion of water and later release energy in fuel cells. A major drawback of currently available hydrogen-converting electrocatalysts is their dependence on noble metals. In addition to their exorbitant cost, noble metals are plagued by their intolerance to carbon monoxide (CO) and sulfides.1–3 Hydrogenase enzymes, the biological electrocatalysts for the reversible interconversion of H2 and 2H+ + 2e− under ambient conditions, are expressed in phylogenetically diverse microorganisms, and are based on three distinct types of inorganic reaction centers: heterodinuclear, homodinuclear and mononuclear (categorized as [NiFe], [FeFe] and [Fe], respectively).4–8 While some hydrogenases are more commonly associated with H2 uptake and others with H2 evolution, the direction of the reaction largely depends on the redox potential of the components able to interact with the enzyme.9 Thus, hydrogenases offer a large set of ‘natural’ alternatives to noble metals and present a correspondingly broad spectrum of reactivities. Firstly, the turnover rates vary widely and can be comparable to those reached with the best artificial catalysts.10–12 Furthermore, hydrogenases may or may not be tolerant to impurities such as CO.13–16 Finally, their stability to aerobic oxygen represents the major challenge,16,17 but a number of hydrogenases are quite tolerant to it.8,16,18–26 Unfortunately, an enzyme combining all of those favorable properties is yet to be discovered or engineered.Auspicious research has been dedicated to the incorporation of hydrogenase biocatalysts, mostly as a molecular monolayer covalently bound to a planar surface, and in some cases on surfaces of more complex geometry, into man-made electrochemical devices for the conversion of hydrogen.13,14,27–33 However, hydrogenase-based devices featuring high turnover and oxygen stability simultaneously have remained elusive to date. Furthermore, the selective covalent functionalization of a solid surface with purified hydrogenase enzyme is a challenging experimental task. This paper establishes an experimentally simple approach to electrode surfaces functionalized with a hydrogenase-containing organic layer, the specific surface area of which can be varied systematically. This feature allows for a corresponding increase of the hydrogenase turnover. We envision that robust but slow hydrogenases coated on a nanostructured surface could give rise to an overall turnover similar to that obtained with faster (but sensitive) enzymes on a planar surface.34,35 For a proof of concept, we focus on a simple system consisting of membrane-bound hydrogenase enzymes from Escherichia coli, extracted and applied to an electrode by dipping in a micellar suspension of the protein-containing membrane fraction. The electrode consists of TiO2-coated electrospun polyacrylonitrile (PAN) fiber mats. The electrically conductive oxide is deposited all around the fibers as a thin, continuous film by atomic layer deposition (ALD). The density of the fibrous mat and thereby the electrochemically active area (available for immobilization of the hydrogenase) are controlled by the duration of the electrospinning procedure. Indeed, electrospinning produces mats of fibers with tunable composition and geometry. The highly porous structures obtained by this technique not only have high specific surface area, they are also advantageous in terms of mass transport across the mats.36–38 We note that the present piece of work establishes a preparative method and demonstrates electrochemical function, but does not investigate the mechanism of electron transport and electrochemical turnover.
When grown anaerobically, E. coli synthesizes three membrane-associated [NiFe]-hydrogenases (Hyd).39,40 Hyd-1 and Hyd-2 are respiratory enzymes oriented towards the periplasm and couple hydrogen oxidation to the reduction of the quinone pool. Hyd-3 faces the cytoplasm and participates in the formate hydrogenlyase (FHL) complex. A fourth [NiFe]-hydrogenase has been identified in E. coli which encodes homologues of the FHL complex.40
Experimental section
The preparation is performed in three major steps. (1) A mat of PAN fibers is electrospun onto an Al foil substrate, then annealed to improve the polymer stability via crosslinking. (2) A conformal, 8 nm thick, electrically conducting layer of TiO2 is generated by ALD around the PAN fibers, followed by annealing. (3) The fibers are coated with the enzyme-containing membrane fraction by direct exposure to it.Hydrogenase extract preparation
Hydrogenases were extracted from E. coli DH5α (Invitrogen, Life Technologies). E. coli was cultivated in anaerobic N2-flushed (N2 5.0, Westfalen AG) LB medium overnight at 37 °C in serum bottles sealed with rubber stoppers under an atmosphere of H2/CO2 (80%![[thin space (1/6-em)]](https://www.rsc.org/images/entities/char_2009.gif) :20%) (Westfalen AG). Cell suspensions were centrifuged at 11000g (Sorvall RC 6 Plus, Thermo Fisher Scientific Inc.) and washed in anoxic 50 mM Tris buffer at pH 8. All further steps were carried out in an anaerobic chamber (Coy Laboratory Products) and 50 mM Tris at pH 8 supplemented with 5 mM 1,4-dithiothreitol (Tris–DTT) was used as the buffer. Hydrogenases were partially purified with a few variations as described elsewhere.41,42 In short, cells were broken by sonication (UP50H, Hielscher Ultrasonics GmbH) and soluble and membrane-associated enzymes were separated by ultracentrifugation at 40000g for 1 h (LM-8 ultracentrifuge, Beckman Coulter Inc., Brea, CA, USA). The pellet (i.e. membrane fraction) was resuspended in Tris–DTT buffer and subsequently saturated with 15%, 45% and 70% ammonium sulfate, each followed by pelleting proteins by ultracentrifugation at 40000g and resuspension of the pellet in Tris–DTT buffer. The protein concentration of all fractions was determined according to the Bradford method.43 They were 44 μg mL−1, 6 μg mL−1, 5.5 μg mL−1, 2.5 μg mL−1 and 33 μg mL−1 in the 15%, 45% and 70% ammonium sulfate fractions, the 70% ammonium sulfate supernatant, and the soluble fraction, respectively. Proteins of the different partially purified fractions were separated by SDS-PAGE demonstrating that proteins with molecular masses comparable to those of the hydrogenase small and large subunits of Hyd-1 (40 and 66 kDa), Hyd-2 (40 and 62.5 kDa), Hyd-3 (28 and 65 kDa) and Hyd-4 (28 and 64 kDa) were present in the distinct fractions (Fig. 1). The hydrogenase activities of the soluble proteins and membrane fractions saturated at 15%, 45% and 70% ammonium sulfate were determined by uptake activity measurements as described before.42 The 15% ammonium sulfate fraction exhibited significantly higher hydrogen uptake activity than all the other fractions (see Fig. S1 in ESI†) and was chosen for subsequent analyses. The partially purified membrane fractions used for the following experiments exhibited a H2 uptake activity of 0.25 (±0.026) μmol H2 min−1 mg−1, which is comparable to what has been measured before for partially purified hydrogenase enzymes from E. coli.41 This membrane fraction with hydrogenase activity was then stored anaerobically at −20 °C and used for coating the electrodes within two days after preparation. Preliminary tests showed that the hydrogenase enzyme activity remains stable for at least 7 days when kept at −20 °C (Fig. 2). An extract serving as a negative control was generated by boiling a membrane fraction extracted and purified in the same manner, in order to inactivate its enzymes.
:20%) (Westfalen AG). Cell suspensions were centrifuged at 11000g (Sorvall RC 6 Plus, Thermo Fisher Scientific Inc.) and washed in anoxic 50 mM Tris buffer at pH 8. All further steps were carried out in an anaerobic chamber (Coy Laboratory Products) and 50 mM Tris at pH 8 supplemented with 5 mM 1,4-dithiothreitol (Tris–DTT) was used as the buffer. Hydrogenases were partially purified with a few variations as described elsewhere.41,42 In short, cells were broken by sonication (UP50H, Hielscher Ultrasonics GmbH) and soluble and membrane-associated enzymes were separated by ultracentrifugation at 40000g for 1 h (LM-8 ultracentrifuge, Beckman Coulter Inc., Brea, CA, USA). The pellet (i.e. membrane fraction) was resuspended in Tris–DTT buffer and subsequently saturated with 15%, 45% and 70% ammonium sulfate, each followed by pelleting proteins by ultracentrifugation at 40000g and resuspension of the pellet in Tris–DTT buffer. The protein concentration of all fractions was determined according to the Bradford method.43 They were 44 μg mL−1, 6 μg mL−1, 5.5 μg mL−1, 2.5 μg mL−1 and 33 μg mL−1 in the 15%, 45% and 70% ammonium sulfate fractions, the 70% ammonium sulfate supernatant, and the soluble fraction, respectively. Proteins of the different partially purified fractions were separated by SDS-PAGE demonstrating that proteins with molecular masses comparable to those of the hydrogenase small and large subunits of Hyd-1 (40 and 66 kDa), Hyd-2 (40 and 62.5 kDa), Hyd-3 (28 and 65 kDa) and Hyd-4 (28 and 64 kDa) were present in the distinct fractions (Fig. 1). The hydrogenase activities of the soluble proteins and membrane fractions saturated at 15%, 45% and 70% ammonium sulfate were determined by uptake activity measurements as described before.42 The 15% ammonium sulfate fraction exhibited significantly higher hydrogen uptake activity than all the other fractions (see Fig. S1 in ESI†) and was chosen for subsequent analyses. The partially purified membrane fractions used for the following experiments exhibited a H2 uptake activity of 0.25 (±0.026) μmol H2 min−1 mg−1, which is comparable to what has been measured before for partially purified hydrogenase enzymes from E. coli.41 This membrane fraction with hydrogenase activity was then stored anaerobically at −20 °C and used for coating the electrodes within two days after preparation. Preliminary tests showed that the hydrogenase enzyme activity remains stable for at least 7 days when kept at −20 °C (Fig. 2). An extract serving as a negative control was generated by boiling a membrane fraction extracted and purified in the same manner, in order to inactivate its enzymes.
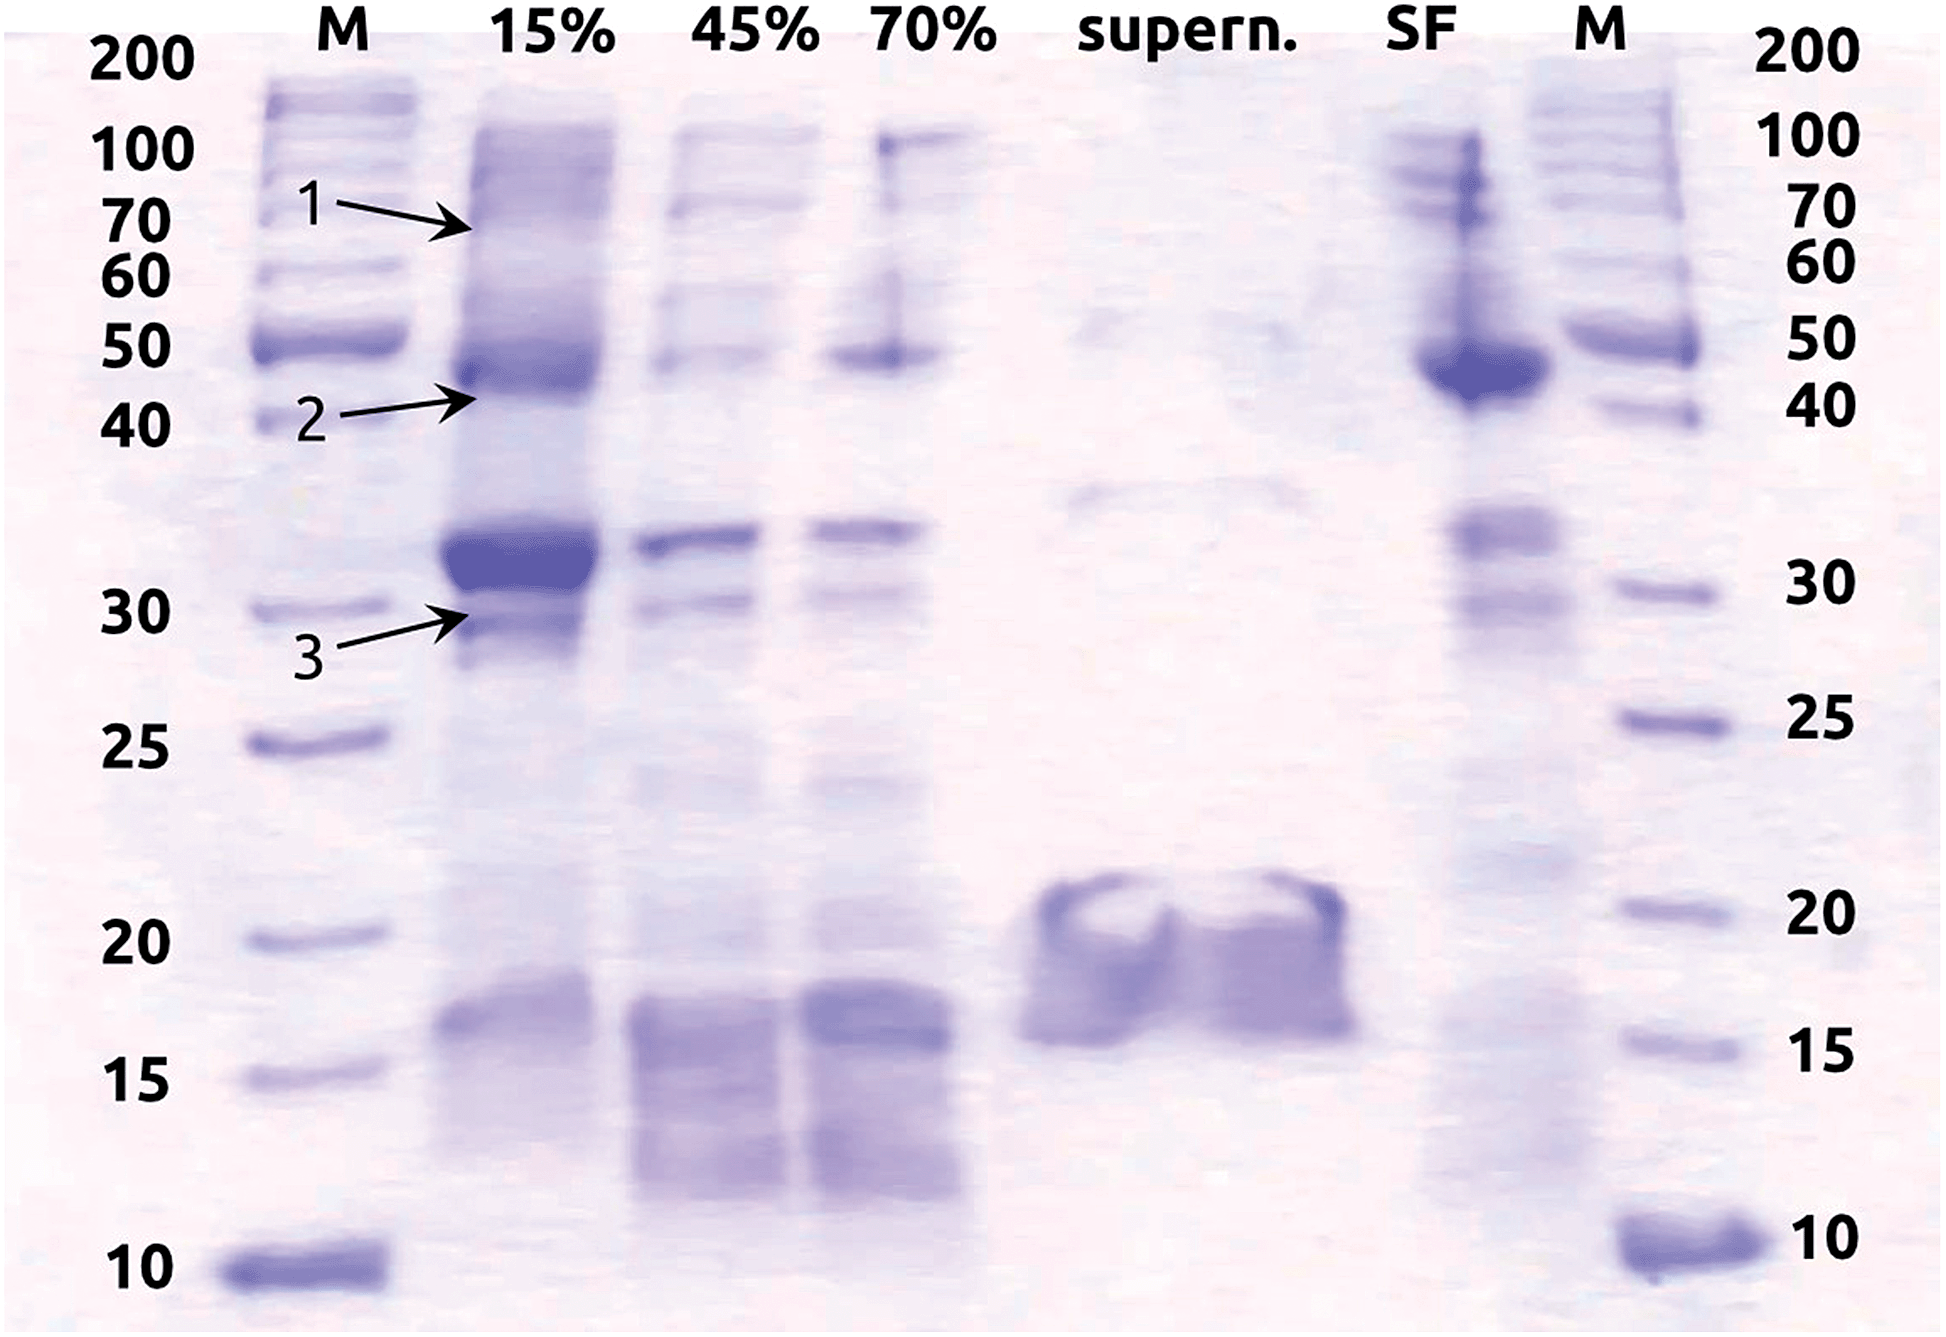 | ||
| Fig. 1 SDS PAGE of all protein fractions prepared from anaerobically grown E. coli cells. The stacking gel was 7% and separating gel 12% polyacrylamide. From each fraction, 20 μg of total protein extract were loaded on the gel, except for the 70% supernatant, where 16 μg were used. The 70% supernatant contains 70% of ammonium sulfate, which causes the untypical running behavior of this fraction. Marker (M) protein sizes are given in kDa. Abbreviations: 15%, 45% and 70%, resuspended pellet after ammonium sulfate precipitation with the mentioned percentage of ammonium sulfate; SF, soluble fraction including all soluble proteins. Arrows indicate the expected sizes of the hydrogenase subunits: (1) large subunit of Hyd-1, Hyd-2, Hyd-3 and Hyd-4; (2) small subunit of Hyd-1 and Hyd-2; (3) small subunit of Hyd-3 and Hyd-4. | ||
 | ||
| Fig. 2 Time evolution of the H2 uptake activity a of E. coli enzyme extracts stored under different conditions. The enzyme activity was determined immediately after preparation and after 1, 2, 7 and 28 days. The enzymes were kept anaerobically at 4 °C, at −20 °C, and in 50% glycerol at −20 °C, respectively. Activity after 28 days at 4 °C was not measured. | ||
Electrospinning of PAN nanofibers
PAN was dissolved in dimethylformamide to prepare a solution (10 wt% PAN). The electrospinnable solution was stirred for 1 h and then heated in an oil bath at 80 °C for 10 min. Electrospinning was then performed in a home-made setup based on a HPx 600605 generator (Physical Instruments) and a KDS 100 syringe pump.38,44 The polymer solution was electrospun in ambient air atmosphere under an applied voltage of 25 kV with a flow rate of 3 mL h−1, using a 0.7 mm diameter syringe needle connected to the positive output of the generator. A rotating collector located at 25 cm from the syringe tip was connected to the negative output of the generator. The collector was covered with an aluminum foil serving as the support to collect the electrospun fibers. In order to investigate the influence of active surface on electrode performance, three samples with electrospinning durations of 1 h, 3 h and 6 h were prepared. The electrospun PAN nanofibers were then annealed to 250 °C for 2 h in an aerobic environment (heating rate 2 °C min−1) using a muffle furnace to provide them with improved stability.Surface preparation
A thin layer of TiO2 (400 cycles, 8 nm) was deposited over the PAN nanofibers in order to confer them with electrical conductivity and generate a chemically well-defined surface for hydrogenase adhesion. The depositions were performed in a commercial GEMStar-6 ALD reactor from Arradiance. Titanium isopropoxide ((iPrO)4Ti, from Strem) and H2O were used as precursors. The precursor pulse durations were set to 2 s and 0.2 s for (iPrO)4Ti and H2O, respectively, whereas the exposure and pumping durations were set to 15 s and 30 s. The (iPrO)4Ti precursor bottle was maintained at 70 °C and the deposit carried out at 120 °C. The thickness of the resulting TiO2 layer was measured by spectroscopic ellipsometry on a planar silicon wafer serving as the reference using an EL X-02 P Spec ellipsometer from DRE Dr Riss Ellipsometerbau GmbH. The fits were performed using the database of optical material properties provided with the instrument, without any model. The samples coated with TiO2 were then annealed in air at 400 °C for 1 h in a P 330 muffle furnace from Nabertherm GmbH. For electrochemical characterization, samples of well-defined size were generated by gluing a polyimide (Kapton®) mask featuring a laser-cut circular opening of 3 mm in diameter. For treatment with the hydrogenase fraction, the samples were taken into inert atmosphere and first soaked in electrolyte for 3 minutes. They were then removed from the electrolyte and, in their moist state, a 10 μL droplet of hydrogenase-containing membrane fraction was deposited onto the mask window (of 0.071 cm2 macroscopic area) to allow for the enzymes to adhere to the fibers. After two minutes, the samples were abundantly rinsed, and subsequently characterized.Characterization
The morphology of the nanofibers was investigated by scanning electron microscopy using a Jeol JSM-6400 microscope equipped with an X-ray detector for elemental microanalysis. X-ray diffraction and reflectivity were performed with a Bruker D8 Advance equipped with a Cu Kα source and LynxEye XE-T detector. The electrochemical characterizations were performed in a phosphate buffer electrolyte (10 mM NaH2PO4 and 10 mM tris(hydroxymethyl)aminomethane in water at pH 8) that reproduces the conditions in which hydrogen uptake activity was determined in homogeneous conditions. The electrolyte was degassed prior to electrochemical experiments by bubbling N2 for 30 min. Electrochemistry was then performed in a home-made glovebox continuously flushed by N2. Cyclic voltammetry (CV) as well as electrochemical impedance spectroscopy were performed with a standard three-electrode setup using a Gamry Interface 1000 potentiostat. Ag/AgCl/KCl 3 M (E° = +0.21 V vs. NHE) was used as the reference, whereas a Pt mesh was used as a counter-electrode. The open-circuit potential of the working electrode was always in the vicinity of −0.6 V vs. Ag/AgCl. CV was performed at scan rates from 20 to 200 mV s−1 with similar results, and a scan rate of 50 mV s−1 was used as standard. The voltammograms reported in the paper are the 20th cycle recorded for each sample. We have observed that after 20 cycles at the latest, the CV response was stable. With this precaution, cyclic voltammograms were reproducible within 5%. Overpotentials η for the hydrogen evolution reaction were calculated at pH 8 from the experimental potentials E as η = E + 0.67 V (including the correction for the reference electrode). Electrochemical impedance spectroscopy was then performed under the same experimental conditions from 100 MHz to 2 Hz.Results and discussion
Preparative principle
The samples to be tested electrochemically are generated by the following steps: (1) a mat of PAN fibers is electrospun onto an Al substrate, then annealed; (2) a conformal, electrically conducting layer of TiO2 is generated by ALD around the PAN fibers, then annealed; (3) the fibers are coated with the enzyme-containing membrane fraction. This strategy has the advantage that each component (fibers, ALD coating, and enzyme extract) can be easily replaced with another independently of the others. Step (1) defines the sample's specific surface area, regardless of the chemical identity of the surface. Step (2) then confers the inert, electrically insulating sample with electrical conductivity, and could be performed with a number of metals and semiconductors. Finally, (3) generates the functional layer, which could consist of various molecular catalysts or biological particles, either as self-assembled monolayers or in more loosely bound aggregates. The method is applied to a hydrogenase-containing membrane fraction from E. coli with high catalytic activity. Electrophoretic analysis of the membrane fraction (Fig. 1) evidences the presence of polypeptide chains of the expected lengths. Furthermore, Fig. 2 demonstrates that the enzymes maintain activity for up to a week when stored appropriately, whereas our experiments were always performed within 3 days after extraction.Fiber mat functionalization
The thin film coating technique used to deposit the electrically conducting layer must fulfill quite stringent requirements: it must generate an uninterrupted film of homogeneous thickness without shadow effects despite the complex geometry, and it must take place in conditions sufficiently mild that the organic support remains stable. ALD is ideally suited to those requirements, since it relies on complementary, self-limiting surface reactions of molecular precursors with the surface at low temperature.45,46 Because the method circumvents the transport control inherent to most thin-film techniques from the gas phase, it is particularly well capable of conformally coating non-planar or porous substrates.47 We use a well-established hydrolysis ALD reaction to deposit TiO2 as an amorphous layer,48,49 which crystallizes to a conductive anatase crystal phase upon annealing.50Fig. 3a–c shows scanning electron micrographs of the three types of TiO2-coated fiber mats used as electrode substrates. The fibers feature a quite homogeneous diameter of approximately 500 nm, and their density increases systematically with the duration of electrospinning from 1 h to 6 h, causing a concomitant increase in the electrochemically active surface area. Energy-dispersive X-ray spectroscopic analysis (Fig. 3d) attests the exclusive presence of the elements C, O, N and Ti expected after ALD coating. After treatment with the hydrogenase-containing membrane fraction (Fig. 3e and f), the fibers are enshrouded in an organic layer of micrometer thickness. Note that this layer does not consist exclusively of active enzyme, but represents the membrane fraction extract, including surfactants, in which hydrogenase is embedded. Importantly, however, the fiber mat is not clogged and the porosity required to ensure access of the electrolyte to each point of the electrode surface is maintained.
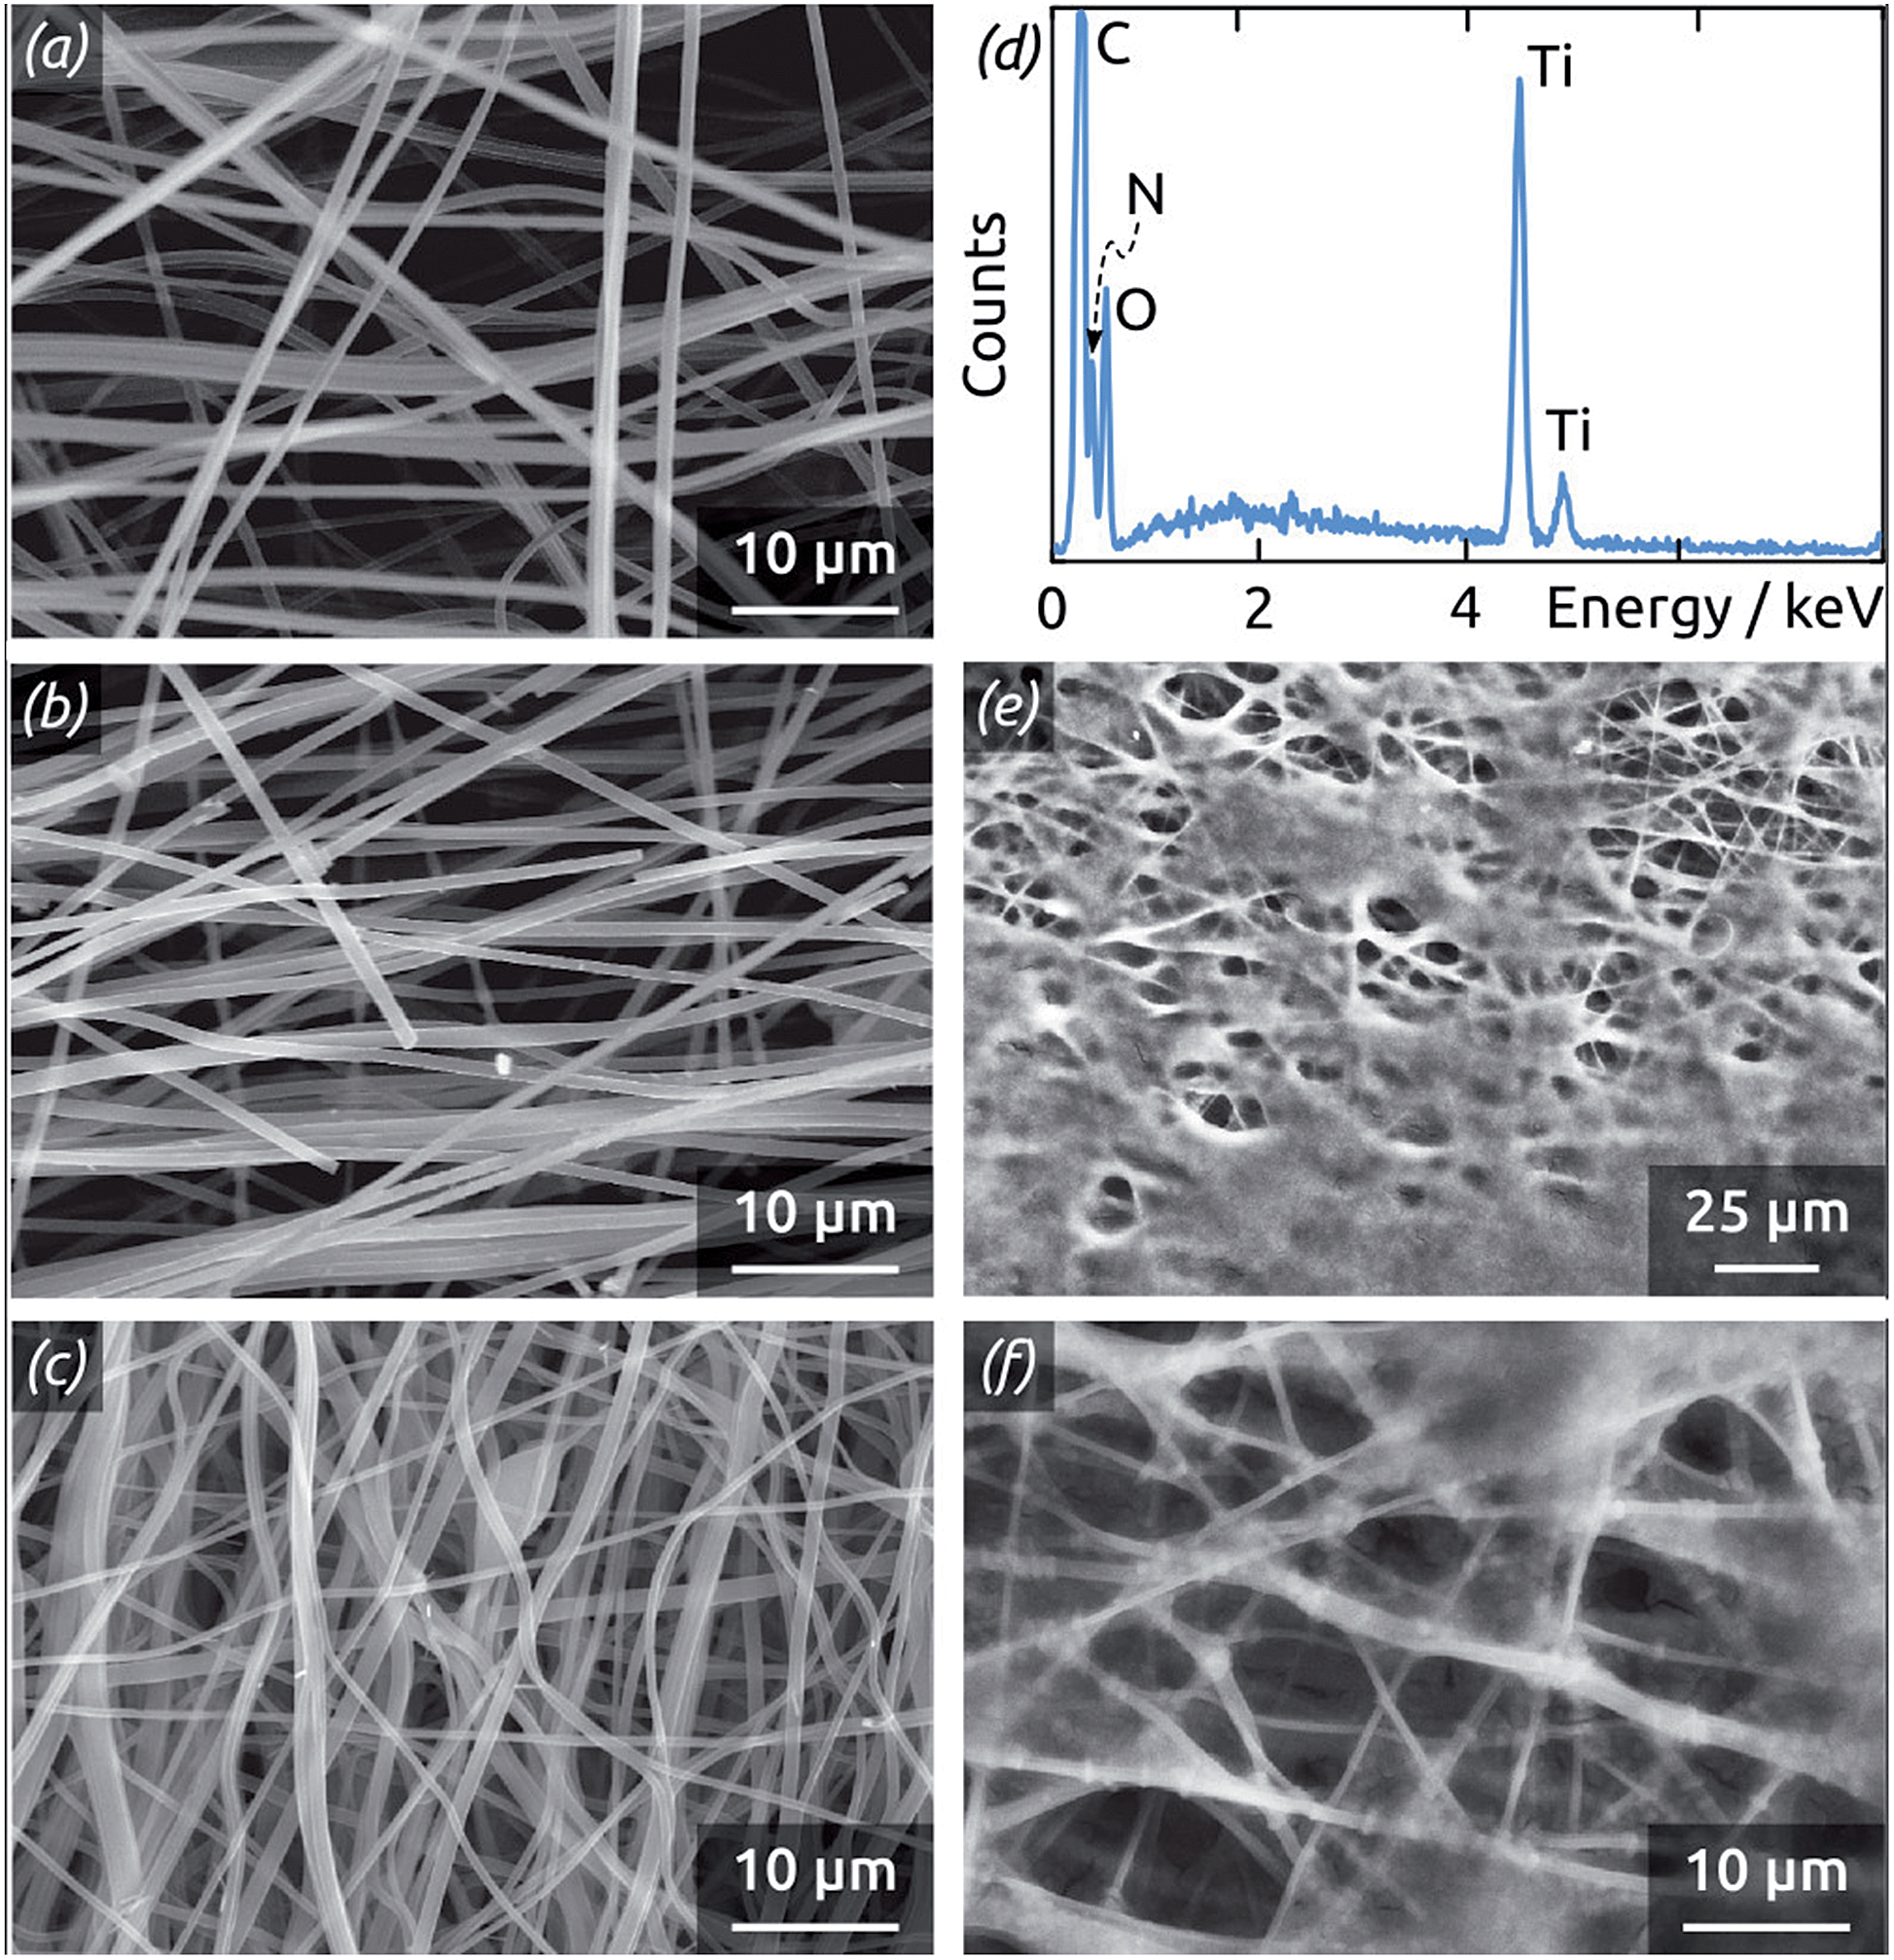 | ||
| Fig. 3 (a–c) Scanning electron micrographs of PAN nanofibers electrospun during 1 h, 3 h and 6 h, respectively, coated with 8 nm TiO2 by atomic layer deposition. (d) EDX spectrum of PAN fibers coated by TiO2. (e and f) Scanning electron micrographs of PAN fibers (electrospun during 3 h) treated with the hydrogenase fraction, presented at two different magnifications. | ||
The titania coating is characterized by X-ray diffraction (XRD) and X-ray reflectivity (XRR) (Fig. 4). In the XRD pattern of TiO2-coated fiber mats, the peaks characteristic of the anatase crystal phase of TiO2 only appear (on top of the scattering due to the amorphous PAN) after annealing (Fig. 4a). The XRR data collected on the film deposited by TiO2 ALD (1000 cycles) on a planar piece of silicon wafer are compatible with a coating of 20 nm thickness and up to 1 nm roughness (Fig. 4b). The ALD growth rate of 0.2 Å per cycle yields a coating of 8 nm on the PAN fibers obtained over 400 ALD cycles.
 | ||
| Fig. 4 (a) Powder X-ray diffraction data (black) collected on an annealed, TiO2-coated PAN fiber mat (electrospun during 1 h), compared to the anatase TiO2 pattern (red lines). (b) X-ray reflection data (black) obtained with an annealed, TiO2-coated silicon wafer (1000 ALD cycles). A fit to the data yields a thickness of 20.2 (±0.5) nm and roughness of ≤1 nm and thereby confirms the ALD growth rate of 0.2 Å per cycle also determined by spectroscopic ellipsometry. | ||
Electrochemical properties
The electrochemical activity of the fiber mats is characterized by cyclic voltammetry (CV). Various CV scan rates between 20 mV s−1 and 200 mV s−1 have been found to yield very similar results, and we chose 50 mV s−1 as our standard. All electrochemical data shown are taken under N2 atmosphere, so that the hydrogen evolution reaction can be investigated exclusively. Note that this contrasts with the homogeneous activity assays performed preliminarily (Fig. 2), which are based on the reverse reaction, H2 uptake, as performed traditionally for biochemical characterization. We always report the twentieth voltammetric cycle recorded, as we have found that our hydrogenase-treated samples require some electrochemical pre-conditioning (typically 10 to 20 CV cycles) before reaching a stable state. We hypothesize that this may be related to a necessary hydration of the organic layer. Fig. 5a demonstrates the electrocatalytic function of the hydrogenase coating: on an enzyme-coated sample, H2 evolution (quantified as a negative current) sets in at slightly less negative overpotential η than on the reference sample consisting of an identical fibrous mat without enzyme coating. At −1.0 V vs. Ag/AgCl (η = −0.33 V), the current density generated by the biocatalytically active electrode is a modest double of that obtained at the TiO2 surface. | ||
| Fig. 5 (a) Cyclic voltammetry (CV) of fiber-based electrodes (electrospun for 1 h) with active hydrogenase-containing coating (solid line), with inactivated coating (dotted line), and without coating (dashed line) recorded at 50 mV s−1 in buffer electrolyte (pH 8). Other scan rates yielded similar results. (b) CV of electrodes based on three distinct fiber amounts treated with active extract: electrospun for 1 h (orange), 3 h (green), and 6 h (blue). The data were taken at 50 mV s−1 in buffer electrolyte (pH 8). The overpotential η is calculated from the experimental potential E measured vs. Ag/AgCl as η = E + 0.67 V. The CV measurements were initiated at E = −0.40 V and 19 cycles were performed before the cycle displayed was recorded. A comparison of the first 20 cycles measured for a sample with hydrogenase treatment and without it is provided as Fig. S2 in the ESI.† The voltammograms recorded without hydrogenase treatment are presented in Fig. S3.† | ||
The CV trace of the enzyme-coated sample also displays a slightly hysteretic behavior, indicative of capacitive charging currents larger than in the reference sample. In a first approximation, this could be understood as being due to the organic layer as a pseudo-dielectric. The organic layer, however, does support the transport of protons, electrons and molecular hydrogen given the electrochemical current measured. It also does not clog the fiber mat, given the capacitive behavior observed (which would not be present in a clogged mat, the geometric area, and thereby capacity, of which would be reduced). The presence of the organic layer, however, has a deleterious effect on the galvanic reaction in the absence of the catalytic effect by the hydrogenase. This is demonstrated by an additional control experiment in which the enzyme content in the extract was inactivated thermally. Indeed, in Fig. 5a the CV trace of the sample prepared with inactivated extract features a lower current than the bare sample, whereas switching to the active hydrogenase more than triples the current at the most negative potential value.
Fig. 5b demonstrates how the electrospinning procedure can be used to control the specific surface area of the electrode, and thereby the overall electrocatalytic turnover. Indeed, increasing the electrospinning duration results in an almost linear increase in cathodic current density. The CV curves recorded on samples treated with active extract cross the zero current value near zero overpotential (within about ±50 mV of it). We refrain from overinterpreting this value, given that in this region the concentration of dissolved H2 (or its partial pressure, not controlled in our experimental conditions) affects the curves significantly. Instead, we take turnover (and charge transfer resistance) at moderate overpotentials as a more robust quantification of catalytic activity. At E = −1.00 V vs. Ag/AgCl (η = −0.33 V), samples obtained upon 1 h, 3 h and 6 h of electrospinning give rise to current densities of 0.06 mA cm−2, 0.25 mA cm−2 and 0.52 mA cm−2, respectively. Quantitative values of the corresponding microscopic surface areas of the nanofibrous TiO2/PAN support are obtained from the specific area value of 10 m2 g−1 previously reported51 and the mass of fibers determined: roughness ratios of approximately 4, 13, and 27 are obtained for samples electrospun for 1 h, 3 h and 6 h. As expected, the trend observed with the three active samples is also obtained with three bare samples and with three samples featuring the inactivated coating, albeit on distinct absolute scales (Fig. 6a).
 | ||
| Fig. 6 (a) Cyclic voltammetry of the reference samples (untreated, dashed curves; treated with inactivated extract, dotted curves) electrospun for 1 h (orange), 3 h (green) and 6 h (blue) recorded under the same conditions as in Fig. 5b and presented on the same scale. (b) Electrochemical impedance spectra of two exemplary reference samples (untreated, filled circles; treated with inactivated extract, empty circles) recorded at E = −0.85 V vs. Ag/AgCl under the same conditions as in Fig. 7. | ||
Further insight into the processes taking place at and near the interfaces is provided by electrochemical impedance spectroscopy (EIS).52 Data collected at −0.85 V (vs. Ag/AgCl, or η = −0.18 V) from 100 kHz to 2 Hz are presented as Nyquist plots in Fig. 6b and 7. The EIS comparison between two distinct control samples, one with inactivated enzyme extract coating and the other uncoated, reveals a marked difference. Quantitatively, the overall real resistance of the former sample is in line with the lower currents caused by the presence of the inactive organic layer. Qualitatively, this organic layer seems to add a second RC element to the equivalent circuit. Let us now investigate the three naked samples and their three active hydrogenase-coated counterparts in more detail.
 | ||
| Fig. 7 Electrochemical impedance spectroscopy (EIS) of fiber-based electrodes performed at E = −0.85 V vs. Ag/AgCl in buffer electrolyte (pH 8). The samples tested are generated by electrospinning for 1 h (orange), 3 h (green) and 6 h (blue), without hydrogenase extract treatment (empty symbols, dotted lines) and with it (filled symbols, solid lines). The untreated electrodes are compared with each other in (a), the hydrogenase-treated ones in (b), and the direct comparison of the two 6 h samples is magnified in (c). The equivalent circuit model used to perform the fits is defined in (d); the fit results are summarized in Table 1. | ||
The uncoated samples (Fig. 7a) are best described as consisting of a single depressed semicircle. This shape is indicative of a single, slow charge transfer event type at a rough solid surface, a fair description of the system considered. The diameter of the semicircles measured for samples with three different amounts of fibers (their charge transfer resistance) decreases as the fiber mat thickness increases. This trend is expected based on surface area considerations, as electrical resistance is inversely proportional to the conductor's cross-sectional area. It also proves that our enzyme fraction coating penetrates and functionalizes the full depth of the fiber mat (instead of it merely staying on its outer surface). The samples coated with a hydrogenase-containing film (Fig. 7b) feature two (depressed) semicircles (as do those treated with the inactivated enzymes), indicating that an additional phenomenon is relevant to electrochemical turnover. This is most likely the transport of protons inside the hydrogenase-containing organic layer already mentioned above. The direct comparison of two samples with the same geometry and differing only in the presence or absence of hydrogenase-containing organic layer reveals a lower charge transfer resistance in the former case, which corresponds to the enzymes' catalytic function (Fig. 7c).
Quantitative values are extracted from the EIS data by fitting to an equivalent circuit model shown in Fig. 7d. The same model is applicable to all samples, and can be simplified in individual cases. It features a series of two consecutive Randles-type cells and an additional series resistance Ru. The first cell (Rct/Y in Fig. 7d) physically represents the solid/liquid interface with the charge transfer resistance Rct in parallel with a constant-phase element of impedance Y. We associate the second cell (R′/C′/W′ in Fig. 7d) with transport inside the organic layer: a resistance R′ and capacity C′ are complemented with a Warburg element of impedance W′. Indeed, this latter cell contributes to the overall fit quality only marginally in the reference samples deprived of enzyme, but predominates in the high-frequency region of the hydrogenase-coated samples. Conversely, the surface of the biocatalyst-functionalized samples appears less rough experimentally, as the ideality factor α of their constant-phase impedance reverts to unity (the constant-phase element behaves as a pure capacitor). All values are presented in Table 1. The parameter that carries the most direct insight in terms of electrocatalysis is the charge transfer resistance Rct. Importantly, Rct is lower for each enzyme-coated sample than for the corresponding bare TiO2 reference sample. It also decreases systematically as the surface area of fibers increases from the samples generated with 1 h of electrospinning to 3 h and 6 h.
| Catalyst | No coating | With active extract coating | ||||
|---|---|---|---|---|---|---|
| Electrospinning | 1 h | 3 h | 6 h | 1 h | 3 h | 6 h |
| R u/Ω | 0.001 | 1500 | 1700 | 253 | 259 | 82 |
| R′/kΩ | 0.97 | 1.0 | 0.64 | 0.43 | 0.49 | 0.15 |
| C′/nF | 0.15 | 1.9 | 4.1 | 1.5 | 1.7 | 1.7 |
| W′/10−6 S s1/2 | 28 | 6.8 | 15 | 5.5 | 4.9 | 18.5 |
| R ct /kΩ | 122 | 41 | 11 | 97 | 33 | 9 |
| α | 0.7 | 0.9 | 1 | 1 | 1 | 1 |
| Y/10−9 S sα | 0.0013 | 168 | 617 | 419 | 315 | 742 |
Another piece of information gathered from the data of Table 1 concerns the resistance to electron transfer between PAN and TiO2 and from the conducting fiber material across the organic layer to the catalytically active sites, contained in the value R′. We observe that independently of the exact electrode parameters, R′ is always smaller than the value Rct, representing catalysis, by roughly two orders of magnitude. In other words, the system is still limited by catalytic turnover and not by transport. However, if significantly better hydrogenases were to be used in the future, then the various transport and contact resistances in the system would need to be reduced, as well.
Our results are put into a broader perspective in Fig. 8, which presents the performance of our best sample as a Tafel plot featuring the best hydrogen evolution electrocatalyst metals from the literature.53–60 We observe that near η = 0 our system becomes comparable to platinum, in line with the fact that hydrogenases operate at near-zero overpotential. Our system is also significantly more efficient than nickel below 200 mV overpotential. However, it loses its competitiveness at large overpotentials, as evidenced by the large Tafel slope. This is associated with the mass (and charge) transport limitation quantified by our EIS measurements.
 | ||
| Fig. 8 Comparison of the hydrogen evolution performance recorded for the best electrode presented in this paper (blue curve of Fig. 5b, presented as the thick gray, dotted line here and labeled with an asterisk) and for the best known electrode materials in acidic (red lines) and basic conditions (blue lines). Dotted lines represent non-planar surfaces. The figure is adapted from the review by Cook et al.,53 and reports data published by Conway, Shamsul Huq, and Cheong (Ni and RANEY® Ni),54–56 Bélanger (Co),57 Pentland (Mo),58 and by Ammar and Schuldiner (Pt),59,60 and their co-authors. | ||
Conclusions
Taken together, our results establish TiO2-coated electrospun PAN fibers as an experimentally simply accessible platform suited to generating electrode surfaces of large specific surface area and capable of functionalization with biocatalysts. With a membrane-bound E. coli hydrogenase extract, the current density obtained for hydrogen evolution increases in direct proportion to the amount of fiber, controlled by the electrospinning duration, over the range investigated in this study. The charge transfer resistance decreases correspondingly. The upper limit of current density achievable by increasing the fiber mat thickness depends on the applied potential but is certainly finite due to transport limitations. Nevertheless, this represents a system of rather facile experimental access and with an interesting degree of tunability. Most significantly, it enables the experimentalist to vary the electrochemically active surface area in a systematic manner, and thereby, to increase the electrochemical turnover in biofuel cell electrode assemblies. In our system, current densities in excess of 500 μA cm−2 were achieved with stationary fiber mat electrodes at a moderate overpotential of η ≈ −0.3 V, whereas the state of the art is <10 μA cm−2 with planar rotating disk electrodes spinning at >2500 rpm,27 and about 150 μA cm−2 at η ≈ −0.2 V with stationary colloidal TiO2 films.30At a more fundamental level, the capability of adjusting the electrochemically active surface area accurately allows one to unravel interface charge transfer and charge transport in the electrolyte. In the near future, our work will be pursued along three main directions: (1) improving the coating procedure and characterizing the organic film further in terms of its chemical composition and electrochemical behavior; (2) characterizing the oxygen tolerance of various hydrogenases that can be applied to our system; (3) addressing the reverse reaction, hydrogen oxidation, for fuel cell applications. Another question that remains open for investigation concerns the mechanism of electron transfer between the solid electrode surface and the hydrogenase enzymes.
Acknowledgements
We acknowledge S. Funk and C. Henkel for performing preliminary electrochemical experiments and Dr A. Abou Chaaya for preliminary electrospinning experiments. This work was funded by the German Academic Exchange Service via the project “ENHYC” (DAAD 57038849) and by the DFG Cluster of Excellence “Engineering of Advanced Materials”. We thank Prof. T. Cook for providing a vector graphic used as the basis of Fig. 8, and Prof. Y. Surendranath for providing helpful comments on our manuscript.Notes and references
- Z. M. Liu, L. L. Ma, J. Zhang, K. Hongsirikarn and J. G. Goodwin, Catal. Rev.: Sci. Eng., 2013, 55, 255–288 CAS.
- U. A. Paulus, U. Endruschat, G. J. Feldmeyer, T. J. Schmidt, H. Bönnemann and R. J. Behm, J. Catal., 2000, 195, 383–393 CrossRef CAS.
- G. García and M. T. M. Koper, ChemPhysChem, 2011, 12, 2064–2072 CrossRef PubMed.
- J. W. Peters, G. J. Schut, E. S. Boyd, D. W. Mulder, E. M. Shepard, J. B. Broderick, P. W. King and M. W. W. Adam, Biochim. Biophys. Acta, 2015, 1853, 1350–1369 CrossRef CAS PubMed.
- P. M. Vignais and B. Billoud, Chem. Rev., 2007, 107, 4206–4272 CrossRef CAS PubMed.
- J. C. Fontecilla-Camps, A. Volbeda, C. Cavazza and Y. Nicolet, Chem. Rev., 2007, 107, 4273–4303 CrossRef CAS PubMed.
- M. Frey, ChemBioChem, 2002, 3, 153–160 CrossRef CAS PubMed.
- W. Lubitz, H. Ogata, O. Rüdiger and E. Reijerse, Chem. Rev., 2014, 114, 4081–4148 CrossRef CAS PubMed.
- P. M. Vignais and A. Colbeau, Curr. Issues Mol. Biol., 2004, 6, 159–188 CAS.
- A. Jones, E. Sillery, S. Albracht and F. Armstrong, Chem. Commun., 2002, 866–867 RSC.
- M. Hambourger, M. Gervaldo, D. Svedruzic, P. King, D. Gust, M. Ghirardi, A. L. Moore and T. A. Moore, J. Am. Chem. Soc., 2008, 130, 2015–2022 CrossRef CAS PubMed.
- D. Das and T. N. Veziroglu, Int. J. Hydrogen Energy, 2001, 26, 13–28 CrossRef CAS.
- A. A. Karyakin, S. V. Morozov, E. E. Karyakina, N. A. Zorin, V. V. Perelygin and S. Cosnier, Biochem. Soc. Trans., 2005, 33, 73–75 CrossRef CAS PubMed.
- K. A. Vincent, J. A. Cracknell, O. Lenz, I. Zebger, B. Friedrich and F. A. Armstrong, Proc. Natl. Acad. Sci. U. S. A., 2005, 102, 16951–16954 CrossRef CAS PubMed.
- H. Ogata, Y. Mizoguchi, N. Mizuno, K. Miki, S.-i. Adachi, N. Yasuoka, T. Yagi, O. Yamauchi, S. Hirota and Y. Higuchi, J. Am. Chem. Soc., 2002, 124, 11628–11635 CrossRef CAS PubMed.
- H. S. Shafaat, O. Rüdiger, H. Ogata and W. Lubitz, Biochim. Biophys. Acta, 2013, 1827, 986–1002 CrossRef CAS PubMed.
- K. A. Vincent, A. Parkin, O. Lenz, S. Albracht, J. C. Fontecilla-Camps, R. Cammack, B. Friedrich and F. A. Armstrong, J. Am. Chem. Soc., 2005, 127, 18179–18189 CrossRef CAS PubMed.
- M. Guiral, P. Tron, V. Belle, C. Aubert, C. Leger, B. Guigliarelli and M.-T. Giudici-Orticoni, Int. J. Hydrogen Energy, 2006, 31, 1424–1431 CrossRef CAS.
- T. Buhrke, O. Lenz, N. Krauss and B. Friedrich, J. Biol. Chem., 2005, 280, 23791–23796 CrossRef CAS PubMed.
- W. A. Vargas, P. D. Weyman, Y. Tong, H. O. Smith and Q. Xu, Appl. Environ. Microbiol., 2011, 77, 1990–1998 CrossRef PubMed.
- H. Nishihara, Y. Miyashita, K. Aoyama, T. Kodama, Y. Igarashi and Y. Takamura, Biochem. Biophys. Res. Commun., 1997, 232, 766–770 CrossRef CAS PubMed.
- J. A. Cracknell, K. A. Vincent, M. Ludwig, O. Lenz, B. Friedrich and F. A. Armstrong, J. Am. Chem. Soc., 2008, 130, 424–425 CrossRef CAS PubMed.
- G.-F. Huang, X.-B. Wu, L.-P. Bai, K. Liu, L.-J. Jiang, M.-N. Long and Q.-X. Chen, FEBS Lett., 2015, 589, 910–918 CrossRef CAS PubMed.
- L. Xu and F. A. Armstrong, RSC Adv., 2015, 5, 3649–3656 RSC.
- K. Karstens, S. Wahlefeld, M. Horch, M. Grunzel, L. Lauterbach, F. Lendzian, I. Zebger and O. Lenz, Biochem., 2015, 54, 389–403 CrossRef CAS PubMed.
- J. Fritsch, O. Lenz and B. Friedrich, Nat. Rev. Microbiol., 2013, 11, 106–114 CrossRef CAS PubMed.
- F. A. Armstrong, N. A. Belsey, J. A. Cracknell, G. Goldet, A. Parkin, E. Reisner, K. A. Vincent and A. F. Wait, Chem. Soc. Rev., 2009, 38, 36–51 RSC.
- A. F. Wait, A. Parkin, G. M. Morley, L. dos Santos and F. A. Armstrong, J. Phys. Chem., 2010, 114, 12003–12009 CAS.
- J. Tye, M. Hall and M. Darensbourg, Proc. Natl. Acad. Sci. U. S. A., 2005, 102, 16911–16912 CrossRef CAS PubMed.
- E. Reisner, J. Fontecilla-Camps and F. Armstrong, Chem. Commun., 2009, 550–552 RSC.
- E. Xu, L. Zhiyin, H. Liu, L. Long, L. Li and X. Liu, RSC Adv., 2012, 2, 10171–10174 RSC.
- A. de Poulpiquet, D. Ranava, K. Monsalve, M.-T. Giudici-Orticoni and E. Lojou, ChemElectroChem, 2014, 1, 1724–1750 CrossRef CAS.
- F. Oteri, A. Ciaccafava, A. de Poulpiquet, M. Baaden, E. Lojou and S. Sacquin-Mora, Phys. Chem. Chem. Phys., 2014, 16, 11318–11322 RSC.
- J. Gemmer, Y. Hinrichsen, A. Abel and J. Bachmann, J. Catal., 2012, 290, 220–224 CrossRef CAS.
- V. Roscher, M. Licklederer, J. Schumacher, G. Reyes Rios, B. Hoffmann, S. Christiansen and J. Bachmann, Dalton Trans., 2014, 43, 4345–4350 RSC.
- N. Bhardwaj and S. C. Kundu, Biotechnol. Adv., 2010, 28, 325–347 CrossRef CAS PubMed.
- Z. Dong, S. J. Kennedy and Y. Wu, J. Power Sources, 2011, 196, 4886–4904 CrossRef CAS.
- D. Selloum, A. Abou Chaaya, M. Bechelany, V. Rouessac, P. Miele and S. Tingry, J. Mater. Chem. A, 2014, 2, 2794–2800 CAS.
- A. Böck, P. W. King, M. Blokesch and M. C. Posewitz, Adv. Microb. Physiol., 2006, 51, 1–71 CrossRef.
- L. Forzi and R. G. Sawers, BioMetals, 2007, 20, 565–578 CrossRef CAS PubMed.
- M. W. Adams and D. O. Hall, Biochem. J., 1979, 183, 11–22 CrossRef CAS PubMed.
- M. Hansen and M. Perner, ISME J., 2015, 9, 696–707 CrossRef CAS PubMed.
- M. M. Bradford, Anal. Biochem., 1976, 72, 248–254 CrossRef CAS PubMed.
- A. Abou Chaaya, M. Bechelany, S. Balme and P. Miele, J. Mater. Chem. A, 2014, 2, 20650–20658 Search PubMed.
- S. M. George, Chem. Rev., 2010, 110, 111–131 CrossRef CAS PubMed.
- R. L. Puurunen, J. Appl. Phys., 2005, 97, 121301 CrossRef.
- J. Bachmann, Beilstein J. Nanotechnol., 2014, 5, 245–248 CrossRef PubMed.
- J. Aarik, A. Aidla, T. Uustare, M. Ritala and M. Leskelä, Appl. Surf. Sci., 2000, 161, 385–395 CrossRef CAS.
- A. Rahtu and M. Ritala, Chem. Vap. Deposition, 2002, 8, 21–28 CrossRef CAS.
- M. Kim, C. Bae, H. Kim, H. Yoo, J. M. Montero Moreno, H. S. Jung, J. Bachmann, K. Nielsch and H. Shin, J. Mater. Chem. A, 2013, 1, 14080–14088 CAS.
- M. Bechelany, M. Drobek, C. Vallicari, A. Abou Chaaya, A. Julbe and P. Miele, Nanoscale, 2015, 7, 5794–5802 RSC.
- T. Vidakovic-Koch, V. K. Mittalb, T. Q. N. Dob, M. Varnicic and K. Sundmacher, Electrochim. Acta, 2013, 110, 94–104 CrossRef CAS.
- T. R. Cook, D. K. Dogutan, S. Y. Reece, Y. Surendranath, T. S. Teets and D. G. Nocera, Chem. Rev., 2010, 110, 6474–6502 CrossRef CAS PubMed.
- B. E. Conway, L. Bai and M. A. Sattar, Int. J. Hydrogen Energy, 1987, 9, 607–621 CrossRef.
- A. K. M. Shamsul Huq and A. J. Rosenberg, J. Electrochem. Soc., 1964, 111, 270–278 CrossRef.
- A. K. Cheong, A. Lasia and J. Lessard, J. Electrochem. Soc., 1993, 140, 2721–2726 CrossRef CAS.
- A. Bélanger and A. K. Vijh, J. Electrochem. Soc., 1974, 121, 225–230 CrossRef.
- N. Pentland, J. O. M. Bockris and E. Sheldon, J. Electrochem. Soc., 1957, 104, 182–194 CrossRef CAS.
- I. A. Ammar and S. Darwish, J. Phys. Chem., 1959, 63, 983–985 CrossRef CAS.
- S. Schuldiner, J. Electrochem. Soc., 1959, 106, 891–896 CrossRef CAS.
Footnotes |
| † Electronic supplementary information (ESI) available: Fig. S1 and S2 as described in the text. See DOI: 10.1039/c6ta00392c |
| ‡ Current address: ICMMO – Bât. 410, Université Paris-Sud 11, Rue du Doyen Georges Poitou, F-91405 Orsay Cedex, France. |
| This journal is © The Royal Society of Chemistry 2016 |