 Open Access Article
Creative Commons Attribution 3.0 Unported Licence
On the electrochemical deposition of metal–organic frameworks†‡
Nicolò
Campagnol
ab,
Tom R. C.
Van Assche
c,
Minyuan
Li
b,
Linda
Stappers
a,
Mircea
Dincă
b,
Joeri F. M.
Denayer
c,
Koen
Binnemans
d,
Dirk E.
De Vos
e and
Jan
Fransaer
*a
aDepartment of Materials Engineering (MTM), KU Leuven, Kasteelpark Arenberg 44, B-3001 Leuven, Belgium. E-mail: jan.fransaer@mtm.kuleuven.be
bDepartment of Chemistry, Massachusetts Institute of Technology, 77 Massachusetts Ave, Cambridge, MA 02139, USA
cDepartment of Chemical Engineering, Vrije Universiteit Brussel, Pleinlaan 2, B-1050 Brussels, Belgium
dCentre for Surface Chemistry and Catalysis (COK), KU Leuven, Kasteelpark Arenberg 23, B-3001 Leuven, Belgium
eDepartment of Chemistry, KU Leuven, Celestijnenlaan 200F, B-3001 Leuven, Belgium
First published on 11th February 2016
Abstract
The electrochemical deposition of Metal–Organic Frameworks (MOFs) is an interesting technique to synthesise adherent, microporous layers on top of conductive substrates. The technique can be subdivided in two approaches: anodic and cathodic deposition. While the mechanism of the cathodic approach has already been well investigated, at least for MOF-5, up to now not much is known about the anodic approach. In this paper, a four-step mechanism is proposed to better understand the anodic deposition, and the same MOF used for the investigation, HKUST-1, is also deposited cathodically to compare the two approaches. This study focuses on how nucleation starts and proceeds, on the influence of the potential applied, the stresses in the growing layers, and the origin of defects like delamination and MOF detachment. The study is followed by critical considerations on the methods and on the technique, together with suggestions and guidelines to synthesise new MOF layers.
Introduction
Functionalisation of surfaces is an important topic in materials science. The functionalisation often involves the addition of a second material, a coating, which can be synthesised and applied in many ways, depending on its nature and characteristics (melting temperature, solubility, conductivity…) and those of the substrate. The application (or formation) of porous coatings is appealing for many reasons: particles or molecules can be pre-loaded in the pores changing the optical (dyes), catalytic (catalytic particles/molecules), tribologic (lubricants) properties of the surface, or, alternatively, the coating itself can act as a host for molecules present in the environment, behaving like a membrane or a filter.Metal–Organic Frameworks (MOFs) are a novel class of materials with very high porosity. These compounds are based on metal (or metal–oxygen) centres, connected by organic linkers to form light and hollow 1D, 2D or 3D structures.1,2 The choice of many possible metals and a virtually infinite number of linkers, make them extremely tuneable and adjustable for different applications.3 MOF structures are obtained by self-assembly of the organic linkers with the metal ions, typically supplied in a solvent as a weak organic acid and a metal salt, respectively. MOF can be shaped as layers with a vast array of methods, from direct drop casting of MOF crystals dispersed in a solvent to the more laborious layer by layer deposition.4 These mesoporous layers have been tested for several applications,5 for example luminescent MOFs showed promising results in molecule detections,6 while MOFs with specific pore dimensions can be used for gas separation and storage,7,8 and a good combination of active sites and pore dimensions may be very interesting for the field of catalysis.4
The electrochemical method used in industry to produce MOFs is based on the delivery of the metal ions electrochemically by anodic dissolution, avoiding the use of salts and reducing the synthesis time.9 Ameloot et al. reported that this technique can be used to electrodeposit MOF coatings anodically if the formed coordination polymers assemble on the anodic surface.10,11 As said above, the synthesis of MOF films is very important for a wide range of applications,12 and in particular anodically synthesised MOF layers have been successfully tested for humidity,3 explosives,13 oxygen and glucose sensing,14 and gas separation.15,16 As shown in recent publications, these layers are compact and well adherent,17 and if synthesised under certain conditions, they can be more than one crystal layer thick.15 Moreover, they are expected to have the same properties of the crystals formed in solution, but exceptions have been reported.18 Still, several questions about the deposition mechanism remain unresolved; for example some researchers claim the possibility to electrochemically synthesise well known MOFs like MIL-53(Al) in the form of powders, but the impossibility to make layers.19 Moreover, in order to grow thick MOF layers anodically it is important to know whether the MOF growth takes place below or on top of the already formed coating. This has implications for the adhesion of the layers, because if the layers grow at the MOF–solution interface, the adhesion between the MOF layer and the substrate will eventually be lost as the MOF layer gets undercut by the dissolution of the substrate. Another possible occurrence is that a different phase without linker, like an oxide or hydroxide, might form at the MOF–substrate interface, equally undermining the layer adhesion. In fact, delamination defects due to delamination of the MOF layers synthesised with the electrochemical technique have already been reported, but the origin of this phenomenon has not been explained yet.16
After the anodic synthesis was reported, another electrochemical approach was developed: the cathodic approach.20 This approach makes use of a solution containing all the starting components needed for the synthesis (metal ions and linker) and is based on the production of a “pro-base” at the cathode, for example nitrite ions from the nitrates already present in solution, which can react with the linker, deprotonating it. The abundance of metal ions attracted by the negative potential and of the deprotonated ligand triggers the self-assembly and precipitation of MOF crystals which might also pass via an oxide-hydroxide intermediate.21 The mechanism of the cathodic synthesis has been recently extensively analysed, at least for MOF-5, an iconic MOF based on zinc(II) ions and terephthalic acid.21 Moreover, Liu et al. electrodeposited films of rare earth based MOFs with the cathodic approach, yielding promising detectors and tuneable luminescent layers.22,23 In both cases the metal used is very unnoble, which allows, at least in theory, to electrodeposit pure MOF phases. In contrast, no investigations are available for noble metals with which the co-deposition with the MOF in the layer is expected to be unavoidable, but not necessarily a negative outcome. The mechanism of adhesion to the substrate of cathodically synthesised layers has been hardly explored: the only available data being a scratch test using UIO-66 layers.24 But, since it was not the main focus of the paper, the synthesis parameters to obtain those layers have not been optimised, and the reason of the crystal adhesion to the substrate, or lack of it, has anyway not been explained yet.
In this paper we show that the anodic electrochemical nucleation and growth of MOF layers happens in four phases. Information about these four phases was obtained using different experimental techniques, e.g. Electrochemical Quartz Crystal Microbalance (EQCM), a homemade laser curvature setup, Rotating Ring Disk Electrode (RRDE), X-Ray Diffraction (XRD), and Scanning Electron Microscopy (SEM) equipped with Energy Dispersion Spectroscopy (EDS). Most of the information was obtained with the electrochemically grown archetypical MOF HKUST-1 (Cu-BTC, based on copper and trimesic acid or H3BTC), but for some specific experiments were used derivatives of copper(II) isonicotinate (Cu-INA) with chlorine or fluorine atoms in position 2 of the linker ring. Moreover, we compare the two methods, anodic and cathodic, in order to describe the differences and the strong and weak points of the two. To do this we synthesised the same MOF (HKUST-1) cathodically in different conditions, unveiling new aspects of this technique. Lastly, we propose some guidelines and general suggestions which might be useful for other researchers who want to electrochemically deposit MOFs.
Experimental
Synthesis of HKUST-1
To study the influence of the solvent and the variation in crystals dimensions, HKUST-1 was synthesised electrochemically on thin copper meshes (99.98% copper, 8 μm thick with windows of ca. 50 μm2, Precision Eforming, U.S.A.). Methanol (MeOH, Sigma-Aldrich, 99.8%), ethanol (EtOH, VWR, 99.9%), and dimethyl-sulphoxide (DMSO, Sigma-Aldrich, 99.9%) were used as solvents, typically with water as co-solvent. The linker for these synthesis mixtures was 1,3,5-benzenetricarboxylic acid (trimesic acid, H3BTC, Sigma-Aldrich, 95%) in a concentration of 16 g L−1 (76 mM). Other synthesis details are reported in a recent paper.25To study the four phases of the electrodeposition, the same MOF was synthesised using copper-coated silicon wafers or platinum-coated quartz crystals (Testbourne, area 1.37 cm2) as working electrodes. For the Electrochemical Quartz Crystal Microbalance (EQCM) experiments, the platinum-coated faces of the vibrating crystals were first electroplated with copper. The electrochemical experiments were controlled by a galvanostat/potentiostat (EG&G, model 273 or Solartron SI 1287) and an EQCM apparatus (RQCM, Inficon). A 2 cm thick mask was placed in front of the working electrode to prevent edge effects.26 A home-made Ag/AgCl (3 M KCl) served as reference, and platinum foils (with different dimensions depending on the experiment but always larger than the surface of the working electrode) were used as counter electrodes. Except where stated otherwise, the solution consists of ethanol/water (67![[thin space (1/6-em)]](https://www.rsc.org/images/entities/char_2009.gif) :
:![[thin space (1/6-em)]](https://www.rsc.org/images/entities/char_2009.gif) 33 vol%) with 10 g L−1 (48 mM) of H3BTC.15
33 vol%) with 10 g L−1 (48 mM) of H3BTC.15
Experiments regarding the diffusion coefficient of copper ions in the solution were run with a platinum rotating ring-disk electrode (RRDE, Pine Research Instrumentation, E7R8 Series). The disk diameter is 4.57 mm, and the inside and outside diameters of the ring are 4.93 mm and 5.38 mm, respectively. As counter and reference electrodes were used a platinum mesh and a home-made Ag/AgCl reference electrode. An Autolab 302N was used to control the electrochemical experiments. The diffusion coefficient used for the study of the anodic synthesis was calculated from RRDE data using the following formula:
 | (1) |
![[thin space (1/6-em)]](https://www.rsc.org/images/entities/char_2009.gif) :
:![[thin space (1/6-em)]](https://www.rsc.org/images/entities/char_2009.gif) 33 vol%) containing 10 g L−1 (48 mM) H3BTC. For each rotation speed, after a dwell time at open circuit potential, the disk was kept at +0.4 V vs. ref. and the ring at −0.4 V vs. ref.
33 vol%) containing 10 g L−1 (48 mM) H3BTC. For each rotation speed, after a dwell time at open circuit potential, the disk was kept at +0.4 V vs. ref. and the ring at −0.4 V vs. ref.
In situ stress measurements during MOF films growth were performed using a home-built laser curvature setup.28 The setup consists of a red laser (R-30995, Newport) which is focused on a glass cantilever (D 263 Schott, 60 × 3 × 0.108 mm) coated with 250 nm of gold on one side. When stressed films are deposited on the gold-plated face, the cantilever bends and the laser beam is deflected. Laser beam deflection is measured using a duo-lateral Position Sensitive Device (PSD, DLS-20 by UTD Sensors Inc). The relation between the laser deflection and the force per unit width F/w is given by Stoney's formula:
 | (2) |
To determine stresses in MOF films, first a 2 μm layer of copper was electrodeposited on the cantilever's gold-coated face causing tensile stress to arise.29 As a blank, thin film stress was measured during dissolution of copper in an ethanol/water (67![[thin space (1/6-em)]](https://www.rsc.org/images/entities/char_2009.gif) :
:![[thin space (1/6-em)]](https://www.rsc.org/images/entities/char_2009.gif) 33 vol%) electrolyte without H3BTC but with 10 g L−1 methyltributylammonium methyl sulphate (32 mM, MTBS, Sigma-Aldrich, 95%) to enhance the conductivity. The same experiment was repeated with the same electrolyte with 10 g L−1 of H3BTC (48 mM) and 10 g L−1 of MTBS (32 mM).
33 vol%) electrolyte without H3BTC but with 10 g L−1 methyltributylammonium methyl sulphate (32 mM, MTBS, Sigma-Aldrich, 95%) to enhance the conductivity. The same experiment was repeated with the same electrolyte with 10 g L−1 of H3BTC (48 mM) and 10 g L−1 of MTBS (32 mM).
The experiments on the cathodic deposition were run in a three electrode set-up with a CH potentiostat (CH instruments, 600D). The electrolyte used is derived from the first work on cathodic MOF deposition and consists of: 10 g L−1 H3BTC (48 mM, 95% Sigma-Aldrich), 24 g L−1 Cu(NO3)2·xH2O (100 mM, Sigma-Aldrich), and 11 g L−1 NaBF4 (100 mM, Sigma-Aldrich) used as supporting electrolyte, dissolved in DMF/water (75![[thin space (1/6-em)]](https://www.rsc.org/images/entities/char_2009.gif) :
:![[thin space (1/6-em)]](https://www.rsc.org/images/entities/char_2009.gif) 25 vol%). Fluorinated Tin Oxide (FTO) glass plates were used as working electrodes, platinum grids as counter, and a home-made Ag/Ag(Cryptand)+ electrode was used as reference.30 After synthesis the samples were gently dipped in acetone to wash away the synthesis liquor causing the loss of part of the crystals, but if dried without washing, these loosely attached crystals result in a non-adherent powdery layer.
25 vol%). Fluorinated Tin Oxide (FTO) glass plates were used as working electrodes, platinum grids as counter, and a home-made Ag/Ag(Cryptand)+ electrode was used as reference.30 After synthesis the samples were gently dipped in acetone to wash away the synthesis liquor causing the loss of part of the crystals, but if dried without washing, these loosely attached crystals result in a non-adherent powdery layer.
Synthesis of Cu-INA, Cu-INA(Cl) and Cu-INA(F)
A different MOF, Cu-INA, was used to compare the results obtained with HKUST-1 regarding the growth of anodically deposited layers. The electrolytes used for the synthesis are the following: 5.8 mmol of ligand (714 mg of isonicotinic acid (HINA), or 818 mg of HINA(F) or 914 mg of HINA(Cl)), 1 g (32 mM) of MTBS in 100 mL of ethanol/water (50![[thin space (1/6-em)]](https://www.rsc.org/images/entities/char_2009.gif) :
:![[thin space (1/6-em)]](https://www.rsc.org/images/entities/char_2009.gif) 50 vol%). 2-Chloropyridine-4-carboxylic acid (INA(Cl) 98%) and 2-fluoropyridine-4-carboxylic acid (INA(F) 98%) were purchased from Matrix Scientific, while the pyridine-4-carboxylic acid (HINA, 99%) used is produced by Sigma-Aldrich. The depositions were run in a small (5 mL) two electrode set-up with different applied potentials vs. the counter electrode (a platinum coil), for different durations, and always at 60 °C. Cu-INA was deposited at 3 V for 3 min, Cu-INA(Cl) for 4 min at 2 V, and Cu-INA(F) at 3 V for 4 min. The substrates used are copper plates with a surface of circa 1 to 2 cm2. The electrolyte mix is not soluble at room temperature and has therefore to be stirred at 60 °C for several minutes before a clear solution is obtained. Very important for the synthesis is to avoid dipping the copper plates in solution before the desired temperature is reached, since the contact of the copper surfaces with the electrolyte would start the reaction, leading to undesired phases.
50 vol%). 2-Chloropyridine-4-carboxylic acid (INA(Cl) 98%) and 2-fluoropyridine-4-carboxylic acid (INA(F) 98%) were purchased from Matrix Scientific, while the pyridine-4-carboxylic acid (HINA, 99%) used is produced by Sigma-Aldrich. The depositions were run in a small (5 mL) two electrode set-up with different applied potentials vs. the counter electrode (a platinum coil), for different durations, and always at 60 °C. Cu-INA was deposited at 3 V for 3 min, Cu-INA(Cl) for 4 min at 2 V, and Cu-INA(F) at 3 V for 4 min. The substrates used are copper plates with a surface of circa 1 to 2 cm2. The electrolyte mix is not soluble at room temperature and has therefore to be stirred at 60 °C for several minutes before a clear solution is obtained. Very important for the synthesis is to avoid dipping the copper plates in solution before the desired temperature is reached, since the contact of the copper surfaces with the electrolyte would start the reaction, leading to undesired phases.
Characterisation
Scanning electron microscopy (SEM) and energy dispersive spectroscopy (EDS) were done with a JEOL 6400, a FEI XL30, or a FEI-Nova NanoSEM 450. As MOFs are not conductive, the samples were sputtered before SEM observation with Pt/Pd in order to increase the conductivity and improve the imaging.FIB cross sections were taken with a Focus Ion Beam equipped FIB-NanoSEM FEI Nova 600 Nanolab, and no Pt/Pd coating was used for this technique. X-ray diffraction patterns were recorded with a Seifert 3003 T and with a Bruker D8 Discover.
Results and discussion
The mechanism of anodic MOF deposition
The electrodeposition mechanism we propose is shown in Fig. 1 with a sketch and SEM pictures. It can be divided in four phases: nucleation, growth of islands, intergrowth and detachment. At the beginning, copper(II) ions are released in solution where the linker is present; when the critical concentration of reagents is reached, nuclei form in solution and on the surface (Phase I: initial nucleation); these nuclei grow to micrometric-sized crystals on the surface next to and on top of each other (Phase II: growth of islands); new crystals keep on nucleating (progressive nucleation) and grow forming an intergrown layer (Phase III: intergrowth). Lastly, parts of the MOF layer lose contact with the substrate and are released into the solution, aided by the internal stress in the MOF layer and the undercut of the crystals (Phase IV: detachment).The phases are described in the following sections:
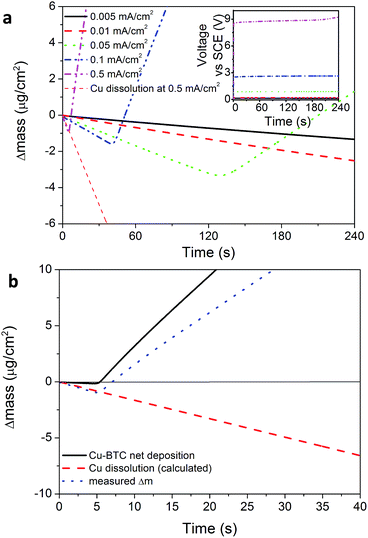
To better understand the initial phase of the process, the electrode variation in mass was studied during nucleation with an Electrochemical Quartz Micro Balance (EQCM, Fig. 2). Using galvanic depositions it is observed that nucleation of HKUST-1 happens only after a certain lag time during which the mass of the electrode decreases (Fig. 2a) in accordance with Faraday's law (assuming 100% current efficiency). This effect can be explained by the fact that a critical metal ion (and ligand) concentration (Cc) needs to be reached on the electrode surface to start the nucleation of the MOF phase. When the critical concentration is reached, the EQCM signal bends upward, corresponding to a net increase in the mass of the vibrating quartz crystal. A similar effect was reported earlier for phosphate conversion layers,31 and the event can be isolated by subtracting the variation of mass due to the dissolution of copper (calculated using Faraday's law and assuming 100% current efficiency for the dissolution of copper), from the variation of mass measured at the electrode (Fig. 2a).
Fig. 2b shows EQCM plots taken during electrochemical depositions done at different current densities. It is evident that more time and more metal ions are needed to nucleate MOF crystals if lower current densities are used. At the lowest current densities, the nucleation threshold is never reached and the only thing happening in the timeframe of the experiment is the dissolution of the copper substrate in solution, and therefore the formation of MOF crystals as free crystals in solution and not as a coating. In the long term and at low currents, the acidity of the solution plays an increasing role and the dissolution of the substrate. Eventually a MOF coating may form on the electrode if enough copper is available, similarly to a “corrosion deposition”15 or a “galvanic displacement”.32
It is possible to estimate the concentration of copper ions on the electrode surface using a one-dimensional diffusion equation (Fick's second law):
 | (3) |
 | (4) |
 | (5) |
With these data, eqn (5) was used to estimate the critical copper concentration on the electrode surface. The distance (x) at the electrode surface is zero by definition, and the diffusion coefficient (D) was measured as reported below. The resulting critical concentrations (column 4 of Table 1) are much lower than the concentration of copper source normally used in the solvothermal synthesis (0.1–0.2 mol L−1),1,33,34 but to the best of our knowledge no report has been published on the minimum concentration of Cu2+ ions to start the synthesis. As can be seen from Table 1, there is not a critical charge that has to be delivered to start the nucleation since with slower dissolution of ions in solution it is more difficult to reach the critical copper concentration. The diffusion coefficient used in Table 1 was calculated with eqn (1) from the Rotating Ring Disk Electrode (RRDE) data plotted as the transient time versus the inverse of the rotation speed in Fig. 3.
| Current density mA cm−2 (A m−2) | Induction time (s) | Charge (C) | Critical Cu2+ concentration (mol L−1) |
|---|---|---|---|
| 0.5 (5.0) | 5 | 3.0 × 10⁻³ | 0.62 × 10⁻³ |
| 0.1 (1.0) | 41 | 4.92 × 10⁻³ | 0.35 × 10⁻³ |
| 0.05 (0.5) | 132 | 7.92 × 10⁻³ | 0.31 × 10⁻³ |
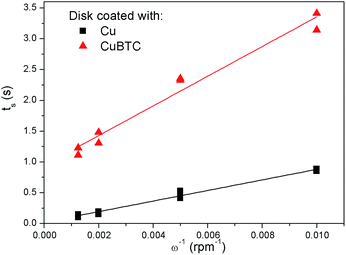 | ||
| Fig. 3 Transient time measured at different rotation speeds with a RRDE with the disk coated with copper (Cu), and with copper and HKUST-1 (CuBTC), in a trimesic acid solution. | ||
The slope calculated from the transient times is 85.88 rpm s−1 (R2 = 0.98), leading to a diffusion coefficient D of 1.12 × 10⁻¹⁰ m2 s−1, circa one order of magnitude smaller than the value reported in literature for Cu2+ ions in water at 25 °C (1.43 × 10⁻⁹ m2 s−1).35
Part of this difference is due to the higher viscosity of the ethanol/water mixtures in comparison to the pure liquids,36,37 while another fraction to the low ion concentration and ion coordination radius. Lastly, due to the electrodeposited copper on the disc, the geometry of the RRDE might be different (the disc radius might be larger) and therefore the K value used in eqn (1) could be slightly different from the nominal one.
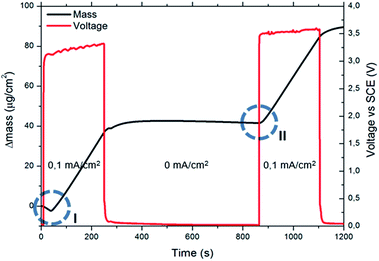
When using the EQCM set up for sequential MOF deposition experiments (i.e. without stripping and depositing new copper), it was observed that after the first MOF crystals have nucleated, the deposition proceeds without the need for new nucleation (compare the encircled mass vs. time transients in Fig. 3). This implies that no critical copper concentration needs to be reached when MOF crystals are already present on the surface, since they can either grow or act as nucleation sites. This behaviour is exemplified in the experiment illustrated in Fig. 4, where a galvanostatic deposition of HKUST-1 at 0.1 mA cm−2 was split in two parts separated by a period of 10 min during which no current was applied. During this interruption, the copper ions created near the surface of the anode in the first deposition step diffuse into the bulk, restoring the pre-synthesis conditions. After 10 min the current is applied again and, because HKUST-1 crystals are already present on the surface, the deposition continues immediately without a lag-time needed to reach the critical nucleation threshold.
Due to this, the current density and hence the local copper concentration increase in the immediate vicinity of existing crystals which, if the critical nucleation threshold is surpassed, will lead to the formation of new nuclei.38 Moreover, the formation of islands might explain why it is not needed to reach the critical concentration to grow a layer when MOF crystals are already present on the surface, like in the experiment reported in Fig. 4. A common issue while measuring transient times with a copper electrode in a solution containing trimesic acid, is the tendency of MOF precipitation on the electrode with consequent partial passivation of the surface. The copper layer on the disk, which was rinsed in diluted nitric acid before every experiment to remove the MOF forming, had therefore to be completely stripped and redeposited every few experiments to avoid a drift to longer transient times due to surface passivation. To show more explicitly this occurrence, a MOF layer was deliberately grown on the disk surface (5 min 1.5 V vs. ref.) and the same tests to measure the transient time were conducted. The resulting transient times (Ts) are plotted in Fig. 3, and it is evident how not only the Ts are longer, but also the fitting line does not intercept the origin of the graph. Therefore, the MOF layer contributes remarkably to the diffusion of copper ions, slowing them down and acting as an “apparent viscosity”.
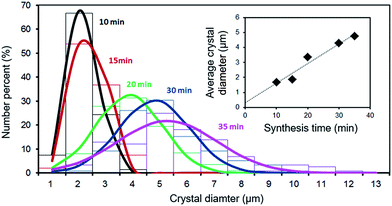
As already reported for the solvothermal synthesis of HKUST-1,39 the nucleation during electrochemical synthesis of this MOF is progressive and extends well into the crystal growth phase. Therefore, while in the first seconds the crystals have almost all the same size, after the first minutes of synthesis big (grown) crystals and small just nucleated ones are present in the solvothermal bath. This behaviour was also observed in the electrochemical synthesis, as shown in Fig. 5: the size distribution of the crystals broadens with time, and the average size increases.
| E = E0 + ηactivation + ηohmic + ηconc | (6) |
Stresses arise in most electrodeposition processes,40 and a home-made laser curvature device was built and used to measure the stresses occurring at the surface during MOF-electrodeposition. The cantilever used as working electrode for the experiments has a conductive face which was coated with copper, and a non-conductive one which is used to reflect a laser beam. Applying Stoney's formula (eqn (2)) it is possible to calculate the stress in the film. In the ESI‡ is reported a graph showing the stress evolution in the copper film upon deposition of HKUST-1. A compressive stress arises from the first instants when the potential is applied. The compressive stress is partially due to the dissolution of the copper film which contains tensile stress28,29 and to the deposition of HKUST-1 crystals. A compressive stress is in good agreement with the appearance of most MOF layers and HKUST-1 ones in particular: the layers appear to be constituted by continuous films of intergrown crystals with good adhesion to each other, and while buckling of the layers can be observed, cracks have not been reported for this MOF.17
As described already, MOF coatings can be synthesised electrochemically as one compact thin layer of intergrown crystals.10 But if the conditions are favorable15 or the synthesis is run for longer times,16 the obtained layers are more than one crystal thick. As schematized in Fig. 6, once the substrate is fully covered, further growth of the MOF layer can happen either at the MOF–substrate interface, or at the MOF–solution interface.
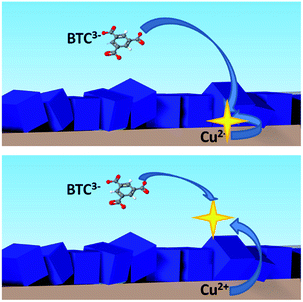 | ||
| Fig. 6 Scheme of the two possible mechanisms of MOF growth: from the bottom, at the MOF–substrate interface (top), or from the top of the MOF–solution interface (bottom). | ||
Taking HKUST-1 as an example, a first approach to understand where the MOF layer grows once the substrate is fully covered is to look at the dimensions of the MOF micropores in comparison to the dimensions of the metal ions and linkers. The distorted octahedron characteristic of solvated copper(II) ions generated at the anode can pass through the MOF structure, since the hydrated copper(II) ions have a diameter of 0.456 nm,41 while the pores of HKUST-1 have a size of 0.9 × 0.9 nm.42 Indeed, the motion of small ions through MOF structures has already been shown in MOF-based batteries43 and supercapacitors44 electrodes, and the diffusion coefficient was calculated in the previous section. Another proof of the motion of metal ions through the MOF layers is the edge effect often observed in their synthesis: when no mask is used in front of the anode, MOF crystals grow only at the edges of the electrode, leaving bare copper in the centre, see ESI.‡ In fact, if the layers were perfectly insulating and solvated ions could not go through them, the growth, from a macroscopic point of view, would start from the edges of the anode (where the current density is highest) and continue toward the centre, eventually covering the whole surface. Also, BTC3− molecules are expected to be too large to go inside the pores since the minimum calculated diameter of the planar molecule is 2.1 nm, twice the dimensions of HKUST-1 pores. In the recent conference transaction on which this work is based,45 we reported the adsorption of m-xylene and 1,3,5-tris(propan-2-yl)benzene in HKUST-1, demonstrating that molecules as big as trimesic acid cannot go through the pores of the MOF. In the same work this results was supported by experiments based on the sequential synthesis of HKUST-1 layers in solvents leading to crystals of different dimensions. If the first solvent used was water/methanol and the second DMSO/methanol, the small crystals typical of the second solvents could be found on top of big crystals synthesised in the first step, see ESI.‡ Other insights on the effect of different solvents have been reported recently by Van Assche et al.46
These tests give strong indications that MOF layers growth occurs at the MOF–electrolyte interface but are not conclusive. It was therefore decided to run a set of experiments using modified linkers to have elemental markers in the MOF structure.
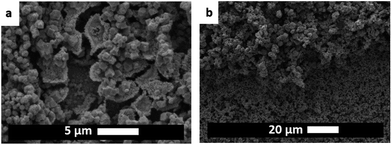
As modified versions of trimesic acid are not available commercially, this investigation had to be conducted with copper isonicotinate (Cu-INA), a MOF based on isonicotinic acid which can be purchased with fluorine and chlorine as substituent. These two halogen atoms are small enough to not sterically alter the framework and can be detected by EDS. The details of the deposition of pure Cu-INA(X) (with X = Cl or F) are reported in the ESI.‡ To study the formation of multilayer coatings, the first formed layer must be stable in the solution used. Post-synthetic linker exchange has been reported by many authors with several MOFs,47,48 and is even more likely in the experiments reported here as the linkers used are very similar and the second layer is grown in synthesis conditions similar to those of the first one. We observed that with Cu-INA(X) layers, the linker substitution occurs even if no current is applied, and the morphology of the layers changes towards shapes more similar to those expected for the alternative linker, see Fig. 7. In fact, Cu-INA(F) and Cu-INA(Cl) can be easily discriminated under the microscope, as the crystals of the first are shaped liked cubes, and those of the second one as plates. Fig. 7 shows the surface morphology of two Cu-INA(X) layers synthesised and then exposed to a solution of the other halogenated isonicotinate, with and without current imposed. In both cases, the top layer undergoes major changes upon exposure to the new linker. When the layer is just left in solution, the crystals only change their shape, while when current is applied the new phase grows from the existing one. This is very evident in Fig. 7, where the plate shaped crystals typical of Cu-INA(Cl) grow perpendicularly on top of the Cu-INA(F) cubes.
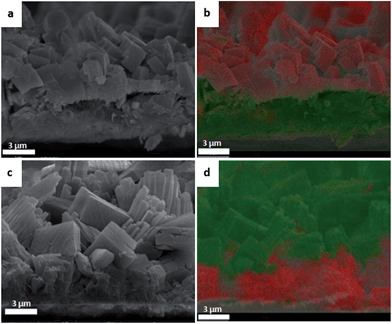
The deposition of a coating made by a sequence of two layers of Cu-INA(X) was achieved by growing a thick and compact first layer, followed by the deposition of the second, exposing the MOF layer for as little time as possible to the solution with the new linker. The cross-sections of the samples were analysed by NanoSEM and EDS (Fig. 8). Already from the analysis of the crystals and their positions, it might be said that the growth of new crystals happens on top of the existing one, but the elemental mapping shows unequivocally that this is what actually happens. A clear division in concentration of the halogen elements is observed: chlorine is found at the bottom when Cu-INA(Cl) is synthesised first, and at the top when Cu-INA(Cl) is synthesised last, and the analogous behaviour is observed for fluorine. Therefore, it can be stated that the first layer synthesised is found on the bottom of the film and the second on the top and hence MOF layers grow at the MOF–electrolyte interface by the diffusion of copper through the MOF layer.
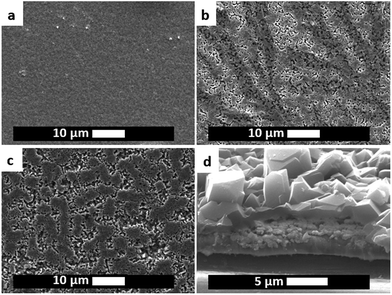
Moreover, it is observed that during the anodic electrochemical MOF synthesis, the copper substrate does not dissolve uniformly, but dissolves preferentially at certain locations. These preferential sites do not correspond to the space between MOF crystals, but most probably to the grain boundaries of the substrate (Fig. 9d).
Cathodic deposition of HKUST-1
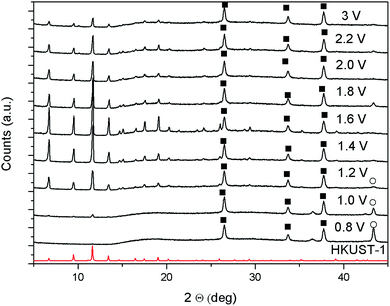
As described in the introduction, the cathodic deposition mechanism has already been studied and described in details for MOF-5.20,21 The stages in which the process evolves are similar to the initial ones shown above for the anodic synthesis: nucleation of dispersed nuclei, formation of islands of crystals, and intergrowth. An interesting difference with the anodic approach is that, at least for MOF-5, if two layers are synthesised sequentially, the second one is not found at the top of the first, but at the bottom, therefore the whole problem of detachment due to undercut does not apply for this approach.49In order to explore the mechanism of cathodic deposition in the case of a different MOF and increase the knowledge on the electrochemical technique, HKUST-1 was synthesised cathodically starting from a DMF/water solution containing copper(II) nitrate, trimesic acid, and sodium tetrafluoroborate as conductive electrolyte. The appearance of the films that can be obtained cathodically depends strongly on the potential applied. As can be observed from the XRD patterns of the samples, shown in Fig. 10, applying slightly cathodic potentials the substrates get covered only by copper (reaction 1), while starting from −1 V vs. Ag/Ag(Crypt)+ also HKUST-1 can be detected.
| Cu2+ + 2e− ⇄ Cu0 | (7) |
| NO3− + 4e− + 2H+ ⇄ NO2− + H2O | (8) |
| NO2− + 3H2O ⇄ NO3− + 2OH− + 2H2 | (9) |
| OH− + H3BTC ⇄ H2BTC− + H2O | (10) |
| H2BTC− + Cu2+ ⇄ HKUST-1[Cu3BTC2] | (11) |
The cathodic electrodeposition is due to a shift in the pH in the proximity of the electrode surface which has so far been attributed to the reduction of nitrates acting as pro-bases, reaction 2, 3, followed by 4.20,22 Due to the fact that nitrates in this environment get reduced at −1.6 V vs. ref.,20 it can be stated that for this MOF the reduction step does not (necessarily) pass via a pro-base like in the case of MOF-5, but it is the hydrogen evolving at the electrode which directly moves the equilibrium and triggers the deprotonation of the ligand, reaction (12) followed by (10) and (11).
| 2H2O + 2e− ⇄ 2OH− + H2 | (12) |
To be sure of this, CVs were run in a trimesic acid solution free of copper ions, see ESI.‡ The onset of hydrogen formation, and consequent H3BTC deprotonation, is observable at −1.0 V vs. ref., which is exactly the potential where the deposition of HKUST-1 is observed, see XRD in Fig. 10. At the same time, if copper ions are present in the solution, copper deposits at any potential more negative than the open circuit.
Already with MOF-5 it was observed that it is difficult to synthesise a layer free of co-deposited zinc metal, and the use of copper which is much nobler than zinc makes the co-deposition even more likely. In the case of HKUST-1 electrodeposition, moving towards more cathodic potentials, the amount of copper decreases in comparison to the MOF phase in the samples. At potentials more negative than −2 V vs. Ag/Ag(Crypt)+ the synthesised layers appear rough and uneven, probably due to the diffusion limitation of the reagents and side reactions. At very cathodic potentials one could expect the reduction of the coordination centres of the MOF to copper metal, as already reported by Loera-Serna et al.50 or during electrophoretic deposition,51 but, under the conditions tested, this reduction could not be observed or at least did not represent a major contribution to the composition of the layers or the shape and size of the crystals.
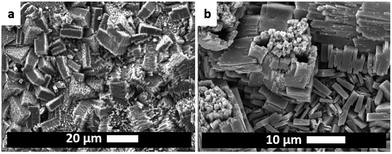
In all the samples synthesised it can be observed that the deposits are divided in two layers, a thin and adherent one, and a thick one, see ESI‡ and Fig. 11a. Using the SEM it was observed that the thick layer often sits on top of the thin one, and consists of relatively big and well interlocked octahedral crystals, while the thin one is composed of agglomerates and smaller crystals, see Fig. 11, 12 and ESI.‡ From the crystals shape and layer composition (both phase and elemental, see ESI‡) it can be speculated that the top part is made out of HKUST-1 crystals, while the lower one by a co-deposited coating made out of copper and MOF. As seen before, MOF crystals shield the electrode surface from the supply of ligand, while just hamper the diffusion of metal ions. This might be a reason why, if the conditions are favourable for MOF formation in the proximity of the cathode, crystals nucleate and intergrown forming a layer of big crystals, while at the same time, closer to the surface, the concentration of ligand is lower and therefore smaller crystals and copper metal are the occurring phases. Choosing two potentials, e.g. −1.2 V and −1.6 V, it is possible to partially tune the amount of each layer. Coatings synthesised at more cathodic potentials consist mostly of the big crystals layer, do not have a good adhesion to the FTO plates and can be easily washed away after synthesis before they dry. On the other hand, layers synthesised at −1.2 V have a higher amount of the co-deposited copper + small MOF crystal and overall better adhesion to the substrate: in fact only the crystals on the top of the coating detach upon washing.
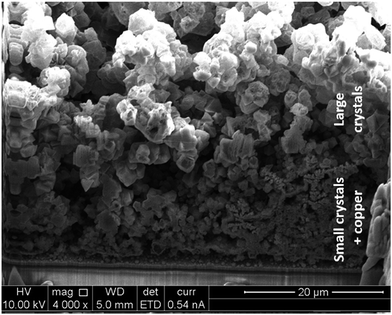 | ||
| Fig. 12 SEM-FIB cross-section of a sample showing the two layers on top of each other: small crystals + copper and big crystals. | ||
The evolution of the layers during electrodeposition was monitored by synthesising samples at different times. Applying −1.2 V vs. ref. it can be observed that copper metal deposits first (see XRD in ESI‡), creating a substrate where MOF crystals nucleate and grow. As can be seen from the SEM pictures reported in ESI,‡ copper can always be seen from a top view at any time, which implies that it continues to deposit even when the MOF is nucleating and growing. Therefore a two phases co-deposit is observed. On the other hand, applying −1.6 V, the first phase to deposit is HKUST-1, and only after a relatively long deposition time the signal of copper becomes visible in the XRD. This is probably due to the fact that more protons than copper ions get reduced at this potential significantly increasing the deprotonation of trimesic acid and consequent deposition of HKUST-1. As already observed by Li et al. with MOF-5,20 the electrodeposition of HKUST-1 in the early stages follows a similar pattern as the one observed for the anodic synthesis: nucleation of small nuclei, islands growth, and intergrowth, see ESI.‡ No detachment phase can be observed due to the absence of problems related to crystals undercut.
Considerations about the techniques
The choice of the substrate is regarded as the most evident difference between the anodic and cathodic deposition methods: allegedly, the anodic synthesis is limited by substrates containing the metal centres needed for the MOF Secondary Building Unit (SBU), while the cathodic synthesis is not bound to the choice of the substrate, as long as it is conductive.While at first glance this statement might be correct, the developments of both approaches showed a more complex pattern. On one hand, many metals can be deposited on conductive surfaces and then used as substrates to grow MOF anodically,15 and it was demonstrated also that starting from electrodeposited hydroxides or not too stable oxides, it is possible to obtain anodically layers of MOFs containing rare earths on any conductive surface.13 On the other hand, it was recently discovered that the actual mechanism of cathodic deposition of MOF-5 is not triggered only by the change of the pH which deprotonates the ligand, but passes via the synthesis of an hydroxide which is then converted into MOF,21 and, if the parameters are optimised, all the hydroxide is transformed into a MOF layer at the end of the synthesis.21 Therefore, the choice of the substrate should not be seen as a limitation for any of the two methods.
Crucial parameters to keep in consideration for the electrochemical method are the nature of the metal used and the pH of the solution. The pH is normally directly connected with the ligand used, since the pKa of the active sites of the ligand determines the pH required to have deprotonation. With the anodic approach, particularly in solutions containing water and oxygen, a high pH leads to the preferential production of oxides or hydroxides instead of free ions. The situation becomes worse for metals prone to passivation like nickel or aluminium,19 while it is not an issue with more noble metals like copper52 or which do not passivate in the used conditions, like iron.15 On the other hand, also using the cathodic approach it is difficult to avoid the deposition of hydroxides or oxides (one of the reasons why all the syntheses reported so far are run in DMF), or pure metal,20 except when using elements which are too anodic to be electrodeposited within the potential window of the electrolyte (like rare earths, Al or Mg) and the synthesis environment is also kept relatively acidic.20,22
The previous sections reported the case of a MOF which can be electrodeposited both anodically and cathodically. In both cases the crystallinity of the samples is very good, but the (microscopic) appearance of the layers is very different. Although this might be specific for HKUST-1, from the cross-sections, anodically synthesised layers are more compact than those synthesised cathodically, but the bottom part of the latter are well mixed with co-deposited copper metal, which might be an advantage for adherence and for applications requiring fast heat transfer. Anodically synthesised samples can show microscopic defects due to undercut while, due to the different synthetic mechanism, cathodically deposited samples do not show these types of defects, but might have macroscopic ones (flaking) if the potential applied is too cathodic and not enough copper is co-deposited in the layer.
In order to deposit a new MOF layer electrochemically, all these concepts should be kept in mind before choosing if and which approach to use. For example, one of the reasons why carboxylates remain so popular for both anodic and cathodic syntheses is that their low pKa helps keeping the electrolyte acidic, which prevents the deposition of unwanted secondary phases. The metals used in the syntheses so far reported in literature are also indicative of the best approach to take: noble metals (copper), but not too noble since dissolution in necessary, and non-passivating ones (iron) are very practical for anodic deposition, while anodic ones (zinc and the rare earths) are more suitable for cathodic deposition. If both approaches work, like in the case of HKUST-1, the choice can be made by focusing on the application or on the practicability of the method. It is beyond the scope of this paper to discuss this issue but, for example, it might be speculated that for applications requiring good heat transfer and large amount of crystals, the co-deposited MOF-copper layers obtained cathodically are expected to be better than layers synthesised anodically. On the other hand, if a high amount of well adherent MOF per unit area is required, anodic layers, which are normally denser, seems to be more promising.
Regarding the possible scale-up of the electrochemical technique, it must be pointed out that the anodic synthesis requires either a metal, or an intermediate step to form the substrate, while the cathodic one makes use of metal ions, which are on average easier to acquire and cheaper. But the cathodic synthesis makes use of relatively expensive stabilising solvents as DMF to avoid rapid MOF formation in solution, while the anodic synthesis can make use of cheaper ones like alcohols. In the same time, the electrolytic bath of the anodic synthesis can be used for long times, and can easily stand weeks without degrading, while the cathodic one, having both metal ions and ligand in it, is prone to degradation yielding MOF crystals in solution. An experiment showed that the electrolyte bath for cathodic deposition can be used a few days after it is prepared, while the electrolyte bath for anodic deposition is still useable after months.
Conclusions
In this paper we studied and compared the anodic and the cathodic electrochemical deposition mechanisms of Metal–Organic Frameworks (MOFs).A mechanism has been proposed to explain the anodic MOF electrodeposition process. The mechanism consist of four phases: (I) initial nucleation, (II) growth of MOF islands, (III) intergrowth, and (IV) crystal detachment. When an electric potential is applied, a lag time is needed before the electrodeposition of MOF on a bare surface starts. The duration of this lag time depends on the applied current and arises from the time that is needed to reach the critical ion concentration threshold for nucleating the new MOF phase. The nucleation is progressive and the dimensions of the crystals depend on the synthesis time and choice of the solvent. The growth of MOF layers happens at the MOF–solution interface, meaning that copper ions are dissolved at the metal–MOF interface, migrate through the MOF layer and react with the linker from the solution. This leads to the creation of voids at the substrate–MOF interface that eventually lead to the buckling of the brittle MOF layers and detachment due to the undercutting of the MOF layer.
The cathodic approach was applied to the same MOF used to study the anodic method, HKUST-1. For this MOF, no pro-base is needed to start the synthesis, which therefore can start at potentials less cathodic in comparison to MOF-5. The films and the type of deposit are found to vary with the applied potential, and the nucleation and growth follow a similar pattern to the anodic one, although the phase which nucleates first, metal or MOF, is potential dependent. The adhesion of the layers to the substrate is due to the intergrowth of the metallic copper phase with the MOF, and the potential applied influences the ratio between metallic copper and MOF in the layers.
In general, when choosing to use the electrochemical method to synthesise layers, one should first focus on the nature of the metal to be used for the SBU (is it noble or not, does it passivate or make hydroxides) and then on the choice of the ligand, which normally is connected to the solution pH. When these parameters are clear, the choice of anodic or cathodic approach becomes easier and sometimes, like in the case of HKUST-1, the layers can be obtained with both two techniques, and the resulting layers are not so different in crystallinity, but vary remarkably in the morphology, which may or may not be important for their application.
Acknowledgements
The authors would like to acknowledge T. Van der Donck (Hercules 3 ZW09-09 project) for some of the NanoSEM pictures and Professor B. W. Sheldon (Brown University) for the interesting discussion on the stress evolution part. The authors thank IWT for the support in the SBO project MOFShape. NC, LS and JF thank Dr G. Stafford (NIST) for his contribution in the construction of the electrochemical laser curvature set-up. NC is very grateful to the FWO short staying abroad scheme (V441415N) and to the Royal Society of Chemistry, Materials Chemistry Division, for their trust and support to the visit period at the Massachusetts Institute of Technology. M.D. was supported by the U.S. Department of Energy, Office of Science, Office of Basic Energy Sciences (U.S. DOE-BES, Award No. DE-SC0006937).Notes and references
- S. S. Y. Chui, S. M.-F. Lo, J. P. H. Charmant, A. G. Orpen and I. D. Williams, Science, 1999, 283, 1148–1150 CrossRef CAS PubMed.
- N. Stock and S. Biswas, Chem. Rev., 2011, 112, 933–969 CrossRef PubMed.
- H. Furukawa, K. E. Cordova, M. O'Keeffe and O. M. Yaghi, Science, 2013, 341, 1230444 CrossRef PubMed.
- A. Betard and R. A. Fischer, Chem. Rev., 2012, 112, 1055–1083 CrossRef CAS PubMed.
- O. Shekhah, J. Liu, R. A. Fischer and C. Woll, Chem. Soc. Rev., 2011, 40, 1081–1106 RSC.
- M. D. Allendorf, C. A. Bauer, R. K. Bhakta and R. J. T. Houk, Chem. Soc. Rev., 2009, 38, 1330–1352 RSC.
- S. Qiu, M. Xue and G. Zhu, Chem. Soc. Rev., 2014, 43, 6116–6140 RSC.
- N. Rangnekar, N. Mittal, B. Elyassi, J. Caro and M. Tsapatsis, Chem. Soc. Rev., 2015, 44, 7128–7154 RSC.
- U. Mueller, US Pat., 2007/0227898 A1, 2007.
- R. Ameloot, L. Stappers, J. Fransaer, L. Alaerts, B. F. Sels and D. E. De Vos, Chem. Mater., 2009, 21, 2580–2582 CrossRef CAS.
- H. Al-Kutubi, J. Gascon, E. J. Sudhölter and L. Rassaei, ChemElectroChem, 2015, 2, 462–474 CrossRef CAS.
- A. Betard and R. A. Fischer, Chem. Rev., 2012, 112, 1055–1083 CrossRef CAS PubMed.
- N. Campagnol, E. R. Souza, D. E. De Vos, K. Binnemans and J. Fransaer, Chem. Commun., 2014, 50, 12545–12547 RSC.
- K.-Y. Cheng, J.-C. Wang, C.-Y. Lin, W.-R. Lin, Y.-A. Chen, F.-J. Tsai, Y.-C. Chuang, G.-Y. Lin, C.-W. Ni, Y.-T. Zeng and M.-L. Ho, Dalton Trans., 2014, 43, 6536–6547 RSC.
- N. Campagnol, T. Van Assche, T. Boudewijns, J. Denayer, K. Binnemans, D. De Vos and J. Fransaer, J. Mater. Chem. A, 2013, 1, 5827–5830 CAS.
- T. R. C. Van Assche and J. F. M. Denayer, Chem. Eng. Sci., 2013, 95, 65–72 CrossRef CAS.
- B. Van de Voorde, R. Ameloot, I. Stassen, M. Everaert, D. De Vos and J.-C. Tan, J. Mater. Chem. C, 2013, 1, 7716–7724 RSC.
- S. Sachdeva, A. Pustovarenko, E. J. Sudhölter, F. Kapteijn, L. C. de Smet and J. Gascon, CrystEngComm, 2016 Search PubMed.
- A. Martinez Joaristi, J. Juan-Alcañiz, P. Serra-Crespo, F. Kapteijn and J. Gascon, Cryst. Growth Des., 2012, 12, 3489–3498 CAS.
- M. Li and M. Dinca, J. Am. Chem. Soc., 2011, 133, 12926–12929 CrossRef CAS PubMed.
- M. Li and M. Dincă, Chem. Mater., 2015, 27, 3203–3206 CrossRef CAS.
- H. Liu, H. Wang, T. Chu, M. Yu and Y. Yang, J. Mater. Chem. C, 2014, 2, 8683–8690 RSC.
- H. Liu, T. Chu, Z. Rao, S. Wang, Y. Yang and W. T. Wong, Adv. Opt. Mater., 2015, 3(11), 1545–1550 CrossRef CAS.
- I. Stassen, M. J. Styles, T. R. Van Assche, N. Campagnol, J. Fransaer, J. F. Denayer, J.-C. Tan, P. Falcaro, D. E. De Vos and R. P. Ameloot, Chem. Mater., 2015, 27, 1801–1807 CrossRef CAS.
- T. R. C. Van Assche, G. Desmet, R. Ameloot, D. E. De Vos, H. Terryn and J. F. M. Denayer, Microporous Mesoporous Mater., 2012, 158, 209–213 CrossRef CAS.
- J. Newman, J. Electrochem. Soc., 1966, 113, 501–502 CrossRef CAS.
- B. González, N. Calvar, E. Gómez and Á. Domínguez, J. Chem. Thermodyn., 2007, 39, 1578–1588 CrossRef.
- O. E. Kongstein, U. Bertocci and G. R. Stafford, J. Electrochem. Soc., 2005, 152, C116–C123 CrossRef CAS.
- S. Ahmed, T. T. Ahmed, M. O'Grady, S. Nakahara and D. N. Buckley, J. Appl. Phys., 2008, 103, 103–115 CrossRef.
- A. Lewandowski, M. Osińska, A. Swiderska-Mocek and M. Galinski, Electroanalysis, 2008, 20, 1903–1908 CrossRef CAS.
- K. M. Ogle, C. Gabrielli, M. Keddam and M. Perrot, J. Electrochem. Soc., 1994, 141, 2655–2658 CrossRef CAS.
- R. Ameloot, L. Pandey, M. Van der Auweraer, L. Alaerts, B. F. Sels and D. E. De Vos, Chem. Commun., 2010, 46, 3735–3737 RSC.
- E. Biemmi, S. Christian, N. Stock and T. Bein, Microporous Mesoporous Mater., 2009, 117, 111–117 CrossRef CAS.
- M. Hartmann, S. Kunz, D. Himsl and O. Tangermann, Langmuir, 2008, 24, 8634–8642 CrossRef CAS PubMed.
- W. M. Haynes, CRC Handbook of Chemistry and Physics, 2005 Search PubMed.
- I. S. Khattab, F. Bandarkar, M. A. A. Fakhree and A. Jouyban, Korean J. Chem. Eng., 2012, 29, 812–817 CrossRef CAS.
- B. González, N. Calvar, E. Gómez and Á. Domínguez, J. Chem. Thermodyn., 2007, 39, 1578–1588 CrossRef.
- J. Fransaer and J. R. Roos, J. Heat Transfer, 1992, 114, 317–325 CrossRef CAS.
- F. Millange, R. El Osta, M. E. Medina and R. I. Walton, CrystEngComm, 2011, 13, 103–108 RSC.
- F. Czerwinski, J. Electrochem. Soc., 1996, 143, 3327–3332 CrossRef CAS.
- I. Persson, Pure Appl. Chem., 2010, 82, 1901–1917 CrossRef CAS.
- C. Prestipino, L. Regli, J. G. Vitillo, F. Bonino, A. Damin, C. Lamberti, A. Zecchina, P. L. Solari, K. O. Kongshaug and S. Bordiga, Chem. Mater., 2006, 18, 1337–1346 CrossRef CAS.
- R. Demir-Cakan, M. Morcrette, F. Nouar, C. Davoisne, T. Devic, D. Gonbeau, R. Dominko, C. Serre, G. Férey and J. M. Tarascon, J. Am. Chem. Soc., 2011, 133, 16154–16160 CrossRef CAS PubMed.
- N. Campagnol, R. Romero-Vara, W. Deleu, L. Stappers, K. Binnemans, D. E. De Vos and J. Fransaer, ChemElectroChem, 2014, 1, 1182–1188 CrossRef CAS.
- N. Campagnol, T. Van Assche, L. Stappers, J. F. M. Denayer, K. Binnemans, D. E. De Vos and J. Fransaer, ECS Trans., 2014, 61, 25–40 CrossRef.
- T. R. Van Assche, N. Campagnol, T. Muselle, H. Terryn, J. Fransaer and J. F. Denayer, Microporous Mesoporous Mater., 2016, 224, 302–310 CrossRef CAS.
- O. Karagiaridi, W. Bury, J. E. Mondloch, J. T. Hupp and O. K. Farha, Angew. Chem., Int. Ed., 2014, 53, 4530–4540 CrossRef CAS PubMed.
- J. G. Nguyen and S. M. Cohen, J. Am. Chem. Soc., 2010, 132, 4560–4561 CrossRef CAS PubMed.
- M. Li and M. Dinca, Chem. Sci., 2014, 5, 107–111 RSC.
- S. Loera-Serna, M. A. Oliver-Tolentino, M. López-Núñez, A. Santana-Cruz, A. Guzmán-Vargas, R. Cabrera-Sierra, H. I. Beltrán and J. Flores, J. Alloys Compd., 2012, 540, 113–120 CrossRef CAS.
- H. Zhu, H. Liu, I. Zhitomirsky and S. Zhu, Mater. Lett., 2015, 142, 19–22 CrossRef CAS.
- R. Ameloot, L. Stappers, J. Fransaer, L. Alaerts, B. F. Sels and D. E. De Vos, Chem. Mater., 2009, 21, 2580–2582 CrossRef CAS.
Footnotes |
| † Part of this work was published as N. Campagnol et al., ECS Transaction, 2014, 61, 25–40. |
| ‡ Electronic supplementary information (ESI) available: RRDE experiment, layers stress evolution, adsorption of m-xylene and triisopropylbenzene, additional SEM pictures, CVs relative to the cathodic deposition. See DOI: 10.1039/c5ta10782b |
| This journal is © The Royal Society of Chemistry 2016 |


