 Open Access Article
Creative Commons Attribution 3.0 Unported Licence
Heteroatom doped graphdiyne as efficient metal-free electrocatalyst for oxygen reduction reaction in alkaline medium†
Shuangshuang
Zhang
ad,
Yingjun
Cai
a,
Hongyan
He
a,
Yaqin
Zhang
ad,
Rongji
Liu
a,
Hongbin
Cao
a,
Meng
Wang
ad,
Jingjing
Liu
ae,
Guangjin
Zhang
*a,
Yuliang
Li
b,
Huibiao
Liu
b and
Bin
Li
*c
aKey Laboratory of Green Process and Engineering, Institute of Process Engineering, Chinese Academy of Sciences, 100190, Beijing, China. E-mail: zhanggj@ipe.ac.cn
bInstitute of Chemistry, Chinese Academy of Sciences, 100190, Beijing, China
cZhengzhou Tobacco Research Institute of CNTC, 450001, Zhengzhou, China. E-mail: lib@ztri.com.cn
dUniversity of Chinese Academy of Sciences, 100039, Beijing, China
eBeijing University of Chemical Technology, 100029, Beijing, China
First published on 22nd February 2016
Abstract
The commercialization of fuel cells and metal–air batteries can only be realized if expensive and scarce platinum-based catalysts are replaced by lower cost, efficient, and durable catalysts for the oxygen reduction reaction (ORR). Along with intensive research efforts in developing low-cost, metal-free catalysts to replace platinum-based catalysts, heteroatom doped graphitic carbon materials (especially graphene and carbon nanotubes) have been demonstrated to show superior ORR performance. However, graphdiyne, another member of the carbon family, has not been completely studied as an electrocatalyst for the ORR. We demonstrate here that nitrogen and fluorine co-doped, metal-free graphdiyne exhibits comparable electrocatalytic activity to commercial Pt/C both in half-cell and full-cell (primary Zn–air battery) tests, regarding its onset potential and limiting current density. Moreover, the new catalyst has better stability, as well as a higher tolerance to methanol crossover and CO poisoning effects, than the commercial Pt/C.
Introduction
Renewable energy devices, mostly fuel cells and rechargeable metal–air batteries, have been rapidly developed as promising large scale electricity storage technologies to meet the ever-increasing energy requirements.1–4 Among the many challenges in the development of such devices, the catalyst for the oxygen reduction reaction (ORR) at the cathode is a major obstacle that limits the real application of these new technologies.5 Traditionally, Pt or Pt-based electrocatalysts are used for tackling the kinetically sluggish ORR. However, the main drawbacks of Pt or Pt-based electrocatalysts, including their high price, intolerance to methanol, and instability in the fuel-cell environment have greatly impeded these energy storage devices in finding reasonable roles in real life.6 Thus more-efficient, cost-effective, and stable catalysts for ORR are badly in need to replace Pt and Pt-based electrocatalysts. Heteroatom (e.g., N-,7–12 B-,13,14 P-,15 S-16,17 and F-18–20) doped graphitic carbon materials have been proven to be a good solution to attain this target.21–28 For instance, several studies have shown that multi-element (N and F,29 N and B,30,31 or N and S32,33) co-doped graphene has surprising catalytic activities for the ORR. The improved electrochemical activities of these metal-free catalysts can be attributed to the charge polarization and spin density, which derives from the difference of electronegativities between carbon and the heteroatoms.34,35Compared with traditional honeycomb carbon materials, such as graphene and carbon nanotubes, graphdiyne (GD) has received more and more attention due to its special structure. In GD, each benzene ring is connected to six adjacent benzene rings through two acetylenic bonds, resulting in a flat 2D structure.36 The presence of carbon–carbon triple bonds in graphdiyne provides the opportunity to introduce atoms to prepare newly proposed 2D carbon compounds.37 In addition, the pore size of GD sheets can be further tuned by replacing the carbon atoms in the linear atomic chains with heteroatoms, which facilitates the adsorption of air into the pores when the sample is exposed to the atmosphere. Recently, N-doped GD (NGD) has been successfully prepared and exhibits enhanced activity toward the ORR.38 However, the activity of NGD is still lower than the commercial Pt/C catalyst, regarding its onset potential and 4-electron selectivity. Further improvement of the activity of GD-based catalysts still remains a challenge.
Herein, dual-heteroatom co-doped GD was successfully prepared and synergistic enhancement of the doping elements X (X = N, S, B, F) was found. The as-prepared N and F co-doped GD (NFGD) showed high selectivity for the four-electron ORR pathway, complete CO and methanol tolerance and promising long-term stability in alkaline medium. Furthermore, when tested in our homemade primary Zn–air battery, NFGD also showed comparable performance with the state-of-the-art Pt/C catalyst. To the best of our knowledge, this is the best experimental evidence of the predicted beneficial “doping effect” in a graphdiyne based ORR electrocatalyst.
Experimental section
Preparation of electrocatalysts
Electrochemical measurements
The electrochemical measurements were carried out on an electrochemical biopotentiostat (CHI 760e, CH Instrument, Shanghai, China) with a typical three electrode system. An Ag/AgCl/KCl electrode (+0.949 V vs. RHE) was used as the reference electrode, a platinum wire as the counter electrode, and a catalyst-modified glassy carbon electrode (GCE) as the working electrode. The working electrodes were prepared by dropping each of the catalyst inks onto a pre-polished GCE. Typically, the catalyst was grinded in ethanol to form the ink, then dispersed into ethanol and sonicated for 30 min (5 mg mL−1). A total of 7.5 μL of the catalyst ink (containing 37.5 μg of catalyst) was loaded onto a GCE (4 mm in diameter), giving a loading density of 0.3 mg cm−2. After the solvent was evaporated, a thin layer of Nafion solution (0.1 wt%) was coated onto the film surface. The prepared electrode was dried at room temperature overnight before the electrochemical tests. For comparison, a GCE coated with Pt/C (20 wt% Pt on Vulcan XC-72, purchased from Alfa Aesar) was also fabricated using the same procedure, and the loading density was 25 μg cm−2.The electrochemical impedance spectra (EIS) were obtained from a ZAHNER ZENNIUM electrochemical workstation (ZAHNER Instrument Inc., Germany) in the presence of a 1 mM K3(Fe(CN)6)/K4(Fe(CN)6) (1![[thin space (1/6-em)]](https://www.rsc.org/images/entities/char_2009.gif) :
:![[thin space (1/6-em)]](https://www.rsc.org/images/entities/char_2009.gif) 1, mol/mol) mixture as a redox probe in 0.1 M KCl aqueous solution. The frequency range was 100
1, mol/mol) mixture as a redox probe in 0.1 M KCl aqueous solution. The frequency range was 100![[thin space (1/6-em)]](https://www.rsc.org/images/entities/char_2009.gif) 000 to 0.01 Hz with a signal amplitude of 5 mV.
000 to 0.01 Hz with a signal amplitude of 5 mV.
For the Zn–air battery test, the air electrode was prepared by a kneading and rolling process. The mass loading was 1 mg cm−2. A homemade Zn–air cell was used in these experiments. Zinc powder was used as the anode electrode, 6 M KOH aqueous solution was used as the electrolyte, and nylon net filters were used as separators. The galvanic discharge curves of the zinc–air cells were recorded at 25 and 50 mA cm−2. For more detailed information, please see the ESI.†
Results and discussion
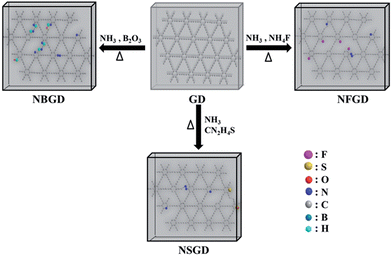
The co-doping of heteroatoms was carried out by heating GD with the given precursor (NH3 for N, NH4F for F, thiourea for S, and B2O3 for B) at a certain temperature (Scheme 1, see details in the Experimental section). For comparison, mono-element (N, F, S and B) doped GDs were also prepared. The as-prepared doped GDs were labelled by the hetero-elements doped in the GD; for example, N and F co-doped GD was labelled as NFGD.Fig. 1 shows typical transmission electron microscopy (TEM) images of GD and the prepared NFGD. TEM images of other prepared doped GDs are also shown in Fig. S1.† The GD reveals a regular laminar morphology, which confirms the 2D layered structure. The field emission scanning electron microscopy (FESEM) image of a cracked GD film shows that the thickness of the GD film is about 1 μm (Fig. S2a†). The X-ray diffraction (XRD) pattern in Fig. S3† displays that the GD is crystalline. After the NH3 and NH4F treatment of GD at high temperature, a porous and spongy feature was generated for NFGD, as shown in Fig. 1b and S2b,† which can be further characterized by high resolution transmission electron microscopy (HRTEM) (Fig. S2c–f†). The powder XRD pattern of NFGD shows no distinguishable peaks, suggesting its amorphous structure. The porosity of NFGD was further characterized by a nitrogen adsorption–desorption experiment, the results of which are shown in Fig. S4.† The results clearly indicate that the average pore size of NFGD is 5.64 nm, which is two times larger than that of GD (2.69 nm). From the energy-dispersive X-ray spectrum (EDS) elemental mapping images (Fig. 1c–g), it can be observed that both N and F are distributed homogeneously in the structural matrix. For the other dual-element (N, S and N, B) co-doped GDs, the mapping images also indicate that the heteroatoms (N, S and B) have been successfully doped in the GD and are evenly distributed in the carbon networks (Fig. S5†).
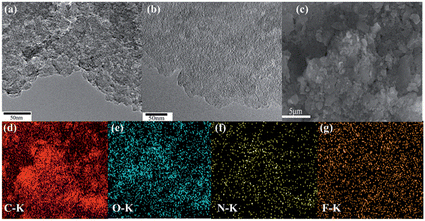 | ||
| Fig. 1 (a) TEM image of GD powders; (b) TEM image of the as prepared NFGD powders; (c) FESEM image of NFGD; (d–g) EDS elemental mapping images of NFGD. | ||
Typical X-ray photoelectron spectra (XPS) of the prepared doped GDs are provided in Fig. 2 and S6.† As shown in Fig. 2a, the GD is only composed of C and O atoms. For NFGD, N 1s and F 1s peaks appeared in the XPS survey. The atomic percentages of N and F in the sample are about 4.45 at% and 0.3% respectively (Table S1†). The XPS C 1s spectrum of NFGD (Fig. 2b) can be deconvoluted into six pronounced peaks centred at 284.3, 285, 285.7, 286.2, 286.7 and 288.8 eV, corresponding to the C 1s orbital of C–C (sp2), C–C (sp), ionic C–F, C![[double bond, length as m-dash]](https://www.rsc.org/images/entities/char_e001.gif) N, C–O and C
N, C–O and C![[double bond, length as m-dash]](https://www.rsc.org/images/entities/char_e001.gif) O, respectively.38,39 The area ratio of sp/sp2 is decreased from 2 for GD to 1.85 for NFGD, indicating a decrease in the content of C–C (sp) after doping. The high resolution XPS N 1s spectrum (Fig. 2c) shows two pronounced peaks centred at 399.3 eV and 397.8 eV, corresponding to imine N (N substitutes the sp-hybridized C atoms) and pyridinic N.40 Compared with NGD, NFGD shows a lower atomic percentage of N. The doped F atoms occupied some sites that would form imine N, leading to relatively fewer N sites. In the F 1s XPS spectrum (Fig. 2d and S6d†), a single peak at around 684.8 eV could be attributed to ionic C–F bonds.39,41 The XPS spectra of other doped GDs also show the peaks of certain corresponding elements, as expected. When B is doped in GD (BGD) under an air atmosphere, C–B and O–B bonds are the main bonding structures (Fig. S6e†). Whereas when B and N are co-doped in GD (NBGD), the B atoms tend to bond with N and O, forming B–N and B–O bonding structures (Fig. S6b†).42 For NSGD, two typical peaks are observed at 164 eV and 165.3 eV that can be assigned to –C–S– bonding, while –SOx– (x = 2, 3, 4) groups, which are chemically inactive in the ORR, are only detected in S doped GD (SGD) (see ESI† for the detailed analysis, Fig. S6c and f†).43,44
O, respectively.38,39 The area ratio of sp/sp2 is decreased from 2 for GD to 1.85 for NFGD, indicating a decrease in the content of C–C (sp) after doping. The high resolution XPS N 1s spectrum (Fig. 2c) shows two pronounced peaks centred at 399.3 eV and 397.8 eV, corresponding to imine N (N substitutes the sp-hybridized C atoms) and pyridinic N.40 Compared with NGD, NFGD shows a lower atomic percentage of N. The doped F atoms occupied some sites that would form imine N, leading to relatively fewer N sites. In the F 1s XPS spectrum (Fig. 2d and S6d†), a single peak at around 684.8 eV could be attributed to ionic C–F bonds.39,41 The XPS spectra of other doped GDs also show the peaks of certain corresponding elements, as expected. When B is doped in GD (BGD) under an air atmosphere, C–B and O–B bonds are the main bonding structures (Fig. S6e†). Whereas when B and N are co-doped in GD (NBGD), the B atoms tend to bond with N and O, forming B–N and B–O bonding structures (Fig. S6b†).42 For NSGD, two typical peaks are observed at 164 eV and 165.3 eV that can be assigned to –C–S– bonding, while –SOx– (x = 2, 3, 4) groups, which are chemically inactive in the ORR, are only detected in S doped GD (SGD) (see ESI† for the detailed analysis, Fig. S6c and f†).43,44
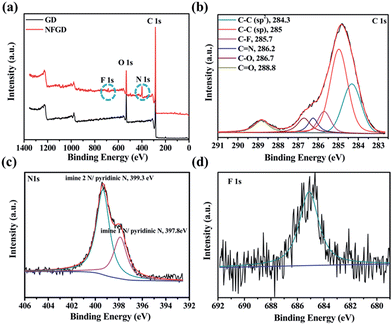 | ||
| Fig. 2 The compositional results of the as prepared catalysts. (a) XPS spectra (survey) of GD and NFGD; (b) XPS C 1s spectrum of NFGD; (c) XPS N 1s spectrum of NFGD; (d) XPS F 1s spectrum of NFGD. | ||
Fig. 3 shows the Raman spectra of the GD-based materials. All the spectra show two prominent peaks attributed to D and G bands.45 The intensity ratio of the D and G bands (ID/IG) is widely used to evaluate the degree of disorder and the average size of the sp2 domains. When a single element was doped in GD, the ID/IG ratio increased from an initial value of 0.74 for GD to 0.90 for NGD, 0.95 for BGD, 0.96 for SGD and 1.0 for FGD (Fig. 3a and Table S2†). When N and X (X = S, B and F) were co-doped in GD, the ID/IG ratio increased further (0.98 for NBGD, 1.13 for NSGD and 1.22 for NFGD) (Fig. 3b). These observations indicate that dual-element co-doping can significantly increase the contents of defects in GD frameworks, which was also confirmed by pore size analysis. The reason for this may be due to the following factors: (i) when the heating temperature is increased to 700 °C, N substitution takes place in the aromatic ring, which significantly increases the structural defects in GD. (ii) S and F are mainly doped at the sites of sp2-hybridized carbon atoms, which leads to the breaking of acetylenic linkages between two hexagons, thus producing larger pores in the carbon matrix.
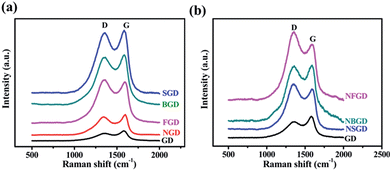 | ||
| Fig. 3 (a) Raman spectra of GD and single element doped GD, (b) N, X (X = S, B, F)-co-doped GD materials. | ||
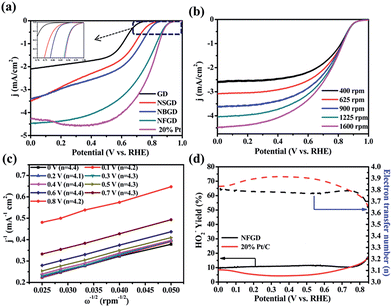
The ORR activities of the catalysts were first tested in a half-cell system in 0.1 M KOH solution. All the cyclic voltammetry (CV) curves (Fig. S7†) exhibit oxygen reduction peaks in O2-saturated electrolyte, indicating that the doped GDs possess electrocatalytic activities toward the ORR in alkaline medium. Specifically, the CV curve of NFGD shows the largest cathodic peak at 0.81 V vs. RHE (see ESI† for RHE calibration), which is much more positive than those of NBGD (0.78 V vs. RHE), NSGD (0.70 V vs. RHE) and other doped-GD materials. The relative values are compiled in Table S3.† The high ORR activity of the NFGD catalyst was further confirmed by rotating disk electrode (RDE) measurements. During the ORR, NFGD exhibited an Eonset of 1.0 V vs. RHE and a disk current (Id) of 4.5 mA cm−2 at 0 V vs. RHE (Fig. 4a). These values are comparable to that of Pt/C (Eonset = 1.0 V, Id = 4.3 mA cm−2 at 0 V vs. RHE). In addition, its ORR activity is much better than that of the mono- or other dual-doped GDs (Fig. S8 and S9†). As far as we know, the Eonset of NFGD is close to that of N, F dual-doped mesoporous graphene, and is comparable to some of the super metal-free catalysts (ESI S10, Table S4†).29Fig. 4b exhibits the LSV curves of NFGD at rotation rates from 400 to 1600 rpm (LSV curves with higher speed are shown in Fig. S11†). The current shows a typical increase with the rotation rate due to the shortened diffusion layer. Fig. 4c features the number of exchanged electrons (n) for the ORR, calculated from the Koutecky–Levich (K–L) plots drawn from the LVS patterns at different rotating speeds (for details, see the ESI†). As calculated, the average electron transfer number of NFGD during the reaction is 4.2 for a wide potential range from 0 V to 0.8 V (vs. RHE), suggesting complete selectivity toward total oxygen reduction. For NBGD and NSGD, n was calculated to be 3.87 and 3.5 from 0 to 0.6 V vs. RHE (Fig. S12†). In addition, the kinetic current density (jk) at 0.6 V vs. RHE of NFGD is also the largest among all the GD based catalysts investigated in this study (Fig. S13†).46
Rotating ring-disk electrode (RRDE) tests were used to monitor the formation of peroxide species and determine the electron transfer number (see ESI† for details). As shown in Fig. 4d, the measured HO2− yield relative to the total reduction products for NFGD is about 10% over the potential range from 0 to 0.85 V vs. RHE. Such a low yield of HO2− during the ORR process is beneficial for hindrance of the degradation of the membrane electrode assemblies, maintaining the cell performance.47–50 The yields correspond to an average electron transfer number of 3.8, which is in agreement with the RDE tests. The numbers of electrons transferred for NSGD and NBGD are also calculated to be 3.5 and 3.75, respectively (Fig. S14†). Thus, our results clearly show that N, F co-doping causes a remarkable synergistic effect, leading to one of the best metal-free electrocatalysts for the ORR.
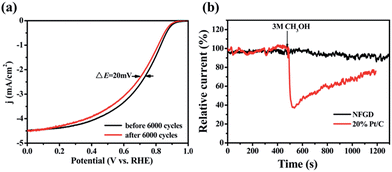
The stability of NFGD was also assessed in O2-saturated 0.1 M KOH electrolyte by cycling the catalyst between −0.05 V and 1.15 V vs. RHE at 200 mV s−1 (Fig. S15a†). After 6000 continuous cycles, the NFGD modified electrode showed a 20 mV negative shift in E1/2, but no negative shift in Eonset and decline in the limiting current density was observed (Fig. 5a). Chronoamperometry was also used to evaluate the stability of NFGD. Continuous oxygen reduction (ca. 10 hours) at 0.6 V (vs. RHE) on the NFGD electrode caused only a slight loss (10%) in current density. In contrast, the corresponding current loss on the Pt/C electrode under the same conditions was as high as about 27% (Fig. S15b†). The stability test results prove that NFGD exhibits a promising long term operational stability. To examine the resistance of NFGD to CO poisoning, pure CO was added to the electrolyte solution (Fig. S16†) at 500 s and was stopped at 800 s. After the addition of CO, the current of NFGD decreased slowly due to the lack of O2, and it recovered after O2 was re-added. However, the Pt/C electrode was rapidly poisoned under the CO atmosphere, and the activity was hardly restored. Finally, the catalysts were exposed to methanol to test its tolerance to the methanol cross-over effect. As shown in Fig. 5b, when 3 M methanol was added to the solution, almost no response specific to methanol was observed for NFGD, but the catalytic activity of Pt/C dropped severely. These promising results strongly suggest that NFGD can work in the presence of methanol for a long time.
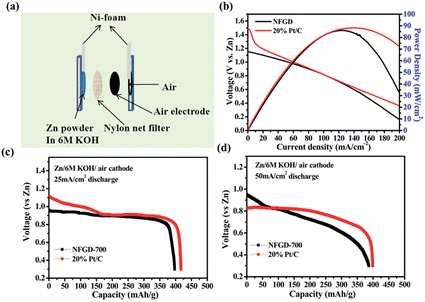
To further characterize the ORR activity of the prepared catalyst, the best catalyst NFGD was tested in a primary homemade Zn–air cell. The schematic and digital photographs of a primary zinc–air battery are shown in Fig. 6a and S17.† The Zn–air battery is composed of an air electrode, a separator and a Zn anode. The air cathode was prepared by mixing the active carbon, poly(tetrafluoroethylene) (PTFE) and the as-prepared catalyst in a certain composition (see Experimental Section and ESI† for details). The air cathode and the Zn anode were separated by a nylon net filter. Cu-sheet and Ni-foam were used as the current collectors for the two electrodes. 6 M KOH was employed in the Zn–air battery because of its high ionic conductivity.
The polarization (with reference to the Zn electrode) curves were obtained under varying current density from 0 to 200 mA cm−2 and the corresponding power density was calculated from the polarization curves. It can be seen that the open circuit voltage of the single-cell with NFGD as the cathode catalyst is ∼1.18 V. This value is close to the performance of a commercial air cathode, although it is ∼0.3 V lower than that with Pt/C (∼1.5 V).51 The difference between NFGD and Pt/C may come from the lower oxygen concentration in 6 M KOH used in our Zn–air cell (10 times lower than that in 0.1 M KOH), which amplifies the difference in ORR activity between NFGD and Pt/C under our RDE experimental conditions (0.1 M KOH). It should be noted that similar current and power densities are observed for the cells with NFGD and Pt/C as cathode. As shown in Fig. 6b, the NFGD catalyst shows a current density of ∼103 mA cm−2 (at 0.8 V) and a peak power density of 86 mW cm−2, which are comparable to those of Pt/C (∼103 mA cm−2 at 0.8 V and 88 mW cm−2). Fig. 6c and d show the typical galvanic discharge curves of a Zn–air battery at 25 and 50 mA cm−2. Those galvanostatic discharge curves clearly reveal that the Zn–air battery performance of NFGD is close to that of Pt/C with the same loading, which is also consistent with the polarization curves. After the Zn–air batteries were discharged for 4 h, no obvious voltage drop and morphology changes were observed (Fig. S18 and S19†) owing to the excellent stability of NFGD for the ORR. As the discharge proceeds, the capacity of the Zn–air cell (normalized to the mass of consumed Zn) decreases with the discharging rate due to the formation of insulating ZnO on Zn particles. The battery eventually ceased functioning when all the Zn particles were completely covered by the ZnO.
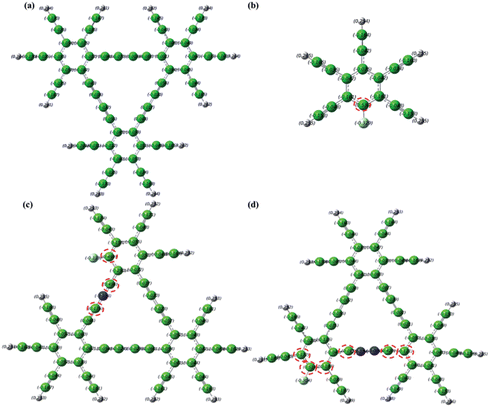
To shed light on the electrocatalytic activity of dopant GD catalysts, quantum mechanical calculations were carried out to obtain the electronic properties of the catalysts using the density functional theory (DFT) method. GD-based materials doped by heteroatoms at different relative positions have been constructed for computational simulation as illustrated in Fig. S21–S26 and Table S5 (see ESI† for the molecular models and computational details). It is known that the carbon atoms with positive charge densities larger than 0.15 are most likely to serve as catalytic active sites.52,53 Thus, the number of atoms with a large charge density could serve as a barometer to evaluate the activity of a specific molecular structure.54,55 As shown in Fig. 7a, with inactive C atoms with negative charge density throughout the whole C matrix, pure GD may not be an efficient catalyst for the ORR. When GD is doped solely by more electronegative N or F atoms, the C atoms adjacent to the N or F dopants have a higher positive charge density (0.4 or 0.162 for C atoms adjacent to N,38 0.53 for C atoms adjacent to F in Fig. 7b). The positively charged carbon atoms facilitate electron movement from the anode to promote the ORR. When F and N are simultaneously incorporated into the GD matrix to form NFGD, those carbon atoms neighboring to the doped N and F atoms can also be activated to have a positive charge density (see red circles in Fig. 7c and d). This will increase the number of active sites in the electrocatalyst significantly, thereby enhancing the ORR catalytic activity.52 Simulations performed for other doped GD-based materials also show that the charge densities are increased after dual doping, indicating a higher ORR catalytic performance (Fig. S27–S30†). What's more, the rich defects, larger pore sizes and more imine N target sites in the NFGD framework are also beneficial for the ORR. In addition, our AC impedance measurements confirmed that the pyrolysis and doping process are able to improve the conductivity of NFGD (Fig. S20†), thus the electrons can be smoothly transferred from the active sites to the current collectors. All these features can well explain the significant enhancement of the ORR catalytic activities, such as the more positive onset potential and higher kinetic current on NFGD.
Conclusions
In summary, a novel kind of highly efficient metal-free electrocatalyst for ORR has been developed successfully by doping heteroatoms in graphdiyne. In particular, the as-prepared NFGD exhibits comparable performance to commercial Pt/C both in half-cell and full-cell configurations (Zn–air battery), regarding its onset potential and limiting current density. It shows a much better stability as well as a higher tolerance to methanol crossover and CO poisoning effects than the commercial Pt/C. Our results show that these doped GDs have great potential for metal-free catalysts to be used as low-cost, efficient, and durable ORR catalysts.Acknowledgements
The authors acknowledge the support from the National Natural Science Foundation of China (No. 21371173, 51402298, 91545125) and China Postdoctoral Foundation (No. 2014M550846). The authors thank Dr Bineta Keita for help with revising the manuscript.Notes and references
- J. B. Goodenough, Acc. Chem. Res., 2012, 46, 1053 CrossRef PubMed.
- F. Cheng and J. Chen, Chem. Soc. Rev., 2012, 41, 2172 RSC.
- M. A. Rahman, X. Wang and C. Wen, J. Electrochem. Soc., 2013, 160, A1759 CrossRef CAS.
- S. Hameer and J. L. van Niekerk, Int. J. Energy Res., 2015, 39, 1179 CrossRef.
- J. Christensen, P. Albertus, R. S. Sanchez-Carrera, T. Lohmann, B. Kozinsky, R. Liedtke, J. Ahmed and A. Kojic, J. Electrochem. Soc., 2011, 159, R1 CrossRef.
- B. C. H. Steele and A. Heinzel, Nature, 2001, 414, 345 CrossRef CAS PubMed.
- K. Gong, F. Du, Z. Xia, M. Durstock and L. Dai, Science, 2009, 323, 760 CrossRef CAS PubMed.
- H. W. Liang, X. Zhuang, S. Brüller, X. Feng and K. Müllen, Nat. Commun., 2014, 5, 4973 CrossRef CAS PubMed.
- Y. J. Sa, C. Park, H. Y. Jeong, S. H. Park, Z. Lee, K. T. Kim, G. G. Park and S. H. Joo, Angew. Chem., Int. Ed., 2014, 53, 4102 CrossRef CAS PubMed.
- W. Wei, H. Liang, K. Parvez, X. Zhuang, X. Feng and K. Müllen, Angew. Chem., Int. Ed., 2014, 53, 1570 CrossRef CAS PubMed.
- W. Yang, T.-P. Fellinger and M. Antonietti, J. Am. Chem. Soc., 2011, 133, 206 CrossRef CAS PubMed.
- Y. Zheng, Y. Jiao, J. Chen, J. Liu, J. Liang, A. Du, W. Zhang, Z. Zhu, S. C. Smith, M. Jaroniec, G. Q. Lu and S. Z. Qiao, J. Am. Chem. Soc., 2011, 133, 20116 CrossRef CAS PubMed.
- L. Yang, S. Jiang, Y. Zhao, L. Zhu, S. Chen, X. Wang, Q. Wu, J. Ma, Y. Ma and A. Hu, Angew. Chem., Int. Ed., 2011, 50, 7132 CrossRef CAS PubMed.
- S. Wang, E. Iyyamperumal, A. Roy, Y. Xue, D. Yu and L. Dai, Angew. Chem., Int. Ed., 2011, 50, 11756 CrossRef CAS PubMed.
- J. Wu, C. Jin, Z. Yang, J. Tian and R. Yang, Carbon, 2015, 82, 562 CrossRef CAS.
- W. Kicinski, M. Szala and M. Bystrzejewski, Carbon, 2014, 68, 1 CrossRef CAS.
- D. C. Higgins, M. A. Hoque, F. Hassan, J.-Y. Choi, B. Kim and Z. W. Chen, ACS Catal., 2014, 4, 2734 CrossRef CAS.
- X. Sun, P. Song, T. Chen, J. Liu and W. Xu, Chem. Commun., 2013, 49, 10296 RSC.
- X. Sun, Y. Zhang, P. Song, J. Pan, L. Zhuang, W. Xu and W. Xing, ACS Catal., 2013, 3, 1726 CrossRef CAS.
- L. Hao, S. Zhang, R. Liu, J. Ning, G. Zhang and L. Zhi, Adv. Mater., 2015, 27, 3190 CrossRef CAS PubMed.
- Y. Li and H. Dai, Chem. Soc. Rev., 2014, 43, 5257 RSC.
- R. Cao, J.-S. Lee, M. Liu and J. Cho, Adv. Energy Mater., 2012, 2, 816 CrossRef CAS.
- L. Dai, Y. Xue, L. Qu, H.-J. Choi and J.-B. Baek, Chem. Rev., 2015, 115, 4823 CrossRef CAS PubMed.
- Y. Liang, Y. Li, H. Wang and H. Dai, J. Am. Chem. Soc., 2013, 135, 2013 CrossRef CAS PubMed.
- Y. Zheng, Y. Jiao, M. Jaroniec, Y. Jin and S. Z. Qiao, Small, 2012, 8, 3550 CrossRef CAS PubMed.
- J. Liu, P. Song, Z. Ning and W. Xu, Electrocatalysis, 2015, 6, 132 CrossRef CAS.
- B. Xia, Y. Yan, X. Wang and X. W. Lou, Mater. Horiz., 2014, 1, 379 RSC.
- B. Y. Xia, Y. Yan, N. Li, H. B. Wu, X. W. Lou and X. Wang, Nature Energy, 2016, 1, 15006 CrossRef CAS.
- S. Jiang, Y. Sun, H. Dai, J. Hu, P. Ni, Y. Wang, Z. Li and Z. Li, Nanoscale, 2015, 7, 10584 RSC.
- Y. Zheng, Y. Jiao, L. Ge, M. Jaroniec and S. Z. Qiao, Angew. Chem., 2013, 125, 3192 CrossRef.
- X. Xu, T. Yuan, Y. Zhou, Y. Li, J. Lu, X. Tian, D. Wang and J. Wang, Int. J. Hydrogen Energy, 2014, 39, 16043 CrossRef CAS.
- X. Wang, J. Wang, D. Wang, S. Dou, Z. Ma, J. Wu, L. Tao, A. Shen, C. Ouyang and Q. Liu, Chem. Commun., 2014, 50, 4839 RSC.
- F. Razmjooei, K. P. Singh, M. Y. Song and J. S. Yu, Carbon, 2014, 78, 257 CrossRef CAS.
- C. Z. Zhu and S. J. Dong, Nanoscale, 2013, 5, 1753 RSC.
- J. Masa, W. Xia, M. Muhler and W. Schuhmann, Angew. Chem., Int. Ed., 2015, 54, 10102 CrossRef CAS PubMed.
- G. Li, Y. Li, H. Liu, Y. Guo, Y. Li and D. Zhu, Chem. Commun., 2010, 46, 3256 RSC.
- Y. Li, L. Xu, H. Liu and Y. Li, Chem. Soc. Rev., 2014, 43, 2572 RSC.
- R. Liu, H. Liu, Y. Li, Y. Yi, X. Shang, S. Zhang, X. Yu, S. Zhang, H. Cao and G. Zhang, Nanoscale, 2014, 6, 11336 RSC.
- W. H. Lee, J. W. Suk, H. Chou, J. Lee, Y. Hao, Y. Wu, R. Piner, D. Akinwande, K. S. Kim and R. S. Ruoff, Nano Lett., 2012, 12, 2374 CrossRef CAS PubMed.
- P. Nowicki, R. Pietrzak and H. Wachowska, Energy Fuels, 2010, 24, 1197 CrossRef CAS.
- X. Sun, P. Song, Y. Zhang, C. Liu, W. Xu and W. Xing, Sci. Rep., 2013, 3, 2505 CrossRef PubMed.
- J. Jin, F. Pan, L. Jiang, X. Fu, A. Liang, Z. Wei, J. Zhang and G. Sun, ACS Nano, 2014, 8, 3313 CrossRef CAS PubMed.
- X. Duan, K. O'Donnell, H. Sun, Y. Wang and S. Wang, Small, 2015, 11, 3036 CrossRef CAS PubMed.
- G. Hasegawa, T. Deguchi, K. Kanamori, Y. Kobayashi, H. Kageyama, T. Abe and K. Nakanishi, Chem. Mater., 2015, 27, 4703 CrossRef CAS.
- A. C. Ferrari, J. C. Meyer, V. Scardaci, C. Casiraghi, M. Lazzeri, F. Mauri, S. Piscanec, D. Jiang, K. S. Novoselov, S. Roth and A. K. Geim, Phys. Rev. Lett., 2006, 97, 187401 CrossRef CAS PubMed.
- H. W. Liang, X. Zhuang, S. Brüller, X. Feng and K. Müllen, Nat. Commun., 2014, 5, 4973 CrossRef CAS PubMed.
- H. R. Byon, J. Suntivich and Y. Shao-Horn, Chem. Mater., 2011, 23, 3421 CrossRef CAS.
- M. Lefèvre and J.-P. Dodelet, Electrochim. Acta, 2003, 48, 2749 CrossRef.
- F. Bidault, D. J. L. Brett, P. H. Middleton and N. P. Brandon, J. Power Sources, 2009, 187, 39 CrossRef CAS.
- A. A. Gewirth and M. S. Thorum, Inorg. Chem., 2010, 49, 3557 CrossRef CAS PubMed.
- J.-S. Lee, T. Lee, H.-K. Song, J. Cho and B.-S. Kim, Energy Environ. Sci., 2011, 4, 4148 Search PubMed.
- L. Zhang and Z. Xia, J. Phys. Chem. C, 2011, 115, 11170 CrossRef CAS.
- S. Wang, L. Zhang, Z. Xia, A. Roy, D. W. Chang, J. B. Baek and L. Dai, Angew. Chem., Int. Ed., 2012, 51, 4209 CrossRef CAS PubMed.
- J. Liang, Y. Jiao, M. Jaroniec and S. Z. Qiao, Angew. Chem., Int. Ed., 2012, 124, 11664 CrossRef.
- P. Wu, P. Du, H. Zhang and C. Cai, J. Phys. Chem. C, 2012, 116, 20472 CrossRef CAS.
Footnote |
| † Electronic supplementary information (ESI) available: Electrochemical test details; characterizations; TEM images of GD and element doped GD; FESEM images and EDS elemental mapping images of doped-GD; XPS spectra of GD-based materials; CV curves and LSV curves; RRDE results; 6000 cycles CV stability test; photograph of primary Zn–air battery; Nyquist plots; tables. See DOI: 10.1039/c5ta10579j |
| This journal is © The Royal Society of Chemistry 2016 |

