
 Open Access Article
 This Open Access Article is licensed under a
 Creative Commons Attribution 3.0 Unported Licence
TiNb2O7/graphene composites as high-rate anode materials for lithium/sodium ion batteries†
Shuang
Li
ab,
Xi
Cao
b,
Charles N.
Schmidt
b,
Qian
Xu
c,
Evan
Uchaker
b,
Yi
Pei
b and
Guozhong
Cao
*b
aSchool of Materials Science and Metallurgy, Northeastern University, Shenyang 110819, PR China
bDepartment of Materials Science and Engineering, University of Washington, Seattle, Washington 98195, USA. E-mail: gzcao@u.washington.edu
cState Key Laboratory of Advanced Special Steel, Shanghai University, Shanghai 200072, PR China
First published on 15th February 2016
Abstract
Layered TiNb2O7/graphene composites (TNO/G) were synthesized through simple direct dispersion and blending in an aqueous solvent followed by a freeze drying process and an annealing treatment under Ar. The graphene sheets are well separated by TiNb2O7 (TNO) nanoparticles, and simultaneously, the TNO particles are uniformly anchored between the graphene sheets. The combined advantages of graphene sheets and TNO, such as the weight ratio and layered structure, exhibit tremendous benefits for high rate Li ion capability reaching around 180 mA h g−1 at a current density of 38.7 A g−1 (100C rate). Through the synergistic effects of their combination the total specific capacity of TNO/G is higher than the sum of the specific capacity of pure TNO and graphene in their relative ratios. For the study of Na ion capability, as graphene is an active material during the de-sodiation process, a reversible capacity of 340.2 mA h g−1 was obtained from this TNO/G at a current density of 25 mA g−1. Even at a higher current density of 200 mA g−1, a stable capacity of 200 mA h g−1 can still be obtained. These findings demonstrate the great potential of TNO/G for lithium/sodium ion anodes.
1. Introduction
The tremendous consumption and increasing depletion of fossil fuel resources by traditional energy production, as well as the increased pollution they have caused, highlight the urgent demand for renewable energy.1–4 Lithium-ion batteries (LIBs), as rechargeable devices for chemically storing energy, possess advantages of high conversion efficiency, high energy density, long life and low environmental impact.5–7 Graphite is widely employed as a commercial anode material for LIBs, which stores Li+ through an intercalation process to form LiC6 with a flat voltage, V ≈ 0.2 V (vs. Li/Li+). However, a LiC6 charged anode forms a passivating solid–electrolyte interphase (SEI) layer that consumes Li+ from the cathode. The SEI layer prevents uniform plating out of Li during charge, however on repeated fast discharge/charge cycling it is still possible for dendrites forming on the anode to penetrate the separator and short-circuit the cell creating a severe fire hazard.8,9 Compared to commercial graphite anodes, Li4Ti5O12 (LTO) exhibits a relatively high lithium insertion/extraction potential of approximately 1.55 V (vs. Li/Li+), which circumvents the potential range where SEI formation occurs for standard electrolyte solutions (<1.0 V) and suppresses lithium dendrite deposition on the surface of the anode.10 However, the low storage capacity of LTO (175 mA h g−1 in theory) has prevented its widespread use.11–13Recently, TiNb2O7 (TNO) with a similar operating voltage (∼1.6 V vs. Li/Li+) to LTO which would avoid SEI formation has attracted much attention as a promising anode material due to its high theoretical capacity of 387 mA h g−1, nearly twice that of LTO involving 5 electron transfer in the process: Ti4+/Ti3+, Nb5+/Nb4+ and Nb4+/Nb3+.14 To achieve practical application, research is needed to overcome the hurdles of TNO including poor rate capability resulting from its low electronic conductivity and poor ionic diffusivity.15 Properly designed and fabricated TNO nanostructures have demonstrated improved lithium ion intercalation properties; examples include nanoparticles,16 microspheres,9 nanofibers17 and highly porous materials, all exhibiting improved electrochemical performance compared to their bulk counterparts.18 The report by Han et al. revealed that carbon coating and partial doping of Nb for Ti can enhance the conductivity of the electrode material.8 Song et al. demonstrated that doping with Mo could enhance the rate capability of TNO from 110 mA h g−1 to 190 mA h g−1 at 10C.15 Park et al. fabricated porous TNO microspheres by partial nitridation, increasing the capacity from around 150 mA h g−1 to 200 mA h g−1 at 5C while also improving rate performance.19 Jo et al. synthesized mesoporous TNO with small-sized nanocrystals, which exhibited a high reversible capacity of 289 mA h g−1 and a rate performance of around 120 mA h g−1 at 50C.20 Evidently, previous researchers have indicated that the composite structure based on TNO is highly promising as a safe and high-performance anode for LIBs. However, low electronic conductivity and capacity degradation when subjected to high rate cycling remain a challenge.
Graphene has been a topic of hot pursuit in the field of materials science and is widely researched for potential application in lithium/sodium ion batteries because of its unique electrochemical properties, such as superior electronic conductivity, high specific surface area (over 2600 m2 g−1), and excellent mechanical flexibility.21–23 In an effort to overcome the energy-storage limitation and poor cycling behavior of bare graphene negative electrodes, several composites have recently been developed.24 The optimization of the microstructure and weight ratio between the composite components is a key issue to achieve good electrochemical performance and extended cycle life.25
Due to the wide availability and low cost of sodium, ambient temperature sodium-ion batteries are considered to be a promising alternative to common lithium-ion batteries.26–29 For anode materials, graphite, the most commonly used anode in lithium systems, does not intercalate sodium to any appreciable extent.30 Moreover, the accommodation of sodium in traditional host materials is difficult because the ionic radius and reduction potential of sodium are strikingly larger than those of lithium.31,32 Therefore, the de/sodiation process induces a large distortion in the layered structure that ultimately leads to pulverization of the electrode and the impending failure of the cell.33 Alloy-based materials and metal sulfides have been proved to be promising anode electrodes owing to their high theoretical capacities. However, the main challenge is to overcome the enormous volume expansion. In order to reduce the negative effect of volume change, research associated with specific structures of Sn@carbon and SnS2/graphene has been investigated by Liu et al.34–36 As a non-carbonaceous Na intercalation type anode, TiO2 has been examined in the form of amorphous nanowires. These electrodes achieved a reversible capacity of 150 mA h g−1 after several cycles.37 Anatase TiO2 nanoparticles have been studied as anodes for high power sodium-ion batteries in another report offering specific capacities of around 100 and 86 mA h g−1 at 5.5C and 11C, respectively.38 With similar de/lithiation properties to TiO2, TNO requires further studies focusing on its de/sodiation process.
Here, we report a simple method for directly dispersing and blending nano-sized TNO materials with graphene oxide in an aqueous solvent followed by a freeze drying process and an annealing treatment under Ar. The weight ratio of TNO to graphene was 60![[thin space (1/6-em)]](https://www.rsc.org/images/entities/char_2009.gif) :40. Unlike other compact or fixed-structures, the TNO/graphene (TNO/G) synthesized in this investigation has a flexible structure, and the graphene coating facilitates electronic transportation to interconnect the TNO particles. The combination of the two components in tandem with the inherent structure and weight ratio significantly improves the high rate capability – reaching around 180 mA h g−1 at a current density of 38.7 A g−1 (100C rate). We further investigated the electrochemical properties of sodium de/intercalation in TNO/G composites anticipating that the combination with layered graphene could alleviate the volume change or pulverization of the material. When applied as an anode material for Na-ion batteries the TNO/G composite exhibits a relevant high initial discharge capacity, reaching 527.3 mA h g−1 and a reversible capacity of 340.2 mA h g−1 at a current density of 25 mA g−1. Its good rate and stable cycling performance indicate that the TNO/G composite is a promising anode for Na-ion batteries.
:40. Unlike other compact or fixed-structures, the TNO/graphene (TNO/G) synthesized in this investigation has a flexible structure, and the graphene coating facilitates electronic transportation to interconnect the TNO particles. The combination of the two components in tandem with the inherent structure and weight ratio significantly improves the high rate capability – reaching around 180 mA h g−1 at a current density of 38.7 A g−1 (100C rate). We further investigated the electrochemical properties of sodium de/intercalation in TNO/G composites anticipating that the combination with layered graphene could alleviate the volume change or pulverization of the material. When applied as an anode material for Na-ion batteries the TNO/G composite exhibits a relevant high initial discharge capacity, reaching 527.3 mA h g−1 and a reversible capacity of 340.2 mA h g−1 at a current density of 25 mA g−1. Its good rate and stable cycling performance indicate that the TNO/G composite is a promising anode for Na-ion batteries.
2. Results and discussion
2.1. Synthesis of TNO/G
For the fabrication of the TNO/G composite, two major steps are involved. The first step is the synthesis of TNO nanoparticles where niobium ethoxide (Nb(OC2H5)5) and titanium isopropoxide (C12H28O4Ti) are utilized as the niobium and titanium precursors, respectively (detailed experimental procedures are described in the Experimental section). As shown in Fig. 1, the second step is the facile fabrication process of TNO/G. For this step, a homogeneous aqueous suspension of graphene oxide (GO) and TNO nanoparticles was freeze-dried and subsequently thermally reduced in an argon atmosphere at 500 °C for 2 h. Reduced graphene usually suffers from serious agglomeration and re-stacking after removal of suspension solvents due to the van der Waals interactions between adjacent sheets, which would reduce its effective surface area and electrochemical properties.25 Adopting the freeze-drying method would prevent the original nano- or micro-structure from collapsing during the removal of the solvent, retaining the uniform distribution of graphene and TNO nanoparticles as in the aqueous suspension. After this treatment, a porous product with well separated graphene sheets could be obtained; moreover, TNO nanoparticles supported on both sides of graphene can serve as a nanospacer to separate the adjacent graphene sheets, consequently overcoming the agglomeration issue and increasing the available surface area resulting in a high electrochemical activity.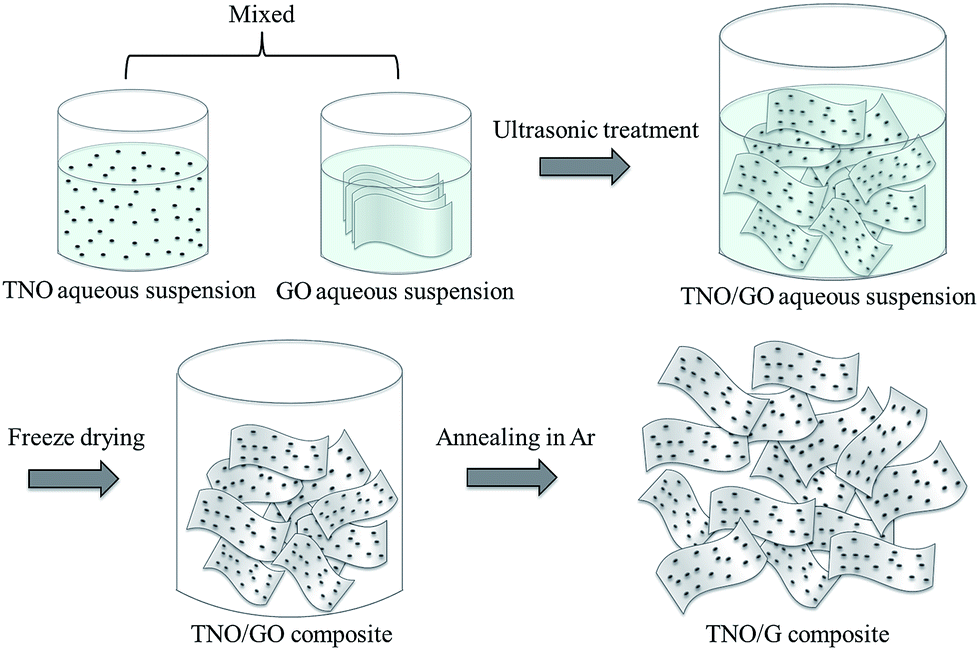 | ||
| Fig. 1 Schematic depicting the formation of the TNO/G composite. | ||
2.2. Physicochemical properties of TNO/G
The X-ray diffraction (XRD) patterns in Fig. 2a demonstrate that all the diffraction peaks of TNO/G composites can be indexed to the pure monoclinic TiNb2O7 phase (space group: I2/m, JCPDS#: 39-1407). No obvious secondary phase peaks were detected such as Nb2O5, TiO2, or any other niobium and/or titanium oxides. The characteristic peak (001) of GO located at 10.05° was not detected in the TNO/G results, implying that the GO was well reduced through the annealing process and turned into graphene. Thermogravimetric analysis (TGA) was carried out in flowing air from 80 °C to 800 °C at a heating rate of 10 °C min−1 and the TGA curve of the TNO/G is shown in Fig. 2b. From this result, the weight ratio of the TNO nanoparticles to the graphene nanosheets was determined to be around 60:40 which matches with the original weight ratio. The 40 wt% weight loss occurred mainly from 420 °C to 520 °C, featuring an endothermic peak at 510 °C, corresponding to the oxidation of carbon.39
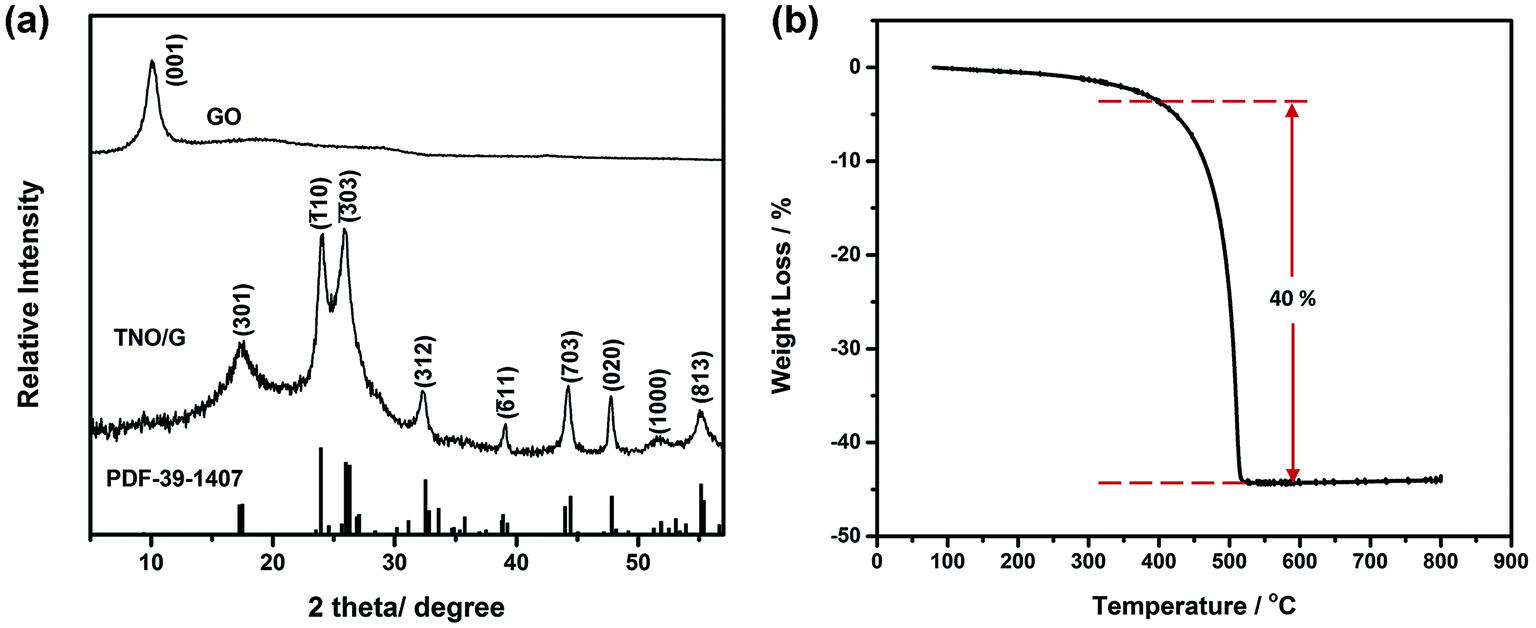 | ||
| Fig. 2 (a) XRD patterns of TNO/G composites and GO. The vertical lines at the bottom correspond to the standard XRD reflections of monoclinic TiNb2O7. (b) TGA curve of TNO/G from 80 °C to 800 °C in air at a rate of 10 °C min−1. | ||
Scanning electron microscopy (SEM) and transmission electron microscopy (TEM) were carried out to investigate the microstructure and morphology of the as-synthesized samples. Fig. 3a and b display the SEM images of TNO/G composites obtained after being annealed under an Ar atmosphere at 500 °C for 2 h. Fig. 3a displays an image of a large visual field, and shows the overall structure of the hierarchical nano-architectures of the TNO/G composite. The uniform distribution of TNO nanoparticles is beneficial to prevent the TNO nanocrystals from agglomerating, and enables good dispersion of TNO particles over the graphene support which are less affected by capacity fading during cycling.25 From Fig. 3b, it can be clearly seen that the prepared TNO/G has a large-area homogeneous layer structure which consists of disordered TNO nanoparticles and curled graphene nanosheets. The graphene sheets are well separated and TNO nanoparticles are supported on both sides of graphene as a spacer. Fig. 3c and d show the typical TEM images of TNO/G composites. The dark small uniaxial particles are TNO nanoparticles with a size around 20–50 nm in diameter. The grey strips embedded by TNO nanoparticles represent the thin graphene sheets. More detailed structural information can be found from the HRTEM image in Fig. 3d where the lattice fringes of TNO nanoparticles can be clearly observed, suggesting the presence of a well-defined crystal structure. The periodic lattice fringe spaces were found to be 0.37 nm corresponding to the interplanar spacing of (−110) planes of monoclinic TiNb2O7 (JCPDS#: 39-1407) which further corroborate the findings from XRD results.
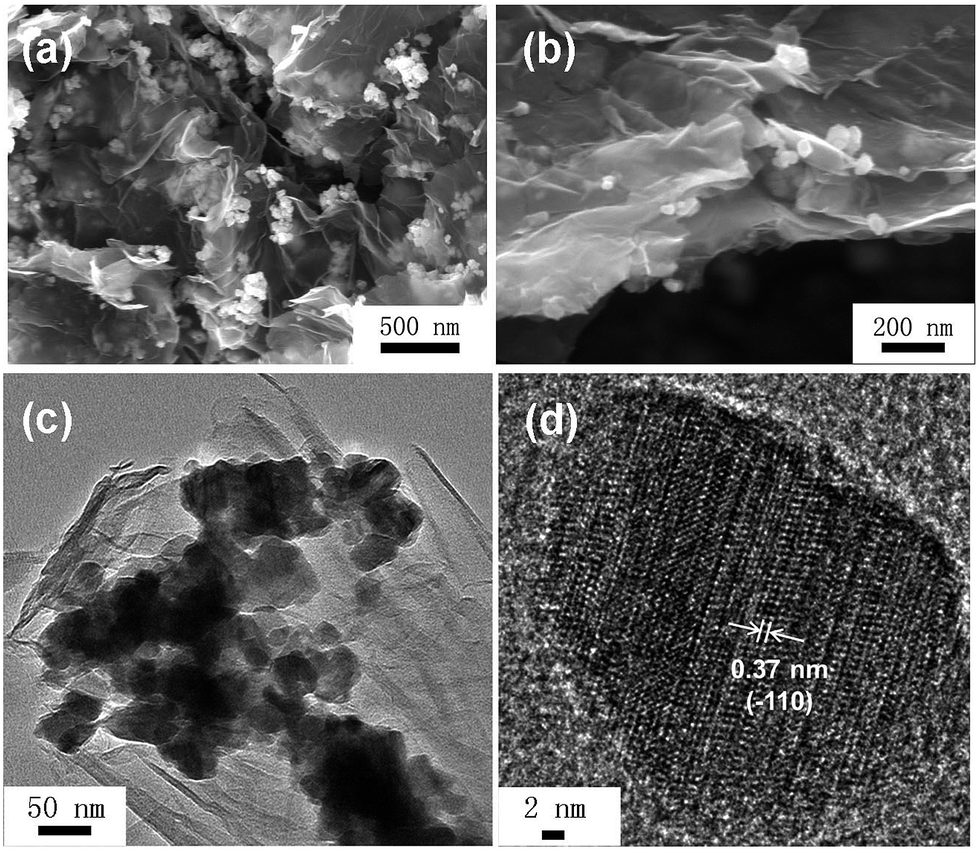 | ||
| Fig. 3 (a) Low and (b) high magnification SEM images of TNO/G composites; (c) TEM image and (d) HRTEM image of the TNO/G composites. | ||
2.3. Electrochemical performance
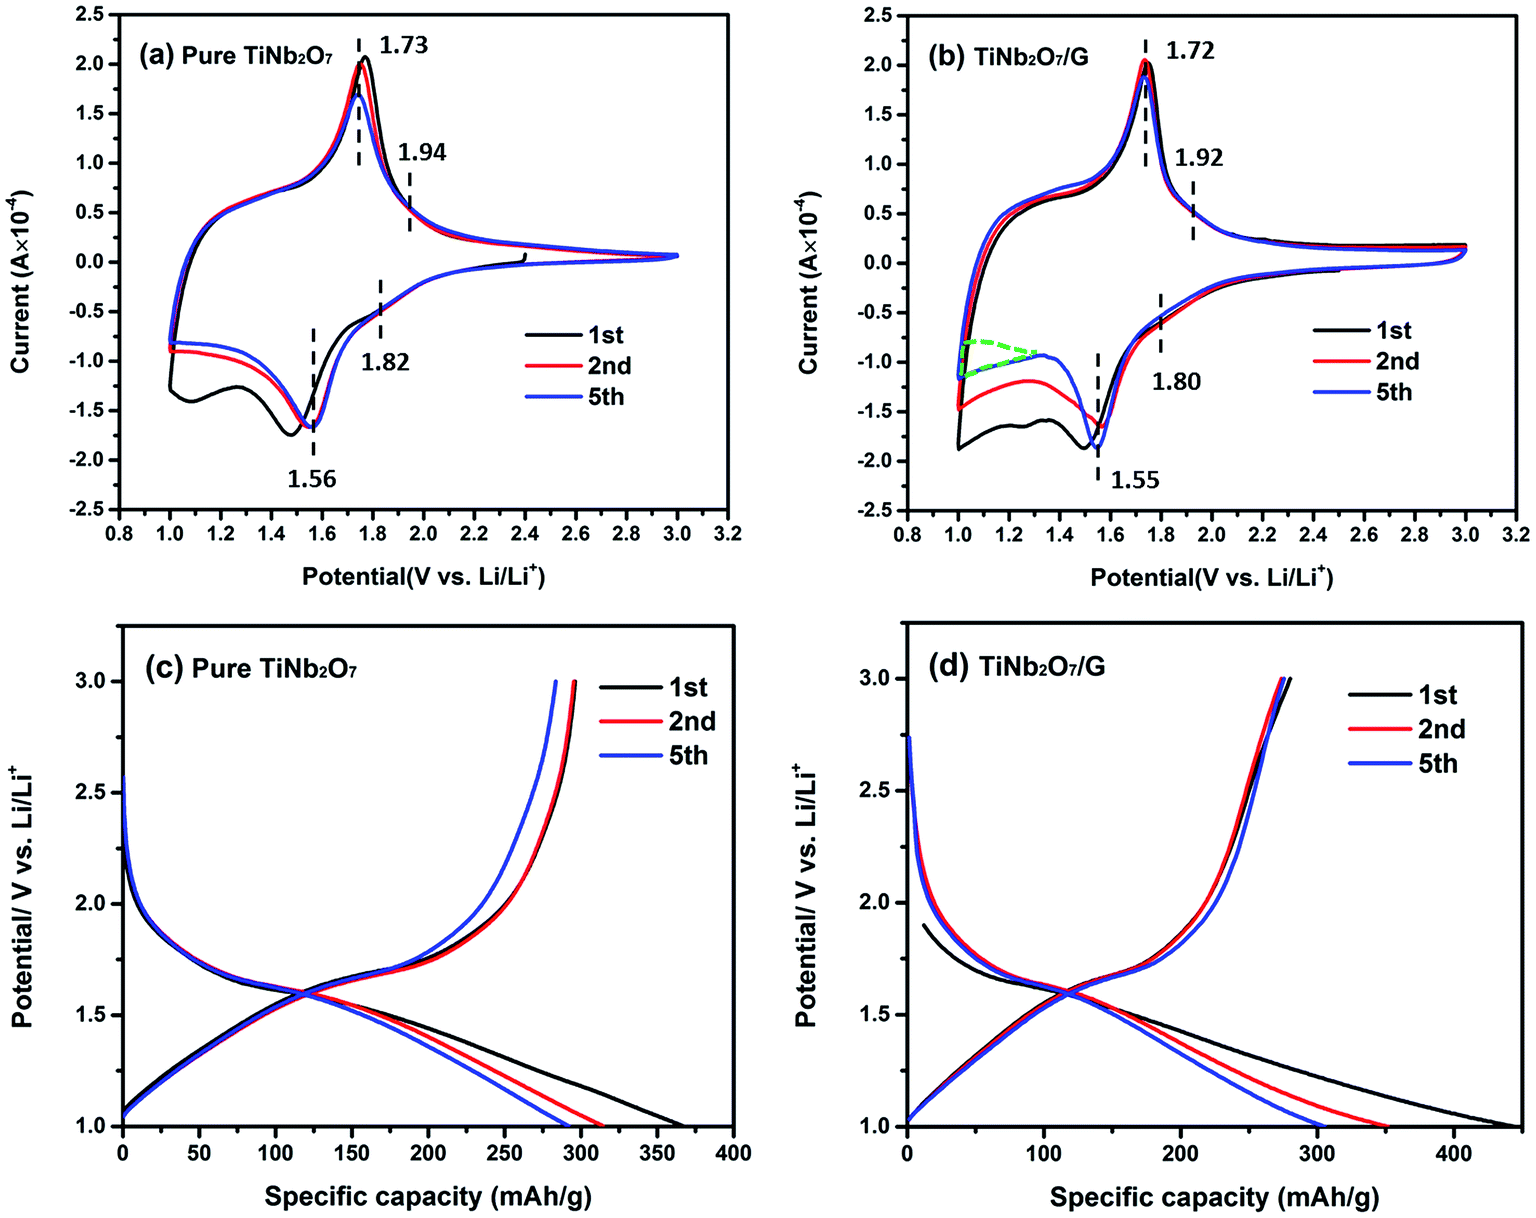 | ||
| Fig. 4 CV curves of (a) pure TNO and (b) TNO/G composite at 0.2 mV s−1; discharge–charge profiles of (c) pure TNO and (d) TNO/G composite at a current rate of 0.1C (1C = 387 mA g−1). | ||
Comparing the shape of these two figures, an extra sub-triangular area in the voltage range of 1.0–1.4 V can be found in the CV curves of TNO/G which is different from the shape of pure TNO. From the discharge–charge profiles of pure graphene electrodes in Fig. S2b of the ESI,† as most part of the discharge capacity was accomplished below the voltage of 1.4 V, it can be deduced that the difference is likely attributed to the Li-ion insertion/extraction reaction of pure graphene in TNO/G composites at a voltage of around 1.0 V.43
The main pair of redox peaks of TNO/G composites, referring to the valence variation of Nb5+/Nb4+, showed better repeatability than pure TNO, and it is also noticed that the separation of the pair of redox peaks in the voltage range of 1.0–1.4 V showed an appreciable reduction, implying that some possible activation process is involved: probably a better contact, layer re-stacking or removal of adsorbed surface contamination, which is most likely associated with the irreversible feature observed in the CV curve of pure graphene for the first several cycles shown in Fig. S2a.† A similar phenomenon is also observed in the other graphene-based hybrids.44,45 The reduction peak shifts from 1.50 V to 1.56 V, after the first cycle, probably resulting from the change of the electronic structure and surface energy.46
Fig. 4c and d display the discharge–charge profiles of pure TNO and TNO/G composites for the first, second and fifth cycles at a current rate of 0.1C in the voltage range of 1.0–3.0 V. These discharge–charge profiles match well with the shape of CV curves in Fig. 4a and b. As shown in Fig. 4c, pure TNO exhibited a downward concave curve at the end of the discharge curves while the shape of the TNO/G composite is upward concave which agrees well with the extra subtriangular area in CV curves previously mentioned. The poor repeatability of the fifth anodic peak in pure TNO is also clearly shown in the discharge–charge profiles (Fig. 4c) and has been improved in the TNO/G composite (Fig. 4d). Comparing discharge–charge profiles of the TNO/G electrode and the pure TNO electrode in the first cycle, the TNO/G electrode showed relatively low initial charge/discharge efficiency which is likely associated with a high surface area of 643.3 m2 g−1 derived by Brunauer–Emmett–Teller (BET). Besides, more active intercalation sites may exist in the reduced graphene from possible residual functional groups, such as C–O, C![[double bond, length as m-dash]](https://www.rsc.org/images/entities/char_e001.gif) O, and O–CO,21,47 which tend to participate in some types of lithium intercalation leading to irreversible capacity and low initial efficiency.48 The evidence of possible residual functional groups was also found and discussed in the discussion part of EIS results.
O, and O–CO,21,47 which tend to participate in some types of lithium intercalation leading to irreversible capacity and low initial efficiency.48 The evidence of possible residual functional groups was also found and discussed in the discussion part of EIS results.
The rate performances of TNO and TNO/G at various discharge–charge rates are presented in Fig. 5a. Generally, the TNO/G composite shows much improved rate performance with discharge capacities of 172, 156 and 136 mA h g−1 at rates of 2C, 4C and 8C, respectively, while the capacity values of pure TNO in our work are 136, 90 and 52 mA h g−1. What's more, when the current rate is reversed back to 0.5C after different rate testing, it clearly showed that the discharge capacity of TNO/G is more stable than that of TNO. It is worth noting that TNO/G composites possessed lower capacity than pure TNO at a rate of 0.5C. This can be attributed to the weight ratio of the TNO and graphene. Graphene (capacity near 60 mA h g−1 at a rate of 0.5C) should decrease the overall capacity because of the relative disparity in capacity between graphene and pure TNO at 0.5C. However, as is shown, when the rate is above 1C, the capacity of TNO/G overtook that of TNO.
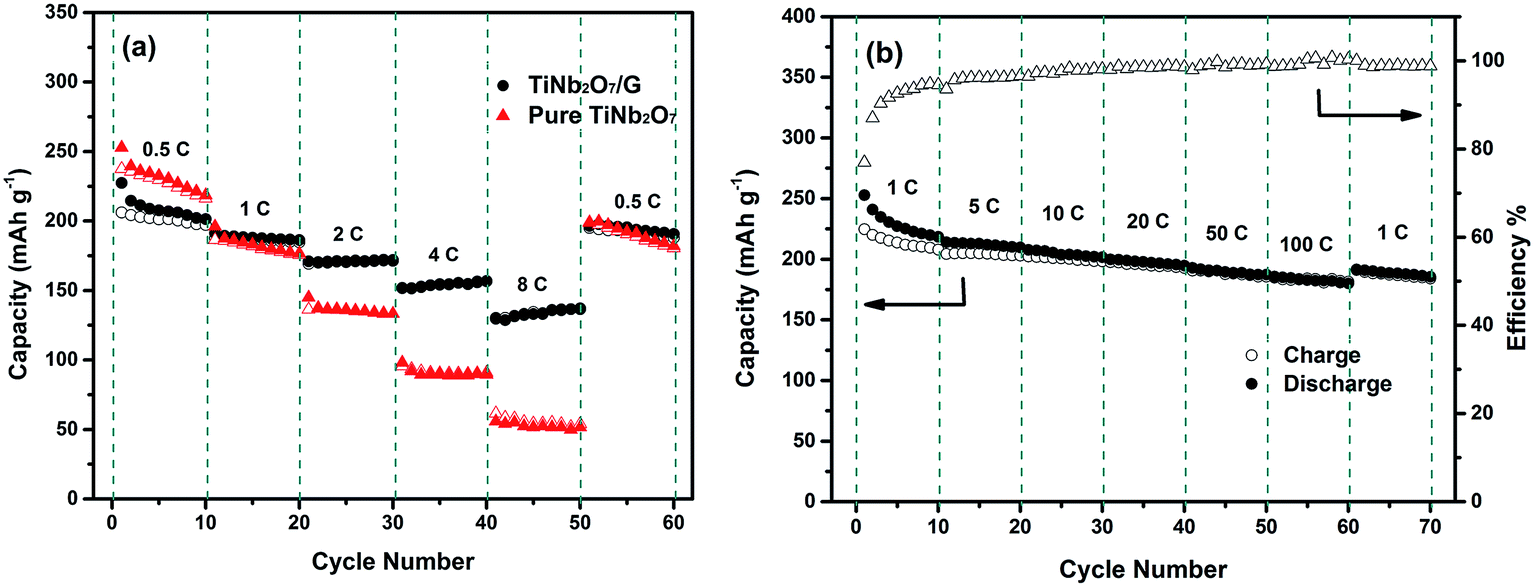 | ||
| Fig. 5 (a) Rate capabilities of pure TNO and TNO/G at different current densities; (b) capacity retention of the TNO/G anode at various rates: discharge current rate fixed at 1C (filled data points stand for discharge capacities; nonfilled data points stand for charge capacities). | ||
In order to investigate the fast lithium ion transport of TNO/G electrodes, the rate test at a fixed discharge rate of 1C was carried out. As shown in Fig. 5b, there is no severe capacity drop observed. Reversible capacities as high as 200 and 192 mA h g−1 can be achieved at charge rates of 20C and 50C, respectively. What's more, a capacity of 185 mA h g−1 can still be obtained even at a high charge rate of 100C which is higher than that of prior studies.18,42
With the purpose of further understanding the synergistic effect of TNO and graphene sheets, rate capacities of pure graphene sheets obtained from the same graphene oxide used for TNO/G composites adopting the same method mentioned in the materials synthesis part were investigated. As shown in Fig. S3 (ESI†), the charge capacities of pure graphene are 60.8, 48.7, 39.2, 31.2 and 25.6 mA h g−1 corresponding to the discharge–charge rates of 0.5C, 1C, 2C, 4C and 8C, respectively. Through a simple calculation in terms of eqn (1), we can get the calculated capacity (CTNO/Gcal) of TNO/G by an integration according to the capacities of pure TNO (CTNO) and graphene (CG).
| CTNO/Gcal = CTNO × 60 wt% + CG × 40 wt% | (1) |
Fig. 6 shows the experimental and calculated capacities of TNO/G (CTNO/Gexp and CTNO/Gcal). Specific capacity values of pure TNO, graphene and enhanced capacities are listed in Table S1 (ESI†). It is notable from the figure that the experimental capacity is much higher than the calculated capacity. The enhanced capacities (CTNO/Gexp − CTNO/Gcal) are 40.4, 57.9, 73.7, 86.9 and 90.3 mA h g−1 according to the discharge–charge rates of 0.5C, 1C, 2C, 4C and 8C, respectively, which strongly demonstrate the synergistic effects of TNO and graphene towards improving the electrochemical performance of TNO/G. The synergistic effects are likely associated with the superior conductivity of graphene sheets and the interface properties between TNO and graphene. X-ray photoelectron spectroscopy (XPS) analysis of the Ti2p spectrum of TNO/G composites annealed in Ar is shown in Fig. S4 (ESI†). Besides two characteristic Ti4+ peaks at 458.8 eV and 464.6 eV referring to Ti2p3/2 and Ti2p1/2, respectively,49 another peak located at 456.6 eV could be assigned to Ti3+,50,51 as a result of the reduction of the tetravalent titanium ion, Ti4+, when the sample was annealed in Ar. The presence of a low valence state with oxygen vacancies would enhance the electronic conductivity and promote the Li ion intercalation/deintercalation process.51,52
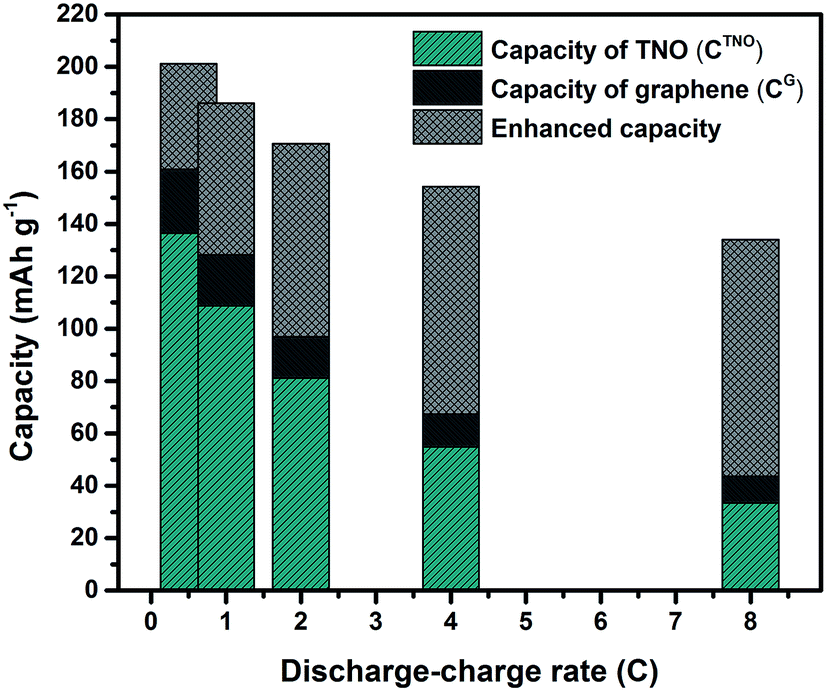 | ||
| Fig. 6 Experimental and calculated capacities of TNO/G (CTNO/Gexp and CTNO/Gcal), the CTNO/Gcal refers to the sum of the capacities from TNO and graphene components according to the weight percent in TNO/G. The capacity values are average charge capacities for 10 cycles at each discharge–charge rate. The crosshatched-areas indicate the enhanced capacity (CTNO/Gexp − CTNO/Gcal) due to the synergistic effects of TNO and graphene in TNO/G. | ||
In order to investigate why the TNO/G composites have enhanced rate performance compared to pure TNO materials, EIS measurements were performed after 70 cycles of rate capability test over a frequency range of 100 kHz to 0.01 Hz (Fig. 7). The Nyquist plots of TNO/G and TNO electrodes display two semicircles in the high and medium frequency regions, respectively, and a straight line in the low frequency range end of the medium frequency semicircles. The semicircle at the high frequency region is associated with the interface parameters such as surface film contribution, porous nature of the electrode and bulk properties. The semicircle located in the medium frequency range refers to the charge transfer resistance (Rct) related to the electrode reaction at the electrode–electrolyte interface.53,54 The straight line on the low frequency end represents the Warburg impedance (Zw) which indicates the diffusion of Li ions in the solid matrix.55,56 Fitting curves of the Nyquist plots with the equivalent electrical circuit model are shown in Fig. 7a. The symbols, Rs, Rf, Rct and Zw, denote the solution resistance, contact resistance, charge-transfer resistance and Warburg impedance, respectively. The fitting results of Rs, Rf, and Rct of TNO/G and TNO electrodes are shown in Table 1. It can be seen that the Rf values of TNO/G and TNO electrodes are 44.3 Ω and 61.2 Ω, respectively. With its lower Rf value the TNO/G composite demonstrated better electrical conductivity. Compared to the EIS result of pure TNO after 5 discharge/charge cycles as shown in Fig. S5 (ESI†), the Nyquist plots of pure TNO after 70 cycles present another semicircle with a Rct value of 523.2 Ω in the medium frequency range, indicating the increased charge-transfer resistance of the pure TNO electrode with accumulating cycles. The EIS result of TNO/G after 5 discharge/charge cycles (also shown in Fig. S5, ESI†) showed relatively large resistance; when compared with the result after 70 cycles, the appreciable difference is indicative of the existence of possible residual functional groups, which agrees with the hypothetical explanation of discharge–charge profiles discussed earlier in the paper. It is notable that the Rct of the TNO/G composite is 86.1 Ω, which is much smaller than 523.2 Ω of pure TNO, suggesting that the TNO/G electrode effectively suppressed the increase in charge transfer resistance after multiple discharge and charge cycles, which is believed to be the primary contribution to the superior rate performance. This result also confirmed that the structure of TNO/G and the incorporative effect in TNO and graphene sheets greatly ease the development of the electrochemical reaction between the electrolyte and active materials, resulting in enhancement of the electrochemical properties. Comparing the linear dependence of TNO/G composites and pure TNO electrodes in the low frequency region, the slope of the TNO/G electrode is much bigger than that of the TNO electrode. The lithium ion diffusion coefficient (DLi) was calculated from the plots in the low-frequency region. The equations for the calculation of DLi values by EIS can be expressed as follows:56–58
| Z′ = Rb + Rct + σω−0.5 | (2) |
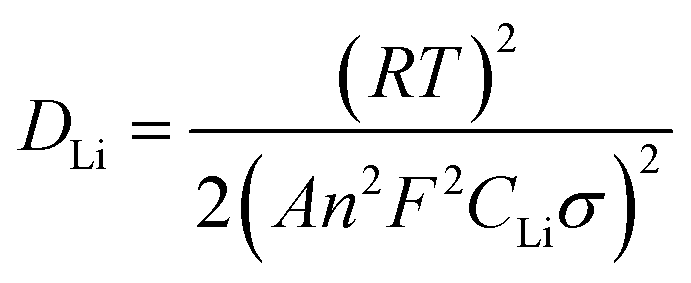 | (3) |
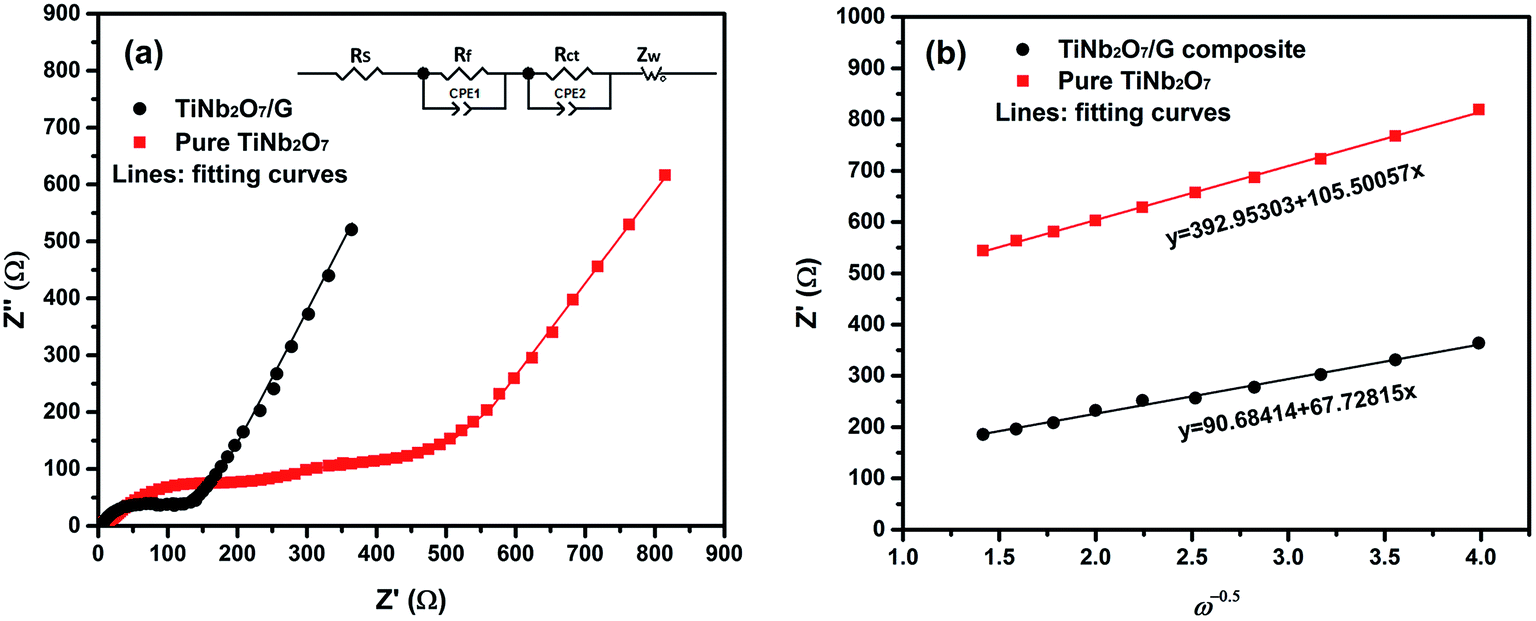 | ||
| Fig. 7 (a) Nyquist plots of EIS results of TNO/G composites and pure TNO after 70 cycles over a frequency range of 100 kHz to 0.01 Hz and (b) the Z′–ω−0.5 plots in the low frequency range. | ||
| Sample name | R s (Ω) | R f (Ω) | R ct (Ω) | D Li (cm2 s−1) |
|---|---|---|---|---|
| TNO | 5.9 | 61.2 | 523.2 | 8.25 × 10⁻²¹ |
| TNO/G | 4.1 | 44.3 | 86.1 | 2.00 × 10⁻²⁰ |
 | ||
| Fig. 8 Electrochemical test in sodium coin cells in the voltage range of 0.01–3.0 V (vs. Na/Na+): (a) CV curves of the TNO/G composite at 0.2 mV s−1; (b) discharge–charge profiles of the TNO/G composite at a current density of 25 mA g−1; (c) rate capabilities of pure TNO and TNO/G at different current densities; (d) cycling performance of pure TNO and TNO/G at 200 mA g−1. | ||
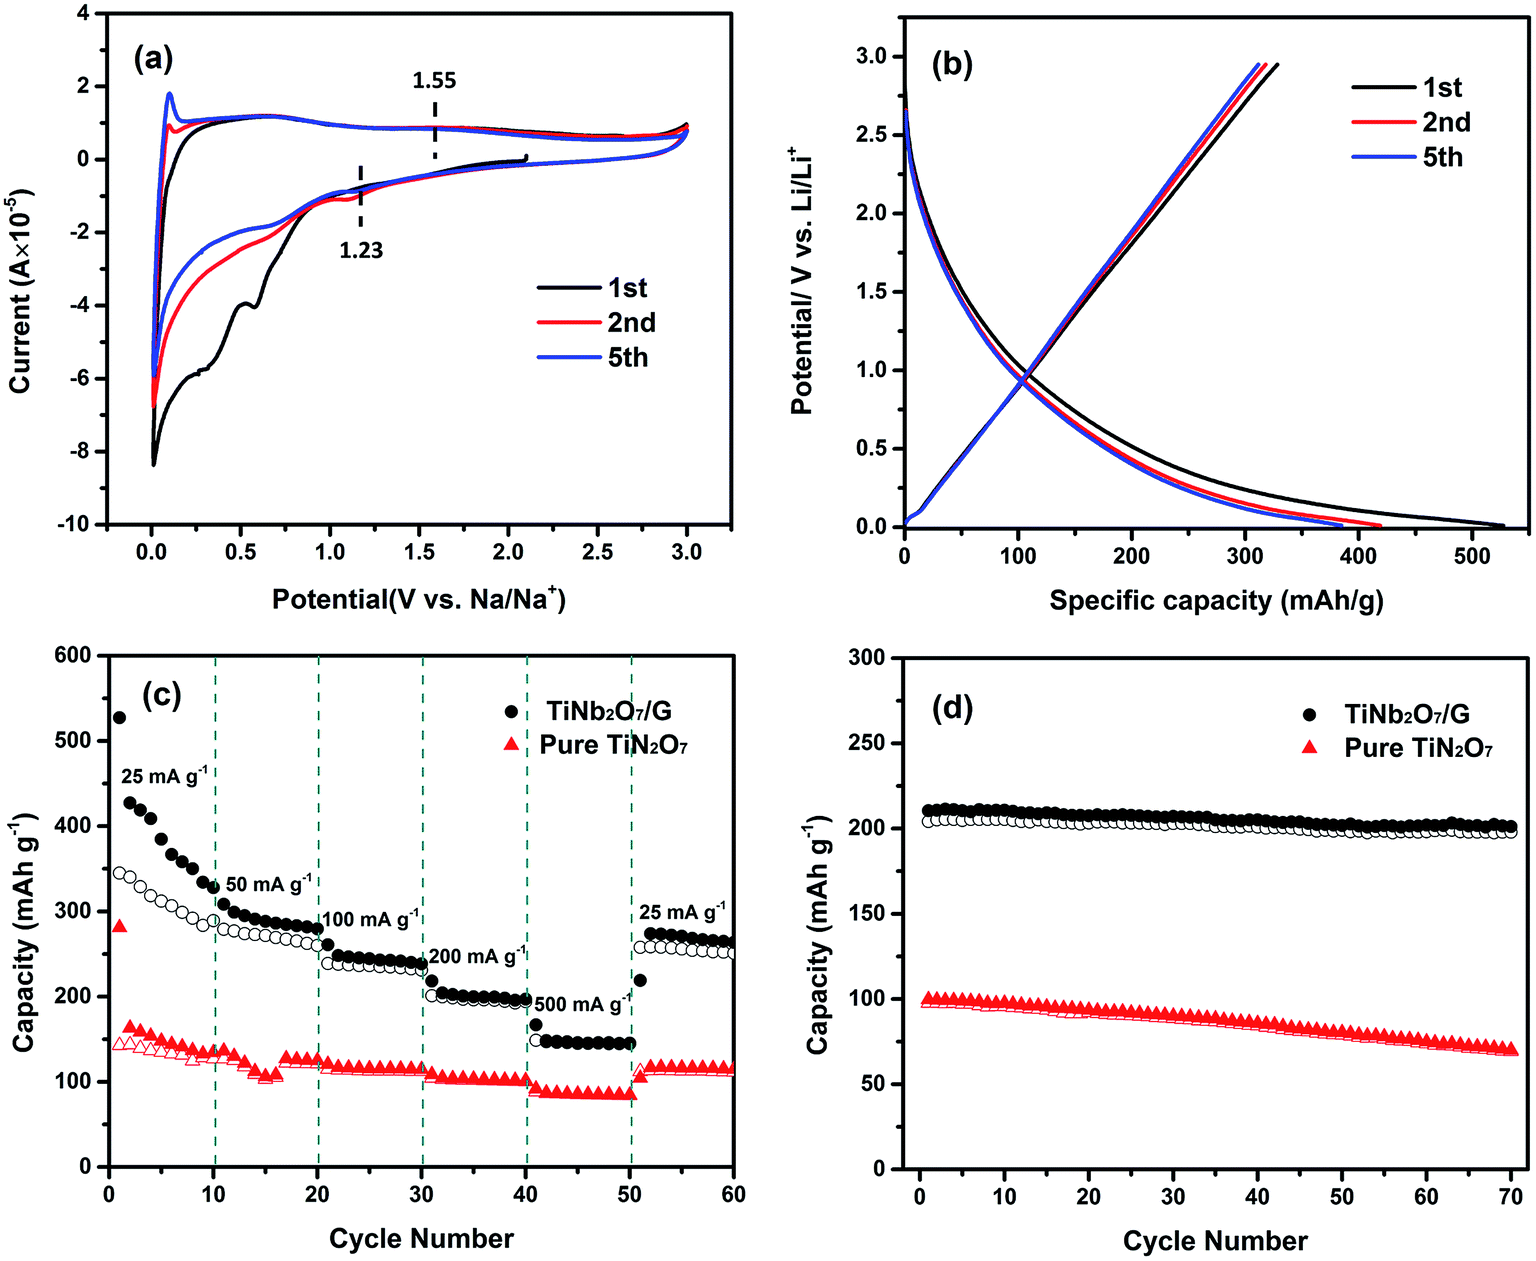
As illustrated in Fig. 8c, the TNO/G composite electrode shows enhanced rate performance in comparison with the pure TNO electrode. The charge capacities of the TNO/G composite electrode for 10 cycles are 311.4, 269.9, 235.4, 196.5 and 145.7 mA h g−1 at corresponding discharge–charge current densities of 25, 50, 100, 200 and 500 mA g−1, respectively. When the current density is reversed back to 25 mA g−1 after different rate testing the charge capacity returns back to 255.1 mA h g−1. These capacities are all higher than those of sodium ion electrodes made of pure TNO. The capacity enhancement can be attributed to the following two aspects. In the voltage range of Na ion ex/insertion (0.01–3.0 V vs. Na/Na+), graphene takes part in the energy-storage mechanism and makes contribution to the Na ion storage capacity; moreover, similar to the de/lithiation process, the synergistic effects of TNO and graphene sheets improved the performance of Na ion storage.
In order to evaluate the cycling stability of the TNO/G composite electrode applied in sodium ion half cells, the cycling performance of both the TNO/G composite and pure TNO was compared at a current density of 200 mA h g−1, as shown in Fig. 8d. As displayed, the capacity of the TNO/G composite electrode is very stable reaching around 200 mA h g−1 during the 70 discharge–charge cycles. Instead, the capacity of the pure TNO electrode obviously decreases with the number of cycles, starting from 97.6 mA h g−1 and reducing to 69.3 mA h g−1 after 70 discharge–charge cycles. These results imply that compared with pure TNO, the incorporation of the specific nanostructure and synergistic effects of graphene lead to the composite electrode with a markedly higher sodium ion extraction/insertion capacity while improving the overall cycling stability of the electrode.
3. Conclusions
Layered TiNb2O7/graphene composites have been successfully synthesized by simple direct blending of their aqueous colloidal dispersions followed by freeze drying. Microscopy analysis confirmed that the TiNb2O7 nanoparticles were homogeneously distributed on the graphene nanosheets. When applied as anode materials in Li-ion batteries, this nanostructured material exhibits a superior rate performance of 180 mA h g−1 at a current density of 38.7 A g−1 (100C rate). Through synergistic effects of their combination, the total specific capacity of TNO/G is improved compared with the sum of the specific capacity of pure TNO and graphene in their relative ratios. The excellent electrochemical properties of TNO/G nanocomposites are attributed to the superior electronic conductivity of graphene sheets and the layered structure with an interface effect between TNO and graphene including high surface area and oxygen vacancies accompanied with trivalent titanium ions, favoring lithium-ion transportation and the intercalation/deintercalation reaction. When TNO was used as an anode material for Na-ion batteries, a specific capacity of around 150 mA h g−1 at a current density of 25 mA g−1 was obtained. However, the TNO/G composite electrodes showed a reversible capacity of 340.2 mA h g−1 at a current density of 25 mA g−1, as graphene takes part in the energy-storage mechanism during the de/sodiation process, and also profit from the synergistic effect. Even at a higher current density of 200 mA g−1, a stable capacity of 200 mA h g−1 is still retained. These results demonstrated that TNO/G composites could be promising anode materials for sodium-ion batteries.4. Experimental section
4.1. Materials synthesis
TNO samples were synthesized partially according to the method of Guo et al.18 In short, the surfactant ethylene oxide/propylene oxide block copolymer (F127) was added to ethanol, HCl and HOAc to form a solution. The resulting solution was stirred at 600 rpm for 1 h and then niobium ethoxide (Nb(OC2H5)5, Sigma-Aldrich) and titanium isopropoxide (C12H28O4Ti, Sigma-Aldrich) were added followed by stirring for one more hour (600 rpm). The mixed solution was dried at 60 °C for 12 h. The as-synthesized materials were annealed at 800 °C in air for 3 h to obtain TNO samples. Graphene oxide was prepared using a modified Hummers method.60In a typical synthesis of TNO/G, TiNb2O7 nanoparticles were dispersed in DI water via sonication for 10 min. Then 20 ml as-obtained homodisperse TiNb2O7 nanoparticle aqueous suspension (2.0 mg ml−1) was mixed with 40 ml graphene oxide (GO) aqueous suspension (1.0 mg ml−1) under sonication for 10 min to achieve a uniform TiNb2O7 nanoparticle/graphene oxide aqueous suspension.21 This mixed suspension was frozen at −20 °C for 1 day and then freeze-dried under vacuum at −50 °C for 3 days in a Labconco FreeZone 1 L freeze dryer. After drying, the TiNb2O7 nanoparticles/graphene oxide was reduced by annealing under an Ar atmosphere at 500 °C for 2 h to obtain the TNO/G.
4.2. Materials characterization
The crystalline structure of TNO nanoparticles obtained was characterized by X-ray diffraction (XRD, D8 Bruker X-ray diffractometer with Cu-Kα radiation (λ = 1.5418 Å)) within the range of 5–60° (2θ). Scanning electron microscopy (SEM, JEOL, JSM-7000F) and transmission electron microscopy (TEM, FEI, Tecnai G2 F20) were performed to examine the morphology and microstructure of the as prepared samples. Thermogravimetric analysis (TGA) was performed on a TG instrument (NET ZSCH STA 409C). X-ray photoelectron spectroscopy (XPS) analysis was performed using a VG Multilab 2000 with Al Ka as the X-ray source. The accelerating voltage and current were 40 kV and 40 mA, respectively. Nitrogen adsorption–desorption isotherms were measured using the Quantachrome NOVA 4200e system. Samples were degassed at 200 °C overnight under vacuum prior to measurements. The specific surface area and micropore volumes were determined by the multipoint Brunauer–Emmett–Teller (BET), t-method, and Barrett–Joyner–Halenda (BJH) desorption analyses, respectively.4.3. Electrochemical measurement
The electrochemical performance of the TNO and TNO/G electrode materials were tested in coin-type cells, which were assembled using the as-prepared samples in an argon-filled glovebox (Innovative Technology, IL-2GB). The as-prepared active materials were mixed and ground with poly(vinylidene fluoride) (PVDF, Sigma-Aldrich) as a binder and super P conductive carbon (TIMCAL Graphite & Carbon) as the conductive additive material at a respective weight ratio of 70:20:10 in a N-methyl-2-pyrrolidone (NMP, Alfa Aesar) solution. The as-prepared mixture was uniformly spread and pressed onto copper foil and dried in a vacuum oven at 110 °C overnight to be used as the working electrode. The mass of the active material is approximately 0.5 mg. Pure lithium foil was used as the counter and reference electrodes. 1 M LiPF6 (NaPF6) in ethylene carbonate (EC)/dimethyl carbonate (DMC) was used as the electrolyte for Li-ion (Na-ion) cells. Cyclic voltammetry (CV) was conducted on an electrochemical analyzer (CH Instruments, model 605C) in the voltage range of 1.0–3.0 V vs. Li/Li+ (0.01–3.0 V vs. Na/Na+ for Na-ion cells) at a scan rate of 0.2 mV s−1. Galvanostatic charge/discharge measurements for Li-ion cells were performed in the voltage range of 1.0–3.0 V vs. Li/Li+ (0.01–3.0 V vs. Na/Na+ for Na-ion cells) under different current densities. Electrochemical impedance spectroscopy (EIS) was performed on a Solartron 1287A in conjunction with a Solartron 1260FRA/impedance analyzer with an amplitude of 5.0 mV in the frequency range from 100 kHz to 0.01 Hz. The half-cells were tested at various current rates based on the weight of the active material alone.
Acknowledgements
Shuang Li would like to acknowledge the financial support as a scholarship for Ph.D. study from the China Scholarship Council (CSC) at the University of Washington. This work was financially supported in part by the National Science Foundation (NSF-DMR 1505902).References
- C. Liu, F. Li, L.-P. Ma and H.-M. Cheng, Adv. Mater., 2010, 22, E28–E62 CrossRef CAS PubMed.
- J. B. Goodenough and K.-S. Park, J. Am. Chem. Soc., 2013, 135, 1167–1176 CrossRef CAS PubMed.
- B. Dunn, H. Kamath and J.-M. Tarascon, Science, 2011, 334, 928–935 CrossRef CAS PubMed.
- V. Etacheri, R. Marom, R. Elazari, G. Salitra and D. Aurbach, Energy Environ. Sci., 2011, 4, 3243–3262 CAS.
- E. Uchaker and G. Cao, Nano Today, 2014, 9, 499–524 CrossRef CAS.
- M. Armand and J. M. Tarascon, Nature, 2008, 451, 652–657 CrossRef CAS PubMed.
- Y.-S. Su, Y. Fu, T. Cochell and A. Manthiram, Nat. Commun., 2013, 4, 2985 Search PubMed.
- J.-T. Han, Y.-H. Huang and J. B. Goodenough, Chem. Mater., 2011, 23, 2027–2029 CrossRef CAS.
- H. Li, L. Shen, G. Pang, S. Fang, H. Luo, K. Yang and X. Zhang, Nanoscale, 2015, 7, 619–624 RSC.
- J. Shu, Electrochem. Solid-State Lett., 2008, 11, A238–A240 CrossRef CAS.
- L. Shen, B. Ding, P. Nie, G. Cao and X. Zhang, Adv. Energy Mater., 2013, 3, 1484–1489 CrossRef CAS.
- M. M. Thackeray, C. Wolverton and E. D. Isaacs, Energy Environ. Sci., 2012, 5, 7854–7863 CAS.
- P. G. Bruce, B. Scrosati and J. M. Tarascon, Angew. Chem., Int. Ed., 2008, 47, 2930–2946 CrossRef CAS PubMed.
- X. Lu, Z. Jian, Z. Fang, L. Gu, Y.-S. Hu, W. Chen, Z. Wang and L. Chen, Energy Environ. Sci., 2011, 4, 2638–2644 CAS.
- H. Song and Y.-T. Kim, Chem. Commun., 2015, 51, 9849–9852 RSC.
- L. Fei, Y. Xu, X. Wu, Y. Li, P. Xie, S. Deng, S. Smirnov and H. Luo, Nanoscale, 2013, 5, 11102–11107 RSC.
- K. Tang, X. Mu, P. A. van Aken, Y. Yu and J. Maier, Adv. Energy Mater., 2013, 3, 49–53 CrossRef CAS.
- B. Guo, X. Yu, X.-G. Sun, M. Chi, Z.-A. Qiao, J. Liu, Y.-S. Hu, X.-Q. Yang, J. B. Goodenough and S. Dai, Energy Environ. Sci., 2014, 7, 2220–2226 CAS.
- H. Park, H. B. Wu, T. Song and U. Paik, Adv. Energy Mater., 2015, 5, 1401945 Search PubMed.
- C. Jo, Y. Kim, J. Hwang, J. Shim, J. Chun and J. Lee, Chem. Mater., 2014, 26, 3508–3514 CrossRef CAS.
- X. Zhou, Y.-X. Yin, L.-J. Wan and Y.-G. Guo, J. Mater. Chem., 2012, 22, 17456–17459 RSC.
- Y. Zhu, S. Murali, M. D. Stoller, K. J. Ganesh, W. Cai, P. J. Ferreira, A. Pirkle, R. M. Wallace, K. A. Cychosz, M. Thommes, D. Su, E. A. Stach and R. S. Ruoff, Science, 2011, 332, 1537–1541 CrossRef CAS PubMed.
- R. Raccichini, A. Varzi, S. Passerini and B. Scrosati, Nat. Mater., 2015, 14, 271–279 CrossRef CAS PubMed.
- V. Singh, D. Joung, L. Zhai, S. Das, S. I. Khondaker and S. Seal, Prog. Mater. Sci., 2011, 56, 1178–1271 CrossRef CAS.
- Z.-S. Wu, G. Zhou, L.-C. Yin, W. Ren, F. Li and H.-M. Cheng, Nano Energy, 2012, 1, 107–131 CrossRef CAS.
- M. K. Datta, R. Epur, P. Saha, K. Kadakia, S. K. Park and P. N. Kumta, J. Power Sources, 2013, 225, 316–322 CrossRef CAS.
- A. Ponrouch, A. R. Goñi and M. R. Palacín, Electrochem. Commun., 2013, 27, 85–88 CrossRef CAS.
- D. A. Stevens and J. R. Dahn, J. Electrochem. Soc., 2000, 147, 1271–1273 CrossRef CAS.
- V. Palomares, P. Serras, I. Villaluenga, K. B. Hueso, J. Carretero-González and T. Rojo, Energy Environ. Sci., 2012, 5, 5884–5901 CAS.
- M. D. Slater, D. Kim, E. Lee and C. S. Johnson, Adv. Funct. Mater., 2013, 23, 947–958 CrossRef CAS.
- L. Wang, Y. Lu, J. Liu, M. Xu, J. Cheng, D. Zhang and J. B. Goodenough, Angew. Chem., Int. Ed., 2013, 52, 1964–1967 CrossRef CAS PubMed.
- Y. Yan, Y. X. Yin, Y. G. Guo and L. J. Wan, Adv. Energy Mater., 2014, 4, 1301584 Search PubMed.
- E. Uchaker, Y.-Z. Zheng, S. Li, S. L. Candelaria, S. Hu and G. Cao, J. Mater. Chem. A, 2014, 2, 18208–18214 CAS.
- H. Kang, Y. Liu, K. Cao, Y. Zhao, L. Jiao, Y. Wang and H. Yuan, J. Mater. Chem. A, 2015, 3, 17899–17913 CAS.
- Y. Liu, H. Kang, L. Jiao, C. Chen, K. Cao, Y. Wang and H. Yuan, Nanoscale, 2015, 7, 1325–1332 RSC.
- Y. Liu, N. Zhang, L. Jiao, Z. Tao and J. Chen, Adv. Funct. Mater., 2015, 25, 214–220 CrossRef CAS.
- H. Xiong, M. D. Slater, M. Balasubramanian, C. S. Johnson and T. Rajh, J. Phys. Chem. Lett., 2011, 2, 2560–2565 CrossRef CAS.
- L. Wu, D. Buchholz, D. Bresser, L. Gomes Chagas and S. Passerini, J. Power Sources, 2014, 251, 379–385 CrossRef CAS.
- D. Su, S. Dou and G. Wang, Chem. Commun., 2014, 50, 4192–4195 RSC.
- J.-T. Han, D.-Q. Liu, S.-H. Song, Y. Kim and J. B. Goodenough, Chem. Mater., 2009, 21, 4753–4755 CrossRef CAS.
- M. Wei, K. Wei, M. Ichihara and H. Zhou, Electrochem. Commun., 2008, 10, 980–983 CrossRef CAS.
- S. Lou, Y. Ma, X. Cheng, J. Gao, Y. Gao, P. Zuo, C. Du and G. Yin, Chem. Commun., 2015, 51, 17293–17296 RSC.
- E. Yoo, J. Kim, E. Hosono, H.-s. Zhou, T. Kudo and I. Honma, Nano Lett., 2008, 8, 2277–2282 CrossRef CAS PubMed.
- Y. Sun, X. Hu, W. Luo and Y. Huang, ACS Nano, 2011, 5, 7100–7107 CrossRef CAS PubMed.
- Z.-S. Wu, W. Ren, L. Wen, L. Gao, J. Zhao, Z. Chen, G. Zhou, F. Li and H.-M. Cheng, ACS Nano, 2010, 4, 3187–3194 CrossRef CAS PubMed.
- X. Wang and G. Shen, Nano Energy, 2015, 15, 104–115 CrossRef.
- B. Z. Jang, C. Liu, D. Neff, Z. Yu, M. C. Wang, W. Xiong and A. Zhamu, Nano Lett., 2011, 11, 3785–3791 CrossRef CAS PubMed.
- C. Wang, D. Li, C. O. Too and G. G. Wallace, Chem. Mater., 2009, 21, 2604–2606 CrossRef CAS.
- J. M. Macák, H. Tsuchiya and P. Schmuki, Angew. Chem., Int. Ed., 2005, 44, 2100–2102 CrossRef PubMed.
- J. Zhao, E. G. Garza, K. Lam and C. M. Jones, Appl. Surf. Sci., 2000, 158, 246–251 CrossRef CAS.
- D. Liu, Y. Zhang, P. Xiao, B. B. Garcia, Q. Zhang, X. Zhou, Y.-H. Jeong and G. Cao, Electrochim. Acta, 2009, 54, 6816–6820 CrossRef CAS.
- Y. Li, J. Yao, E. Uchaker, M. Zhang, J. Tian, X. Liu and G. Cao, J. Phys. Chem. C, 2013, 117, 23507–23514 CAS.
- M. Umeda, K. Dokko, Y. Fujita, M. Mohamedi, I. Uchida and J. R. Selman, Electrochim. Acta, 2001, 47, 885–890 CrossRef CAS.
- S. Hu, F. Yin, E. Uchaker, W. Chen, M. Zhang, J. Zhou, Y. Qi and G. Cao, J. Phys. Chem. C, 2014, 118, 24890–24897 CAS.
- M. E. Orazem and B. Tribollet, Electrochemical Impedance Spectroscopy, John Wiley & Sons, 2011 Search PubMed.
- Y.-F. Deng, S.-X. Zhao, Y.-H. Xu and C.-W. Nan, J. Mater. Chem. A, 2014, 2, 18889–18897 CAS.
- Q. Cao, H. P. Zhang, G. J. Wang, Q. Xia, Y. P. Wu and H. Q. Wu, Electrochem. Commun., 2007, 9, 1228–1232 CrossRef CAS.
- H. Song, Y. Liu, C. Zhang, C. Liu and G. Cao, J. Mater. Chem. A, 2015, 3, 3547–3558 CAS.
- Y. Xu, E. M. Lotfabad, H. Wang, B. Farbod, Z. Xu, A. Kohandehghan and D. Mitlin, Chem. Commun., 2013, 49, 8973–8975 RSC.
- W. S. Hummers and R. E. Offeman, J. Am. Chem. Soc., 1958, 80, 1339 CrossRef CAS.
Footnote |
| † Electronic supplementary information (ESI) available. See DOI: 10.1039/c5ta10510b |
| This journal is © The Royal Society of Chemistry 2016 |