 Open Access Article
Creative Commons Attribution 3.0 Unported Licence
Triconstituent co-assembly synthesis of N,S-doped carbon–silica nanospheres with smooth and rough surfaces†
Hao
Tian
a,
Martin
Saunders
b,
Aaron
Dodd
b,
Kane
O'Donnell
c,
Mietek
Jaroniec
d,
Shaomin
Liu
*a and
Jian
Liu
 *a
*a
aDepartment of Chemical Engineering, Curtin University, Perth, WA 6845, Australia. E-mail: jian.liu@curtin.edu.au; shaomin.liu@curtin.edu.au
bCentre for Microscopy, Characterisation and Analysis (CMCA), The University of Western Australia (M010), 35 Stirling Highway, Crawley, WA 6009, Australia
cDepartment of Imaging and Applied Physics, Curtin University, Perth, WA 6845, Australia
dDepartment of Chemistry, Kent State University, Kent, Ohio 44242, USA
First published on 11th January 2016
Abstract
Multifunctional porous nanospheres are desirable for many applications, but their synthesis involves multi-step procedures and their simplification still remains a challenge. Herein, we demonstrate a facile synthesis of polymer–silica nanospheres by using an extended Stöber method via triconstituent co-assembly of 3-aminophenol, formaldehyde, and bis[3-(triethoxysilyl)propyl]tetrasulfide followed by copolymerization. N,S-doped carbon–silica nanospheres with either smooth or rough surface can be obtained by direct carbonization of the polymer–silica nanospheres. The carbon–silica spheres feature multifunctional properties and exhibit very good performance as adsorbents for CO2 capture (67 cm3 g−1 at 0 ± 1 °C and 1.0 bar) and as supercapacitor electrodes with high specific capacitance (221 F g−1). This strategy could pave the way for design of carbon nanostructures at molecular level for multi-purpose applications.
Introduction
The design and synthesis of nanoparticles with controllable surface properties are of great importance for various applications such as drug delivery, catalysis, energy storage and conversion.1–5 Learning from nature, in particular from virus and pollen morphology, the raspberry-like nanoparticles with rough surface have attracted a widespread interest due to their unique structure and functionality such as exceptional morphology, large specific surface area, surface coarseness, and large light scattering. Although raspberry-like nanoparticles have been designed and synthesized for specific applications, e.g., self-cleaning,6 drug delivery,7 catalysis,8 optical and electrical devices,9 and heavy metal ions removal,10 it is still a great challenge to fabricate various multifunctional raspberry-like porous nanospheres such as carbon–silica composite particles in a simple and effective way.To date, the Stöber method has been developed for a one-pot synthesis of silica, phenolic resin (PR) and carbon spheres.11–13 Since the first report on the preparation of PR spheres with controllable particle size by using the extended Stöber method,12 many different approaches have been developed to fabricate regular porous and core–shell carbon spheres with controllable porosity, structure and composition.14–26 For example, Jaroniec and co-workers reported the synthesis of diverse carbon spheres with micropores, mesopores, or both by adding silica nanoparticles as a hard template. Various porous carbon and silica–carbon spheres have been successfully synthesized by controlling the polycondensation rate of tetraethyl orthosilicate (TEOS) and different PR precursors.17–19,23,24 In addition, a rational design of carbon spheres for specific applications, including those doped with nitrogen, sulphur, phosphorus has been explored to achieve the desired properties such as improved conductivity or catalytic activity.27–30 However, the resultant carbon spheres are still not richly functionalized, which limits their practical applications. Thus, it is desirable to design carbon–silica composite particles with controllable surface roughness and multi-functionality by a simple one step method.
In this contribution, we report triconstituent co-assembly of 3-aminophenol (AP), formaldehyde, and bis[3-(triethoxysilyl)propyl]tetrasulfide (TESPTS) for a facile synthesis of PR polymer–silica nanospheres with smooth and rough surfaces. Carbonization of these spheres generates the carbon–silica nanospheres. The raspberry-like carbon–silica nanospheres are composed of carbon cores decorated with many silica nanoparticles on the surface. As illustrated in Scheme 1, our approach is based on the Stöber method involving simultaneously polymerization of PR and condensation of TESPTS in aqueous alcohol solution with addition of ammonia catalyst. Hydrothermal treatment of PR polymer–silica core–shell nanoparticles plays a key role in developing the surface roughness due to the enhanced condensation degree of TESPTS.
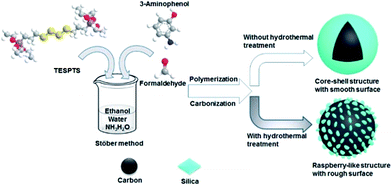 | ||
| Scheme 1 Synthesis of polymer–silica and carbon–silica core–shell spheres functionalized with N,S-species. | ||
Experimental
Materials
Formaldehyde (37% solution), aqueous ammonia (25% solution), ethanol (undenatured, 95–100%), 3-aminophenol (99%) and bis[3-(triethoxysilyl)propyl]tetrasulfide (TESPTS, ≥90%) were purchased from Sigma-Aldrich and used as received without any further purification. Washing was achieved with ultrapure water and reagent grade ethanol where required. Ultrapure water was used for solution preparations.Synthesis of N,S-dually functionalized polymer–silica spheres
Typically, ammonia aqueous solution (NH3·H2O, 0.6 mL, 25 wt%) was mixed with a solution containing absolute ethanol (EtOH, 24 mL) and deionized water (H2O, 114 mL), then stirred for 30 min. Subsequently, 3-aminophenol (1.2 g) was added and continually stirred for 30 min. Then 5.28 mL of bis[3-(triethoxysilyl)propyl]tetrasulfide (TESPTS) and formaldehyde solution (1.68 mL) were added to the reaction solution and stirred for 24 h at 30 °C. The mixture was separated into two equal parts. The first part of the mixture named N,S-dually functionalized polymer silica spheres without hydrothermal treatment (N,S-PSS) was separated directly and washed with Di-water and ethanol 3 times. The second part was transferred to a hydrothermal reactor, which was then placed into an oven for 24 h at 100 °C. Then the remained materials N,S-dually functionalized polymer silica spheres after hydrothermal treatment (N,S-PSR) were washed with DI-water and ethanol 3 times.Synthesis of N,S-dually functionalized carbon–silica spheres
N,S-PSS and N,S-PSR were thermally treated in flowing N2 in a tube furnace using a heating rate of 1 °C min−1 up to 350 °C, dwell for 2 h, and resuming heating rate at 1 °C min−1 up to 700 °C and dwell for 4 h to achieve N,S-dually functionalized carbon–silica spheres named of N,S-dually functionalized carbon–silica spheres without hydrothermal treatment (N,S-CSS) and with hydrothermal treatment (N,S-CSR-1), respectively. The N,S-CSS-900 spheres were prepared through thermal treatment of N,S-PSS in flowing N2 in a tube furnace using a heating rate of 1 °C min−1 up to 350 °C, dwell for 2 h, and resuming heating rate at 1 °C min−1 up to 900 °C and dwell for 4 h.Synthesis of silica nanoparticles
N,S-dually functionalized carbon–silica spheres were calcined in muffle furnace using a heating rate of 1 °C min−1 up to 350 °C, dwell for 2 h, and resuming heating rate at 1 °C min−1 up to 700 °C and dwell for 4 h to achieve silica nanoparticles.Characterisation
The sample morphology was characterized by using a transmission electron microscope (TEM, JEOL EM-2100) and a scanning electron microscope (SEM, Zeiss Neon). High Angle Annular Dark Field Scanning Transmission Electron Microscopy (HAADF-STEM) imaging and element mapping were carried out using a FEI Titan G2 80-200 TEM/STEM with ChemiSTEM Technology operating at 200 kV. The elemental mapping was obtained by energy dispersive X-ray spectroscopy using the Super-X detector on the Titan with a probe size ∼1 nm and a probe current of ∼0.4 nA. Nitrogen adsorption and desorption isotherms were measured on Micromeritics TriStar II Surface Area and Porosity Analyser. The specific surface area was determined by the Brunauer–Emmett–Teller (BET) method from nitrogen adsorption isotherms in the relative pressure range of 0.05–0.20. The accumulated pore volume and pore size distribution (PSD) were calculated by using nonlocal density functional theory (NLDFT) method. Prior to nitrogen sorption measurements, the samples were degassed at 250 °C overnight.CO2 adsorption
Carbon dioxide adsorption isotherms were obtained at 0 °C using a sorption analyser instrument (Micromeritics Gemini 2360 Surface Area Analyser). Prior to sorption measurements, the samples were degassed at 250 °C overnight.Results and discussion
The observed difference in the polymerization rate of APF and TESPTS, namely the much faster polymerization rate of APF than that of TESPTS, causes the initial formation of the NH4+ modified phenol resin cores, which electrostatically attract negatively charged silica nanoparticles by forming the raspberry-like polymer–silica spheres. Subsequently, the carbon–silica core–shell spheres can be obtained by pyrolysis of PR polymer–silica spheres under N2 atmosphere as shown in Scheme 1. Moreover, the hollow silica capsules can be generated by burning off carbon in the carbon–silica particles in air. This approach combines two merits: (i) multi-step assembling and coating processes are combined into one-step process and also (ii) multi-functional groups and the desired surface roughness can be achieved at the same time.As shown in Fig. 1a, the scanning electron microscopy (SEM) image shows that N,S-functionalized carbon–silica spheres (N,S-CSS) obtained without hydrothermal treatment exhibit uniform spherical morphology with relatively smooth surface and the average particle size of about 400 nm. A transmission electron microscopy (TEM) image (Fig. 1b) confirms that N,S-CSS spheres are very uniform. The scanning transmission electron microscopy (STEM) and the corresponding energy dispersive X-ray spectroscopy (EDS) elemental mapping (Fig. 1c) were obtained to identify the distribution of silica and carbon in the spheres. As shown in Fig. 1c, nitrogen atoms are homogeneously distributed in the carbon framework and the silica shell formed on the surface of the carbon core is thin, indicating the carbon–silica core–shell structure.
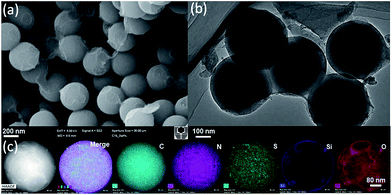 | ||
| Fig. 1 (a) SEM image, (b) TEM image, (c) STEM and EDS mapping of carbon–silica spheres with N,S-species (N,S-CSS) obtained without hydrothermal treatment. | ||
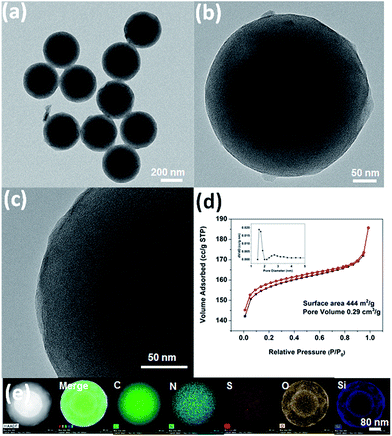
After thermal treatment of N,S-PSS in flowing nitrogen at 900 °C, uniform core–shell structured and spherical carbon–silica composite materials with smooth surface (N,S-CSS-900) were achieved with the average particle size of about 355 nm (as shown in Fig. 2a). As can be seen in Fig. 2b and c, the diameter of the shell is about 50 nm and the diameter of core is about 255 nm. Analysis of N2 adsorption–desorption isotherm (Fig. 2d) measured for the N,S-CSS-900 indicates the presence of micropores and mesopores, which is confirmed by non-local density functional theory (NLDFT) calculation of the pore size distribution having a bimodal shape with peaks centered at 1.6 and 2.8 nm (see inset in Fig. 2d).25,29 The Brunauer–Emmett–Teller (BET) surface area and the pore volume obtained on the basis of the aforementioned adsorption isotherm are 444 m2 g−1 and 0.29 cm3 g−1, respectively. The scanning transmission electron microscopy (STEM) and the corresponding energy dispersive X-ray spectroscopy (EDS) elemental mapping (Fig. 2e) were obtained to identify the distribution of silica and carbon. As shown in Fig. 2e, it is interesting to find that the double-layered silica shell formed on the surface of the inner and outer carbon core, indicating the carbon–silica core–shell structure.
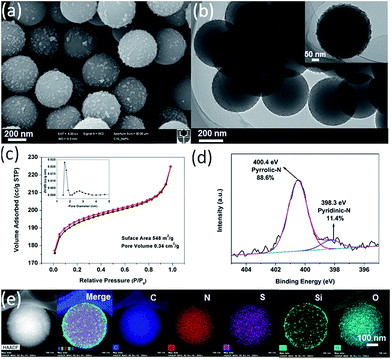
An additional hydrothermal treatment of the N,S-dually functionalized carbon–silica spheres (N,S-CSR-1) resulted in the raspberry-like spheres (Fig. 3a), which is confirmed by the TEM images shown in Fig. 3b. The silica nanoparticles used to decorate the carbon cores were of about 20 nm. Pore size analysis of nitrogen adsorption–desorption isotherm measured for the N,S-CSR-1 spheres (Fig. 3c) by non-local density functional theory (NLDFT)25,29 indicates their micro-mesoporous structure as shown by bimodal pore size distribution centered at 1.6 and 2.8 nm. The Brunauer–Emmett–Teller (BET) surface area and the pore volume obtained on the basis of the aforementioned adsorption isotherm are 548 m2 g−1 and 0.34 cm3 g−1, respectively. The X-ray photoelectron spectroscopy (XPS) (Fig. S1†) pattern exhibits four typical peaks for C 1s, N 1s, O 1s and S 2p on the survey spectrum with the corresponding content of each element of 86.0%, 3.8%, 8.9% and 1.3%, respectively.
The XPS high resolution scan (Fig. 3d) displays two overlapping N 1s peaks corresponding to pyridinic nitrogen (398.3 eV) and pyrrolic nitrogen (400.4 eV) with the relative concentration of each of about 11.4% and 88.6%, respectively.30 S 2p3/2 and 2p1/2 doublet peak was recorded and unfolded with an energy separation of 1.2 eV and relative peak intensities of 2![[thin space (1/6-em)]](https://www.rsc.org/images/entities/char_2009.gif) :
:![[thin space (1/6-em)]](https://www.rsc.org/images/entities/char_2009.gif) 1. The binding energy of S 2p1/2 peak at 162.8 eV is probably attributed to C–S species in the silica precursors.31 The signals of the binding energy at 165.3–166.5 eV are also observed indicating that S constituents were oxidized into sulfite functional groups.32 Interestingly, the particle size of N,S-CSS (400 nm) did not change during hydrothermal treatment process, which resulted in the raspberry-like N,S-CSR-1 core–shell spheres with silica shells consisting of a large number of silica nanoparticles present on the surface of carbon cores. To determine the dispersion of elements in N,S-CSR-1, the EDS elemental mapping of N,S-CSR-1 has been used to reveal that the small clusters grown on the surface of carbon spheres are silica nanoparticles. These small nanoparticles are derived upon hydrothermal treatment of silica generated by polycondensation of TESPTS (Fig. 3e). Similarly, a thin silica layer was formed on the surface of polymer spheres (Fig. S2a†), which upon hydrothermal treatment was converted to silica nanoparticles (Fig. 3b and S2b†).
1. The binding energy of S 2p1/2 peak at 162.8 eV is probably attributed to C–S species in the silica precursors.31 The signals of the binding energy at 165.3–166.5 eV are also observed indicating that S constituents were oxidized into sulfite functional groups.32 Interestingly, the particle size of N,S-CSS (400 nm) did not change during hydrothermal treatment process, which resulted in the raspberry-like N,S-CSR-1 core–shell spheres with silica shells consisting of a large number of silica nanoparticles present on the surface of carbon cores. To determine the dispersion of elements in N,S-CSR-1, the EDS elemental mapping of N,S-CSR-1 has been used to reveal that the small clusters grown on the surface of carbon spheres are silica nanoparticles. These small nanoparticles are derived upon hydrothermal treatment of silica generated by polycondensation of TESPTS (Fig. 3e). Similarly, a thin silica layer was formed on the surface of polymer spheres (Fig. S2a†), which upon hydrothermal treatment was converted to silica nanoparticles (Fig. 3b and S2b†).
In order to tailor the particle size and the N and S contents, the TESPTS/AP molar ratio was varied. The nitrogen adsorption isotherms measured for the other carbon–silica materials are shown in Fig. S3† and the results of the surface area, pore size and pore volume are listed in Table S1.† As shown in Fig. S3,† all the samples show type-I isotherms with microporous structure. The specific surface area of these particles varies from 300 m2 g−1 to 550 m2 g−1. The smallest surface area obtained for N,S-CSR-4 is mainly derived from the relatively high residual content (22.3%) in comparison to other samples (see Fig. S4†). The remaining carbon–silica samples possess relatively high surface area because of comparatively high carbon content. The highest surface area of N,S-CSR-1 can be due to the highest carbon content (88.6%) among all five samples (Table S2†). As the amount of TESPTS increases as evidenced by the molar ratio of TESPTS/AP varying from 0.48 to 1.92, the size of monodisperse carbon-silica spheres decreases from 465 nm to 270 nm (see Fig. 4, Table S1 and Fig. S5†). This is probably associated with the fact that with decreasing concentration of 3-aminophenol, the polymerization rate is reduced and the smaller resin particles are produced. Additionally, the TEM and SEM images of N,S-CSR-3 (Fig. 4) show smoother surface than that of other samples, indicating that higher concentration of TESPTS leads to the formation of thicker silica layer with smaller silica nanoparticles.
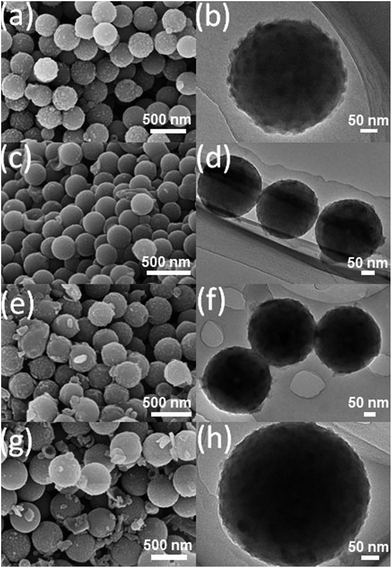 | ||
| Fig. 4 SEM (left) and TEM (right) images of (a), (b) N,S-CSR-2; (c), (d) N,S-CSR-3; (e), (f) N,S-CSR-4; (g), (h) N,S-CSR-5. | ||
Based on the above presented observations, the proposed mechanism of formation of N,S-dually functionalized carbon–silica spheres and the corresponding polymer–silica spheres can be explained as shown in Schemes 1 and 2, respectively. In the first step, the negatively charged PR spheres are formed rapidly in the presence of ammonia in ethanol/water mixture and a stable colloidal suspension is obtained. Then the surface of PR spheres is covered with NH4+ ions to inhibit their further aggregation. At the same time, due to the relatively slow hydrolysis and condensation of TESPTS silane,33 the formation of cross-linked silica particles requires longer reaction time or higher reaction temperature. In the next step, due to the strong electrostatic interactions between silicate anions and NH4+ ions on the surface of polymer spheres, a thin layer of silica is formed on the surface of polymer spheres. It is also well-known that the hydroxyl groups present in phenolic resin can react with silane oligomer species. As a result, a cooperative condensation and cross-linking reaction occurs between silicate oligomers and phenolic resin. After carbonization of phenolic resin in composite polymer–silica nanoparticles, the N,S-dually functionalized carbon–silica spheres are obtained.34
To further confirm the carbon core and silica shell structure, the N,S-functionalized carbon–silica core–shell spheres were calcined in air to remove the carbon cores. Fig. 5a and b show the TEM images of N,S-CSS–silica and N,S-CSR-1–silica, respectively. Uniform hollow silica capsules with particle size of about 210 nm and the shell thickness of about 8 nm are observed in the case of N,S-CSS–silica (Fig. 5a), indicating that the calcination in air resulted in the formation of hollow structure. Particularly, the dimension of the hollow spheres decreased tremendously as compared with that of the N,S-CSS core–shell spheres (Fig. 5b). This decrease can be attributed to the shrinkage of the shell and pores during calcination. As presented in Fig. 5b and Table S3,† the hydrothermally-treated silica nanoparticles (N,S-CSR-1–silica) exhibit raspberry-like structure. The diameter of hollow silica spheres is of about 195 nm and the shell thickness is of about 20 nm. Hydrothermal treatment causes also an increase in the surface roughness, wall thickness and structural shrinkage of hollow silica spheres. Note that the mean particle size and the mean shell thickness can be also adjusted by adjusting the molar concentrations of TESPTS and 3-aminophenol. As the amount of TESPTS increases as evidenced by variation of the molar ratio of TESPTS/AP from 0.48 to 1.92, the size of hollow silica spheres tends to decrease from 270 nm to 151 nm (see Fig. 5, S6, and Table S3†). This is consistent with the trend of the particle size of N,S-functionalized carbon–silica spheres, confirming that the formation of core–shell structures with carbon cores and silica shells.
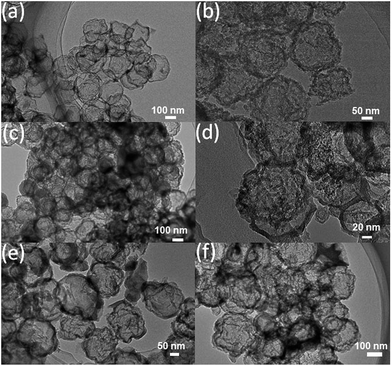 | ||
| Fig. 5 TEM images of air-annealed (a) N,S-CSS–silica; (b) N,S-CSR-1–silica; (c) N,S-CSR-2–silica; (d) N,S-CSR-3–silica; (e) N,S-CSR-4–silica; (f) N,S-CSR-5–silica. | ||
The CO2 capture has attracted a great attention in recent years due to the need of reducing the concentration of greenhouse gases that causes the observed climate changes. The CO2 adsorption isotherm measured on N,S-CSR-1 spheres with largest surface area (548 m2 g−1) and highest nitrogen content shows highest capacity of 67 cm3 g−1 at 0 ± 1 °C and 1.0 bar (Fig. 6). After increasing the molar amount of TESPTES and decreasing the molar amount of 3-aminophenol, the CO2 uptakes obtained for N,S-CSR-3 and N,S-CSR-5 are smaller, 64 cm3 g−1 and 60 cm3 g−1 at 0 ± 1 °C and 1.0 bar, respectively (Fig. 6). This implies that the smaller surface area with fewer exposed N-containing basic sites can reduce the CO2 capacity.35,36 These carbon–silica spheres are one of the most efficient CO2 storage adsorbents among carbonaceous materials (Table S4†).
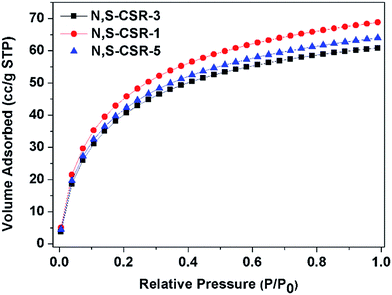 | ||
| Fig. 6 CO2 adsorption isotherms (T = 0 ± 1 °C) measured for N,S-functionalized carbon-silica spheres N,S-CSR-1, N,S-CSR-3, N,S-CSR-5. | ||
Inspired by high surface area and high nitrogen content of the carbon–silica core–shell spheres, we studied their electrochemical properties by cyclic voltammetry (CV). The particle size, surface area, microporosity and nitrogen-doping usually have a great impact on the capacitance.37,38 Fig. S7† shows the CV curves recorded for N,S-CSS and N,S-CSR-1 using a three-electrode system in the range from −0.8 V to 0.0 V (vs. Ag/AgCl) at different scan rates. As can be seen from this figure the cyclic voltammetry (CV) plots measured for N,S-CSS under basic conditions (6 M KOH) exhibit a nearly rectangular shape at a voltage scan rate up to 200 mV s−1, revealing a double-layer capacitance performance and outstanding high rate capability. The specific capacitance of N,S-CSS is 221 F g−1 (Fig. S7 and Table S5†) because of high surface area and nitrogen doping in the carbon framework. Although the surface area of N,S-CSR-1 is higher than the surface area of N,S-CSS, the former exhibits lower capacitance (about 111 F g−1) than that of N,S-CSS (Fig. S7 and Table S5†). This is probably due to the fact that the hydrothermal treatment resulted in the formation of more nucleated and non-conductive silica nanoparticles on the surface of carbon spheres making ion transportation and diffusion in the carbon spheres of N,S-CSR-1 more difficult than that in N,S-CSS. The two-electrode electrochemical measurements carried out for N,S-CSR-1 and N,S-CSS under acidic conditions show moderate performance (Fig. S8, 9, Tables S6 and S7†).
Conclusions
In summary, we have successfully synthesized polymer–silica nanospheres using the extended Stöber method via triconstituent co-assembly of 3-aminophenol, formaldehyde, and TESPTS. Further carbonization of the resulting polymer–silica spheres generated N,S-functionalized carbon–silica nanospheres. Moreover, this study shows that the particle size of monodisperse carbon–silica spheres and hollow silica spheres can be tailored through adjusting the molar ratio of TESPTS/PR. It is shown that the prepared carbon–silica spheres exhibit excellent performance as adsorbents for CO2 capture (67 cm3 g−1 at 0 ± 1 °C and 1.0 bar) and as supercapacitor electrode with high specific capacitance in basic media (221 F g−1, 6 M KOH) due to high surface area and nitrogen-doping. Therefore, it is anticipated that N,S-functionalized carbon–silica spheres are very promising not only as supercapacitor electrodes and CO2 adsorbents but also in other multi-purpose applications such as catalyst supports, drug delivery carriers and hard templates. Our method allows for control of the growth of silica nanoparticles onto carbon cores to obtain the core–shell carbon–silica spheres and for tailoring their surface functionality, roughness, and porous structures; all these properties cannot be achieved by using the currently existing synthetic methods.Acknowledgements
The authors acknowledge the Curtin University Electron Microscope Laboratories, partially funded by the University, State and Commonwealth Governments. The authors also wish to the Australian Microscopy & Microanalysis Research Facility at the Centre for Microscopy, Characterisation & Analysis, the University of Western Australia, funded by the University, State and Commonwealth Governments. S. Liu acknowledges the support from the Australian Research Council Future Fellowship (FT12100178).Notes and references
- J. Liu, S. Z. Qiao, Q. H. Hu and G. Q. Lu, Small, 2011, 7, 425–443 CrossRef CAS PubMed
.
- J. Liu, S. Z. Qiao, J. S. Chen, X. W. Lou, X. Xing and G. Q. Lu, Chem. Commun., 2011, 47, 12578–12591 RSC
.
- A. Guerrero-Martinez, J. Perez-Juste and L. M. Liz-Marzan, Adv. Mater., 2010, 22, 1182–1195 CrossRef CAS PubMed
.
- J. Liu, N. P. Wickramaratne, S. Z. Qiao and M. Jaroniec, Nat. Mater., 2015, 14, 763–774 CrossRef CAS PubMed
.
- G.-H. Wang, J. Hilgert, F. H. Richter, F. Wang, H.-J. Bongard, B. Spliethoff, C. Weidenthaler and F. Schüth, Nat. Mater., 2014, 13, 293–300 CrossRef CAS PubMed
.
- X. Li and J. He, ACS Appl. Mater. Interfaces, 2013, 5, 5282–5290 CAS
.
- Y. Ahmad Nor, Y. Niu, S. Karmakar, L. Zhou, C. Xu, J. Zhang, H. Zhang, M. Yu, D. Mahony, N. Mitter, M. A. Cooper and C. Yu, ACS Cent. Sci., 2015, 1, 328–334 CrossRef CAS
.
- S. S. Acharyya, S. Ghosh and R. Bal, ACS Appl. Mater. Interfaces, 2014, 6, 14451–14459 CAS
.
- X. Du, X. M. Liu, H. M. Chen and J. H. He, J. Phys. Chem. C, 2009, 113, 9063–9070 CAS
.
- R. Demir-Cakan, N. Baccile, M. Antonietti and M.-M. Titirici, Chem. Mater., 2009, 21, 484–490 CrossRef CAS
.
- W. Stöber, A. Fink and E. Bohn, J. Colloid Interface Sci., 1968, 26, 62–69 CrossRef
.
- J. Liu, S. Z. Qiao, H. Liu, J. Chen, A. Orpe, D. Zhao and G. Q. Lu, Angew. Chem., Int. Ed., 2011, 50, 5947–5951 CrossRef CAS PubMed
.
- A. H. Lu, G. P. Hao and Q. Sun, Angew. Chem., Int. Ed., 2011, 50, 9023–9025 CrossRef CAS PubMed
.
- A. B. Fuertes, P. Valle-Vigon and M. Sevilla, Chem. Commun., 2012, 48, 6124–6126 RSC
.
- X. H. Zhang, Y. A. Li and C. B. Cao, J. Mater. Chem., 2012, 22, 13918–13921 RSC
.
- J. Choma, D. Jamiola, K. Augustynek, M. Marszewski, M. Gao and M. Jaroniec, J. Mater. Chem., 2012, 22, 12636–12642 RSC
.
- Z. A. Qiao, B. Guo, A. J. Binder, J. Chen, G. M. Veith and S. Dai, Nano Lett., 2013, 13, 207–212 CrossRef CAS PubMed
.
- B. Guan, X. Wang, Y. Xiao, Y. Liu and Q. Huo, Nanoscale, 2013, 5, 2469–2475 RSC
.
- J. Zang, T. An, Y. Dong, X. Fang, M. Zheng, Q. Dong and N. Zheng, Nano Res., 2015, 8, 2663–2675 CrossRef CAS
.
- J.-C. Song, F.-F. Xue, Z.-Y. Lu and Z.-Y. Sun, Chem. Commun., 2015, 51, 10517–10520 RSC
.
- R. Liu, Y. W. Yeh, V. H. Tam, F. Qu, N. Yao and R. D. Priestley, Chem. Commun., 2014, 50, 9056–9059 RSC
.
- R. Liu, F. Qu, Y. Guo, N. Yao and R. D. Priestley, Chem. Commun., 2014, 50, 478–480 RSC
.
- S. Mezzavilla, C. Baldizzone, K. J. Mayrhofer and F. Schuth, ACS Appl. Mater. Interfaces, 2015, 7, 12914–12922 CAS
.
- X. Ma, L. Gan, M. Liu, P. K. Tripathi, Y. Zhao, Z. Xu, D. Zhu and L. Chen, J. Mater. Chem. A, 2014, 2, 8407–8415 CAS
.
- P. K. Tripathi, M. Liu, Y. Zhao, X. Ma, L. Gan, O. Noonan and C. Yu, J. Mater. Chem. A, 2014, 2, 8534–8544 CAS
.
- M. Liu, X. Ma, L. Gan, Z. Xu, D. Zhu and L. Chen, J. Mater. Chem. A, 2014, 2, 17107–17114 CAS
.
- D. Zhu, Y. Wang, L. Gan, M. Liu, K. Cheng, Y. Zhao, X. Deng and D. Sun, Electrochim. Acta, 2015, 158, 166–174 CrossRef CAS
.
- Y. Zhao, M. Liu, X. Deng, L. Miao, P. K. Tripathi, X. Ma, D. Zhu, Z. Xu, Z. Hao and L. Gan, Electrochim. Acta, 2015, 153, 448–455 CrossRef CAS
.
- M. Liu, J. Qian, Y. Zhao, D. Zhu, L. Gan and L. Chen, J. Mater. Chem. A, 2015, 3, 11517–11526 CAS
.
- T. Y. Yang, J. Liu, R. F. Zhou, Z. G. Chen, H. Y. Xu, S. Z. Qiao and M. J. Monteiro, J. Mater. Chem. A, 2014, 2, 18139–18146 CAS
.
- S. A. Wohlgemuth, F. Vilela, M. M. Titirici and M. Antonietti, Green Chem., 2012, 14, 741–749 RSC
.
- S. Gupta, B. R. Weiner and G. Morell, J. Mater. Res., 2003, 18, 363–381 CrossRef CAS
.
- J. Liu, Q. H. Yang, L. Zhang, D. M. Jiang, X. Shi, J. Yang, H. Zhong and C. Li, Adv. Funct. Mater., 2007, 17, 569–576 CrossRef CAS
.
- R. Liu, Y. Shi, Y. Wan, Y. Meng, F. Zhang, D. Gu, Z. Chen, B. Tu and D. Zhao, J. Am. Chem. Soc., 2006, 128, 11652–11662 CrossRef CAS PubMed
.
- M. Sevilla, P. Valle-Vigon and A. B. Fuertes, Adv. Funct. Mater., 2011, 21, 2781–2787 CrossRef CAS
.
- W. Xing, C. Liu, Z. Y. Zhou, L. Zhang, J. Zhou, S. P. Zhuo, Z. F. Yan, H. Gao, G. Q. Wang and S. Z. Qiao, Energy Environ. Sci., 2012, 5, 7323–7327 CAS
.
- D. W. Wang, F. Li, M. Liu, G. Q. Lu and H. M. Cheng, Angew. Chem., Int. Ed., 2008, 47, 373–376 CrossRef CAS PubMed
.
- T. Yang, R. Zhou, D. W. Wang, S. P. Jiang, Y. Yamauchi, S. Z. Qiao, M. J. Monteiro and J. Liu, Chem. Commun., 2015, 51, 2518–2521 RSC
.
Footnote |
| † Electronic supplementary information (ESI) available: The characterization data including the BET surface area, XPS patterns, and elemental mapping for polymer–silica, carbon–silica, and the CV profiles of carbon–silica spheres. See DOI: 10.1039/c5ta09157h |
| This journal is © The Royal Society of Chemistry 2016 |

