 Open Access Article
Nitrogen-enriched, ordered mesoporous carbons for potential electrochemical energy storage†
Jinhui
Zhu
a,
Jun
Yang
*a,
Rongrong
Miao
a,
Zhaoquan
Yao
b,
Xiaodong
Zhuang
*b and
Xinliang
Feng
c
aShanghai Electrochemical Energy Devices Research Center, School of Chemistry and Chemical Engineering, Shanghai Jiao Tong University, Shanghai 200240, P. R. China. E-mail: yangj723@sjtu.edu.cn
bShanghai Key Lab of Electrical Insulation, Thermal Ageing & Shanghai Electrochemical Energy Devices Research Center, School of Chemistry and Chemical Engineering, Shanghai Jiao Tong University, Shanghai 200240, P. R. China. E-mail: zhuang@sjtu.edu.cn
cCenter for Advancing Electronics Dresden (cfaed), Department of Chemistry and Food Chemistry, Technische Universität Dresden, 01062 Dresden, Germany
First published on 11th January 2016
Abstract
Nitrogen-doped (N-doped) porous carbons have drawn increasing attention due to their high activity for electrochemical catalysis, and high capacity for lithium-ion (Li-ion) batteries and supercapacitors. So far, the controlled synthesis of N-enriched ordered mesoporous carbons (N-OMCs) for Li-ion batteries is rarely reported due to the lack of a reliable nitrogen-doping protocol that maintains the ordered mesoporous structure. In order to realize this, in this work, ordered mesoporous carbons with controllable N contents were successfully prepared by using melamine, F127 and phenolic resin as the N-source, template and carbon-source respectively via a solvent-free ball-milling method. The as-prepared N-OMCs which showed a high N content up to 31.7 wt% were used as anodes for Li-ion batteries. Remarkably, the N-OMCs with an N content of 24.4 wt% exhibit the highest reversible capacity (506 mA h g−1) even after 300 cycles at 300 mA g−1 and a capacity retention of 103.3%. N-OMCs were also used as electrode materials in supercapacitors and a capacity of 150 F g−1 at 0.2 A g−1 with stable cycling up to 2500 times at 1 A g−1 was achieved. These attractive results encourage the design and synthesis of high heteroatom content ordered porous carbons for applications in the field of energy storage and conversion.
Introduction
Shortage of fossil fuels forces researchers from both academia and industry to develop sustainable clean energy devices. In order to achieve this aim, a great deal of research effort has been directed towards lithium ion batteries (LIBs) and supercapacitors due to their long cycle life, high energy density and low toxicity.1–5 Among the numerous electrode materials for LIBs and supercapacitors, porous carbon materials,6–13 especially ordered mesoporous carbons (OMCs),14–18 have attracted tremendous attention owing to their unique structures, such as ordered mesoporous structure, high surface area and large pore volume. Two strategies have been developed to synthesize OMCs: the hard template (e.g., SBA-15 (ref. 19–22)) method and the soft template (e.g., Pluronic F127 (ref. 17 and 23–25)) method. Although the hard template method is one good pore replicating way to porous carbons, it is time-consuming, costly and environmentally harmful due to the usage of aqueous HF as the etching agent.14,19 The soft template method has become one optimal choice since the solvent-free route to OMCs avoids organic solvents.26 OMCs based on the soft template method have been developed to gain enhanced lithium storage performance, such as reversible capacity and initial coulombic efficiency.15In the past decade, heteroatom-doped (such as boron,27–29 nitrogen,29–35 phosphorous,29,36 and sulfur37) porous carbons have been proposed as active materials for electrochemical catalyzed oxygen reduction reaction,29,36,37 supercapacitors,27,28,31,32,35,38 dye-sensitized solar cells,33 CO2 capture34,35 and batteries.30,37 Among these materials, nitrogen-doped (N-doped) porous carbons are the most favourable candidates for LIBs due to the larger electronegativity for nitrogen (i.e., 3.5) than that for carbon (i.e., 3.0), which may result in stronger interactions between N-doped carbon and lithium ions and thereby facilitate lithium ion insertion.7,13 Mao et al.13 and Zheng et al.7 have proved that a high N content of porous carbons usually improves lithium storage performance. However, the synthesis of rich N-doped OMCs by the conventional soft template method (the evaporation-induced self-assembly (EISA) technique35,39 or hydrothermal procedure40) is unapproachable due to the limited solubility of the N-source in the organic solvent. Thereby, the synthesis of N-doped OMCs with a reliable controlling protocol for controlled N content with undestroyed ordered porous structures is desperate.
Herein, we report a green chemical ball-milling strategy to synthesize N-enriched ordered mesoporous carbons (N-OMCs) by using melamine, F127 and phenolic resin as the N-source, template and carbon-source, respectively. The N contents of N-OMCs can be controlled to be 6.3 wt%, 12.8 wt%, 19.9 wt%, 24.4 wt% and 31.7 wt%. The excellent hexagonal mesoporous structure and uniform nitrogen distribution of N-OMCs have been revealed by transmission electron microscopy (TEM), nitrogen physisorption, X-ray diffraction (XRD) patterns and others. Remarkably, the N-OMCs based LIBs exhibited N content relied performance under the premise of maintaining the pore structure (N%: 6.3–24.4 wt%). Besides, the N-OMCs based LIBs exhibited the highest initial coulombic efficiency up to 66.2%, reversible capacity up to 506 mA h g−1 and coulombic efficiency of 99.5% with a current density of 300 mA g−1 for 300 cycles.
Experimental section
All of the reagents were purchased from Aldrich and Titan and used without further purification.Synthesis of nitrogen-enriched ordered mesoporous carbons (N-OMCs)
N-OMCs were prepared by a green chemical ball-milling method. Typically, resorcinol (0.44 g, 4.0 mmol), terephthalaldehyde (0.56 g, 4.0 mmol), Pluronic F127 (1.50 g, Mw = 12![[thin space (1/6-em)]](https://www.rsc.org/images/entities/char_2009.gif) 600) and melamine (X g, X = 1, 2, 3, 4, and 5) were mixed and followed by ball-milling at a rotation speed of 200 rpm for 15 min. The obtained colloidal samples were placed in a corundum boat and allowed to age at 80 °C for 5 h and 100 °C for another 5 h. The obtained hard pinky solids were melamine blended ordered mesoporous polymers (Melamine-OMP-X, X = 1, 2, 3, 4, and 5). Then, Melamine-OMPs were pyrolyzed at 600 °C under an inert atmosphere for 3 h. After grinding, N-enriched ordered mesoporous carbons (N-OMC-X, X = 1, 2, 3, 4, and 5) were produced. The ordered mesoporous polymer and carbon (OMP and OMC) were synthesized as the control sample by using the same procedure without using melamine. For proof-of-concept, N-OMC-4 was pyrolyzed at 900 °C in a nitrogen atmosphere for 2 h and in an ammonia atmosphere for 15 min. The as-produced N-doped porous carbon was denoted as N-OMC-4-900.
600) and melamine (X g, X = 1, 2, 3, 4, and 5) were mixed and followed by ball-milling at a rotation speed of 200 rpm for 15 min. The obtained colloidal samples were placed in a corundum boat and allowed to age at 80 °C for 5 h and 100 °C for another 5 h. The obtained hard pinky solids were melamine blended ordered mesoporous polymers (Melamine-OMP-X, X = 1, 2, 3, 4, and 5). Then, Melamine-OMPs were pyrolyzed at 600 °C under an inert atmosphere for 3 h. After grinding, N-enriched ordered mesoporous carbons (N-OMC-X, X = 1, 2, 3, 4, and 5) were produced. The ordered mesoporous polymer and carbon (OMP and OMC) were synthesized as the control sample by using the same procedure without using melamine. For proof-of-concept, N-OMC-4 was pyrolyzed at 900 °C in a nitrogen atmosphere for 2 h and in an ammonia atmosphere for 15 min. The as-produced N-doped porous carbon was denoted as N-OMC-4-900.
Characterization
The powder X-ray diffraction (XRD) patterns were recorded on an X-ray diffractometer (D/max-2200/PC, Rigaku) using Cu-Kα radiation (λ = 0.15418 nm) at 40 kV. Fourier transform infrared (FTIR) spectra were collected on a Paragon 1000 spectrophotometer (Perkin-Elmer, Inc., USA). Raman spectra were measured by using a Thermo Scientific DXR Raman microscope with a laser wavelength of 532 nm at room temperature. Thermogravimetric analysis (TGA) was conducted on a TGA TA 2050 thermal analyser system, the temperature increased from 50 °C to 900 °C with 10 °C min−1 in the flow of nitrogen at a flow rate of 30 mL min−1. The scanning electron microscopy (SEM) and the transmission electron microscopy (TEM) images were recorded on a field emission scanning electron microscope (FESEM, JEOL JSM-7401F) and a transmission electron microscope (TEM, JOEL JEM-100CX), respectively. Nitrogen adsorption–desorption isotherms were obtained on an ASAP 2010 Accelerated Surface Area and Porosimetry System (Micromeritics Inc., USA) at 77 K; all samples were degassed in a vacuum at 200 °C overnight prior to the measurements. The X-ray photoelectron spectroscopy (XPS) spectra were acquired using a Kratos Axis UltraDLD spectrometer (Kratos Analytical-A Shimadzu Group Company) with a monochromatic Al-Kα source (1486.6 eV). Elemental analysis (EA) was carried out using a Vario-EL Cube (Elementar) elemental analyser.Electrochemical measurements
Lithium storage performances of the samples were evaluated using 2016 coin-type cells with lithium metal as the counter and reference electrodes at room temperature. The working electrodes were prepared by using a slurry coating procedure. Typically, the as prepared OMC or N-OMCs (80 wt%), Super P (10 wt%) and polyvinylidene fluoride (PVDF) (10 wt%) were dispersed in N-methyl pyrrolidinone (NMP) (0.625 mL) and stirred for 12 h, spread over a copper foil and vacuum dried at 80 °C for 6 h. Finally, the work electrodes were obtained by punching the copper foil to Φ 12 mm sheets and further dried at 80 °C for 4 h. Test cells were assembled in an argon-filled glove box, ENTEK ET20-26 as the separator and the electrolyte was 1 mol L−1 LiPF6 in a mixture of ethylene carbonate (EC) and dimethyl carbonate (DMC) (1![[thin space (1/6-em)]](https://www.rsc.org/images/entities/char_2009.gif) :
:![[thin space (1/6-em)]](https://www.rsc.org/images/entities/char_2009.gif) 1 in volume ratio). All the cells were charged and discharged on a LAND battery test system (Wuhan Kingnuo Electronics Co., Ltd., China) at room temperature with the current densities of 100 mA g−1 for the initial two cycles and 300 mA g−1 for the consequent cycles. The cut-off voltage was 0.01 V to 3.0 V versus Li/Li+. Cyclic voltammetry (CV) was measured on a CHI640D electrochemical station between 0.01 and 3.0 V with a scan rate of 0.1 mV s−1. Electrochemical impedance spectroscopy (EIS) measurements were performed on an AutoLAB 302N Impedance Analyser in the frequency range of 100 KHz to 0.01 Hz. The supercapacitor electrode was prepared by mixing N-OMC-4-900 (80 wt%), Super P (10 wt%) and polytetrafluoroethylene (PTFE) (10 wt%) in deionized water, spreading the obtained slurry on Ni foam, and finally drying at 60 °C in a vacuum for 6 h. It should be mentioned that a lower content of PTFE binder, such as conventional 5 wt%, cannot ensure the integrity of the electrode. The capacitive performance of the as-prepared electrode was evaluated using a conventional three-electrode system equipped with an Ag/AgCl reference electrode, a platinum counter electrode and a 6 M KOH solution electrolyte.
1 in volume ratio). All the cells were charged and discharged on a LAND battery test system (Wuhan Kingnuo Electronics Co., Ltd., China) at room temperature with the current densities of 100 mA g−1 for the initial two cycles and 300 mA g−1 for the consequent cycles. The cut-off voltage was 0.01 V to 3.0 V versus Li/Li+. Cyclic voltammetry (CV) was measured on a CHI640D electrochemical station between 0.01 and 3.0 V with a scan rate of 0.1 mV s−1. Electrochemical impedance spectroscopy (EIS) measurements were performed on an AutoLAB 302N Impedance Analyser in the frequency range of 100 KHz to 0.01 Hz. The supercapacitor electrode was prepared by mixing N-OMC-4-900 (80 wt%), Super P (10 wt%) and polytetrafluoroethylene (PTFE) (10 wt%) in deionized water, spreading the obtained slurry on Ni foam, and finally drying at 60 °C in a vacuum for 6 h. It should be mentioned that a lower content of PTFE binder, such as conventional 5 wt%, cannot ensure the integrity of the electrode. The capacitive performance of the as-prepared electrode was evaluated using a conventional three-electrode system equipped with an Ag/AgCl reference electrode, a platinum counter electrode and a 6 M KOH solution electrolyte.
Results and discussion
Material characterization
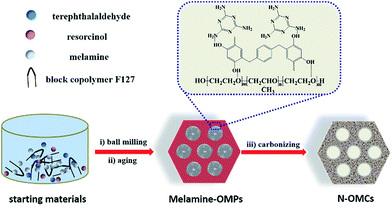
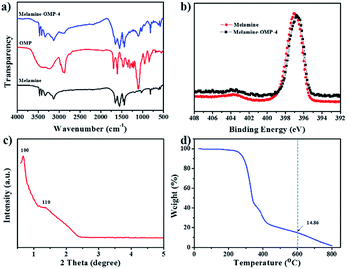
N-enriched ordered mesoporous carbons (N-OMCs) were prepared by a green chemical ball-milling method (Scheme 1). Resorcinol and terephthalaldehyde, melamine and block copolymers Pluronic F-127 were used as the carbon source, N source and soft template, respectively. After one step of the ball-milling process for 15 min, the as-produced jelly was further treated under 80 and 100 °C for total 10 h before pyrolysis under 600 °C for 3 h. This green chemical method for the preparation of ordered mesoporous carbons not only successfully realizes the N doping but also can scale up the preparation of N-OMCs without any by-products.In order to study the structure properties of Melamine-OMPs, Fourier transform infrared (FTIR) spectroscopy, X-ray photoelectron spectroscopy (XPS), small angle X-ray diffraction (XRD) and thermogravimetric analysis (TGA) were carried out. Due to the similarity, Melamine-OMP-4 was discussed as the representative example hereafter if not stated. From the FTIR spectra in Fig. 1a, the transmittance peak at 1554 cm−1 for Melamine-OMP-4 can be attributed to the stretching vibration of the C![[double bond, length as m-dash]](https://www.rsc.org/images/entities/char_e001.gif) N bond which indicates the successfully introduction of melamine into the ordered porous polymer structure.39 Two peaks (403.5 and 396.8 eV) can be observed from the N 1s XPS spectrum of Melamine-OMP-4 in Fig. 1b, which correspond to amino N and 1,3,5-triazine N, suggesting the existence of melamine in Melamine-OMP-4. Two intense peaks located at a 2θ value of 0.68° and 1.36° can be easily found in small angle XRD patterns (Fig. 1c), which are indexed to (100) and (110) of a two-dimensional (2D) hexagonal mesoporous structure (p6m).23 All these results indicate the successful preparation of the melamine blended ordered mesoporous structure for Melamine-OMPs. Based on the TGA curve of Melamine-OMP-4, two distinct weight losses located between 250–350 °C and 350–400 °C can be ascribed to the partial sublimation of melamine and the decomposition of F127, respectively (Fig. 1d).39,41 Upon increasing to 600 °C, 14.9% weight is maintained, suggesting the possible carbon-precursor nature of Melamine-OMPs.
N bond which indicates the successfully introduction of melamine into the ordered porous polymer structure.39 Two peaks (403.5 and 396.8 eV) can be observed from the N 1s XPS spectrum of Melamine-OMP-4 in Fig. 1b, which correspond to amino N and 1,3,5-triazine N, suggesting the existence of melamine in Melamine-OMP-4. Two intense peaks located at a 2θ value of 0.68° and 1.36° can be easily found in small angle XRD patterns (Fig. 1c), which are indexed to (100) and (110) of a two-dimensional (2D) hexagonal mesoporous structure (p6m).23 All these results indicate the successful preparation of the melamine blended ordered mesoporous structure for Melamine-OMPs. Based on the TGA curve of Melamine-OMP-4, two distinct weight losses located between 250–350 °C and 350–400 °C can be ascribed to the partial sublimation of melamine and the decomposition of F127, respectively (Fig. 1d).39,41 Upon increasing to 600 °C, 14.9% weight is maintained, suggesting the possible carbon-precursor nature of Melamine-OMPs.
To gain insight into N-OMCs, elemental analysis, XRD patterns and Raman spectra were employed. The nitrogen content (wt%) analysis for the as-prepared N-OMCs is illustrated in Fig. 2a. It is noticeable that the nitrogen content of N-OMC-5 reaches 31.7 wt%, which is much higher than the reported value.35,42 In addition, the nitrogen contents for N-OMCs increase along with the increase in the amount of starting melamine in the preparation procedure. Therefore, it is a reliable way to prepare N-doped porous carbons with controllable N contents. According to the small angle XRD of N-OMCs in Fig. 2b, all of the samples show two distinct peaks which can be indexed to (100) and (110) of 2D hexagonal mesostructures (p6m).43 With the increase of nitrogen content from N-OMC-1 to N-OMC-5, the intensity of the diffraction peaks reduces significantly. This result indicates that the decline of ordering degree of the mesostructures due to the increased melamine breaks the continuity of the ordered structures. The calculated unit cell parameters of OMC and N-OMC-X (X = 1–5) were 11.0, 10.5, 11.8, 12.0, 12.7 and 12.3 nm (Table 1), respectively. The increased trend implies the expansion of mesostructures,35 caused by dispersed melamine in resin frameworks that increased the distance of polymer chains. The wide angle XRD patterns of N-OMCs (Fig. 2c) exhibit one obvious broad characteristic peak around 22.36–23.68° and another relatively weak peak around 43.62–43.80° which can be ascribed to the graphite (002) and (101) interlayers.39,44 The d-spacing (002) of the samples was 0.35–0.40 nm calculated by the Bragg law, which is little larger than that of graphite (0.34 nm). The (002) peak shifted to a larger angle with the increase of nitrogen content, which also indicates the reduction of the interlayer distance. In addition, the characterized peak of other nitrogen species (e.g., C3N4) was not found in the XRD patterns.41,45
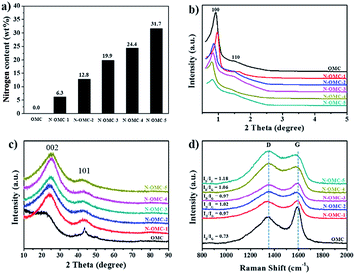 | ||
| Fig. 2 Structure analysis of OMC and N-OMCs. (a) Nitrogen weight contents (wt%) based on elemental analysis; (b) small angle and (c) wide angle XRD patterns; (d) Raman spectra. | ||
| S BET | S m | V tot | V m | D | a 0 | t | η | |
|---|---|---|---|---|---|---|---|---|
| m2 g−1 | cm3 g−1 | nm | % | |||||
a Note: (sample 1–6: N-OMC-1, N-OMC-2, N-OMC-3, N-OMC-4, N-OMC-5, N-OMC).
b Surface area calculated by the BET method.
c Micropore area calculated by the V–t method.
d Total pore volume at p/p0 = 0.995.
e Micropore volume.
f Average pore size calculated by using the NL-DFT model.
g Unit cell parameter calculated on the basis of hexagonal unit cell: a0 = 2d100/31/2 and d100 calculated from the Bragg law on the positions of the 2θ reflection lines: d100 = λ/2![[thin space (1/6-em)]](https://www.rsc.org/images/entities/char_2009.gif) sin(2θ/2).
h Pore wall thickness calculated from: t = a0 − D.
i Initial coulombic efficiency for LIBs. sin(2θ/2).
h Pore wall thickness calculated from: t = a0 − D.
i Initial coulombic efficiency for LIBs.
|
||||||||
| 1 | 451 | 362 | 0.24 | 0.14 | 2.0 | 10.5 | 8.5 | 39.7 |
| 2 | 466 | 344 | 0.26 | 0.14 | 2.2 | 11.8 | 9.6 | 46.2 |
| 3 | 233 | 175 | 0.17 | 0.07 | 2.9 | 12.0 | 9.1 | 57.9 |
| 4 | 251 | 183 | 0.23 | 0.07 | 3.7 | 12.7 | 9.0 | 66.2 |
| 5 | 40 | 0 | 0.20 | 0 | 19.8 | 12.3 | — | 60.1 |
| 6 | 651 | 253 | 0.44 | 0.07 | 2.7 | 11.0 | 8.3 | 24.8 |
Raman spectroscopy is an efficient diagnostic tool to observe the subtle structural variation of the carbon-based materials. The G-band with E2g symmetry at around 1595 cm−1 is related to sp2 carbon and the D-band with A1g symmetry at around 1310 cm−1 is assigned to atomic displacement, disordered carbon, edge defect and other defects (sp3 carbon, dangling carbon and vacancies, etc.). A ratio of D band to G band (ID/IG) can reflect the degree of crystallinity of carbon materials.6,9,46 An obvious increase of ID/IG can be observed with the enhanced nitrogen contents in N-OMCs (Fig. 2d), which indicates that more defects are generated with the increasing nitrogen content. Interestingly, the D band and G band for OMC and N-OMCs are about 1350 and 1587 cm−1, respectively. These features make the as-prepared materials promising candidates for lithium ion battery anodes due to the high nitrogen content and well controlled ordered mesoporous structure.
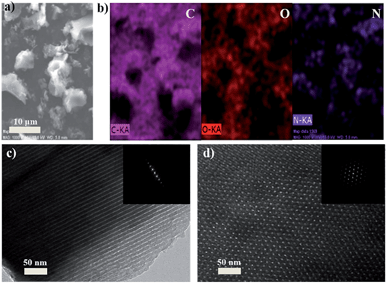
The morphology and microstructure of the as-prepared samples were investigated by field emission scanning electron microscopy (SEM) and transmission electron microscopy (TEM). The SEM image and elemental mapping for N-OMC-4 are shown in Fig. 3a and b, respectively. N-OMC-4 exhibits irregularly polyhedral particles with the size range from hundreds of nanometers to ten micrometers. The elemental mapping illustrates the uniformly distributed nitrogen, carbon and oxygen in N-OMC-4. TEM images and the corresponding Fast Fourier Transformation (FFT) diffractograms of N-OMC-4 were also revealed. The ordered arrangement of mesopores with long-range periodicity over large domains viewed from (110) (Fig. 3c) and (001) (Fig. 3d) directions could be observed. All these results indicate the successful preparation of N-OMC-4 with 2D hexagonal mesostructures (p6m). The TEM and FFT images of other samples are illustrated in Fig. S1.† All of the samples exhibit similar well-ordered 2D hexagonal mesostructures (p6m) in large domains.
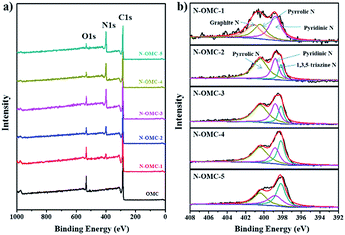
The chemical nature of N-OMCs was further investigated by XPS. Only two peaks at about 285 eV and 533 eV, which are ascribed to C and O, respectively, can be detected from OMC for the XPS survey spectrum (Fig. 4a). Three peaks at about 285 eV, 400 eV and 533 eV which attribute to C, N and O are detected from N-OMCs. All of N 1s XPS spectra of N-OMC-X (X = 2–5) (Fig. 4b) can be deconvoluted into three peaks at 398.2, 398.8 and 400.4 eV which are ascribed to 1,3,5-triazine N, pyridinic N and pyrrolic N, respectively.31,39,43 Unlike N-OMC-X (X = 2–5), N-OMC-1 exhibits graphite-like N and no 1,3,5-triazine N. The graphite-like N bonded with three sp2 carbons was mostly located inside the graphite carbon plane that will lead to the shift of D band in the Raman spectrum, while the presence of pyridinic N and pyrrolic N will broaden the Raman peak.13 These results are consistent with the Raman spectra. The contents of varied nitrogen species for each sample are listed in Table S1.†
The porous nature of OMC and N-OMCs is confirmed from nitrogen physisorption measurements. The nitrogen adsorption–desorption isotherms for OMC and N-OMCs are illustrated in Fig. 5. All of the as-prepared materials exhibit typical type-IV curves with small H2 hysteresis loops, associated with the adsorption and desorption behaviour of cage-like mesoporous structures.32,35,39 The distinct capillary condensation steps further confirm the mesoporous structures of the samples. OMC and N-OMCs also exhibit a very high absorbed volume at low relative pressure (p/p0), which indicates the characteristics of well-developed microporosity.33 The unclosed adsorption and desorption isotherms of the N-OMCs can be attributed to the strong interaction between N2 and N-contained functional groups existing in the micropore surface of the materials.24 The pore size distributions of the as-prepared materials calculated by using the NL-DFT model are shown in the inset of their corresponding adsorption/desorption isotherms. N-OMC-X (X = 1–4) shows micropore and mesopore distribution while N-OMC-5 exhibits mesopore and little macropore distribution. According to this, the average pore sizes of N-OMC-X (X = 1–5) are about 2.0, 2.2, 2.9, 3.7 and 19.8 nm, respectively. The nitrogen physisorption properties of OMC and N-OMCs are summarized in Table 1. The Brunauer–Emmett–Teller (BET) surface area, pore volume and pore size of OMC are 651 m2 g−1, 0.44 cm3 g−1, and 2.7 nm, respectively. With an increased nitrogen content in the samples from 6.3 wt% to 31.7 wt%, the BET surface area, pore volume as well as the micropore volume decrease, which could be caused by the fact that a high content of melamine results in breaking of ordered mesopore structures.
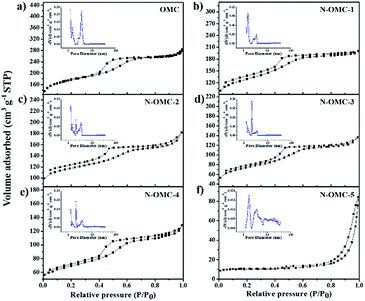 | ||
| Fig. 5 Nitrogen adsorption–desorption isotherms and the corresponding pore size distribution (insert) for OMC and N-OMCs. | ||
Lithium ion batteries testing
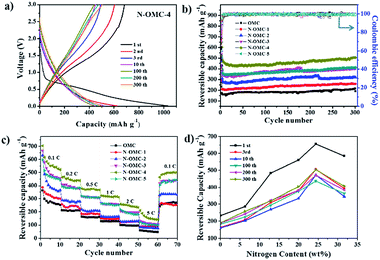
To gain insight into the lithium storage performance of the as-prepared materials, the electrodes of OMC and N-OMCs were prepared and compared. Especially, the electrochemical performance of N-OMC-4 is discussed as a representative example. Cyclic voltammograms of the N-OMC-4 electrode for the initial five cycles are recorded to survey the redox reactions with respect to the lithiation and delithiation processes (Fig. S2†). The reduction peak appearing at about 0.5 V in the first CV cycle is attributed to the decomposition of the electrolyte and formation of the solid-electrolyte-interface (SEI) film.9,13 The disappearance of this peak in the subsequent cycles implies that the as-formed SEI film is considerably robust which can avoid the direct contact between the N-OMC-4 electrode and electrolyte, thereby enhancing the reversible capacity and coulombic efficiency. Another reduction peak at ∼0 V can be ascribed to lithium ion intercalation into the N-OMC-4 electrode. Accordingly, the broad shoulder oxidation peak at 0.1–0.5 V is attributed to the extraction of lithium ions from the N-OMC-4 electrode, which also indicates an electrochemical double-layer capacitor (EDLC) charge–discharge process.14,47 All of the reduction and oxidation peaks overlap very well after the second CV cycle, indicating the good reversibility and stability. The lithium storage properties of N-OMCs were further investigated by galvanostatic charge–discharge measurements (Fig. 6a and S3†). As shown in Fig. 6a, the initial two charge–discharge curves of N-OMC-4 at 100 mA g−1 exhibit a plateau at ca. 0.8 V (vs. Li/Li+) which is primarily caused by the reaction of lithium with the electrolyte and followed by the formation of SEI films on the surface of N-OMC-4.13 Similar to CV cycles, this plateau disappears after the first cycle, indicating that the formation of SEI films has been completed. The first discharge and charge capacity of the N-OMC-4 electrode are calculated to be 1034 and 684 mA h g−1, respectively, corresponding to the initial coulombic efficiency of 66.2%. After 10 cycles, the discharge and charge capacities of the N-OMC-4 electrode are stabilized at 451 and 448 mA h g−1, and the coulombic efficiency reaches 99.3%. The charge capacity increases to 506 mA h g−1 and the coulombic efficiency remains at 99.4% after 300 cycles. The comprehensive calculated results of N-OMCs are listed in Table 1. Fig. 6b shows the galvanostatic cycling performance of N-OMCs at 100 mA g−1 for the initial two cycles and 300 mA g−1 from the 3rd to 300th cycles. All of the as-prepared samples exhibit excellent cyclability during the charge/discharge process. Their reversible capacities gradually increase after the 10th cycle which is related to the meso- and micropore nature of N-OMCs13 and the activating process of nitrogen-doped sites.6 The charge capacities of OMC and N-OMC-X (X = 1–5) at the 300th cycle are 191, 259, 319, 405, 506 and 408 mA h g−1, respectively. N-OMC-4 exhibits the highest charge capacity which is comparable to the reported N-doped carbon materials (listed in Table S2†).9,46 The rate capabilities of N-OMCs are illustrated in Fig. 6c. N-OMC-4 exhibits a reversible capacity of ∼520 mA h g−1 at a current density of 0.1C (1C = 372 mA g−1) and ∼150 mA h g−1 at 5C. Moreover, the reversible capacities of all the samples return to their original values when the current density turns back from 5C to 0.1C, suggesting the good stability of the as-prepared materials.6In order to understand the superior LIBs performance, the interfacial properties of OMC and N-OMCs are examined and compared. Nyquist plots of OMC and N-OMCs in Fig. S4† exhibit two semicircles at high-medium frequency and low frequency. The first semicircle mainly represents the SEI resistance, while the second one represents the charge transfer resistance.6,9,16 According to the equivalent circuit (inset in Fig. S4†), the electrolyte resistance (Rs), the SEI resistance (RSEI) and the charge transfer resistance (Rct) of OMC and N-OMCs are summarized in Table S3.† The RSEI and Rct of OMC are 240.1 and 173.9 Ω, respectively, which significantly decline after the introduction of nitrogen in N-OMCs. This result indicates that N-doping is one promising method to improve the interfacial properties of porous carbons for LIBs and other energy-related applications.
In order to establish a reliable relationship between LIBs performance and nitrogen contents, the correlation between reversible capacity and nitrogen contents of N-OMCs at different cycles (1st, 3rd, 10th, 100th, 200th and 300th) is shown in Fig. 6d. As illustrated, N-OMC-4 with a nitrogen content of 24.4 wt% exhibits the largest capacity. Although high content nitrogen-doping is a promising method for improving the capacity of LIBs, the porous structure is also critical. The higher nitrogen content (31.7 wt% for N-OMC-5) is not beneficial to the electrode performance due to its poor porosity (SBET = 33 m2 g−1). On the other hand, although the conductivity of OMCs can increase generally by enhancing the annealing temperature, it is found that the cycle capacity of the carbonized product from Melamine-OMP-4 declined significantly with an increased temperature from 600 °C to 900 °C (See Fig. S5†). Actually, several factors, such as conductivity, nitrogen content and pore structure, contributed to the final electrode performance. Here the nitrogen content is much more important than other factors.
Supercapacitor testing
For proof-of-concept, N-OMC-4-900 (the pyrolysis product of N-OMC-4, see Experimental part) was further used as the electrode material in supercapacitors. The cycle voltammetry of N-OMC-4-900 in 6 M KOH media shows a nearly rectangular shape, suggesting the double-layer capacitance behaviour (Fig. S8a†). The charge–discharge tests of N-OMC-4-900 are performed at current densities from 0.2 to 5.0 A g−1 (Fig. 7a) and the specific capacitance calculated from the charge–discharge curve is 150 F g−1 at 0.2 A g−1. As shown in Fig. 7b, a high cycling stability is achieved up to 2500 cycles at 1 A g−1. This promising electrochemical capacitance may be attributed to the high surface area (513 m2 g−1, Fig. S6† and Table S4†), rich nitrogen-doped active sites (5.0 wt%, Fig. S7†) and the high conductivity (Fig. S8b†) of N-OMC-4-900.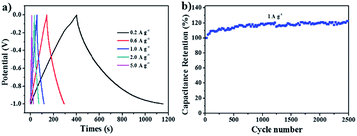 | ||
| Fig. 7 Capacitive performance of the N-OMC-4-900 electrode: (a) galvanostatic charge–discharge curves at different current densities in 6 M KOH; (b) cycle performance at 1.0 A g−1 for 2500 cycles. | ||
Conclusions
Ordered mesoporous carbons with controllable nitrogen contents (N-OMCs) were synthesized by a solvent-free ball-milling method using melamine, F127 and phenolic resin as the N-source, template and carbon-source, respectively. The highest nitrogen content of 31.7 wt% was obtained with maintained ordered mesoporous structure. As an anode material for LIBs, N-OMCs exhibit high reversible capacity and stable cycle performance. The N-OMC-4 with a nitrogen content of 24.4 wt% displays the initial coulombic efficiency as high as 66.2%, and a reversible capacity of 506 mA h g−1 after 300 cycles at 300 mA g−1. Furthermore, it is found that the specific capacities of N-OMCs are proportional to the N contents in a range of 6.3–24.4 wt%. Together with the promising supercapacitor performance (150 F g−1 at 0.2 A g−1), the as-developed nitrogen-doped ordered mesoporous carbon is promising for energy storage and conversion.Acknowledgements
The authors thank the financial support from 973 Programs of China (2014CB932303), Natural Science Foundation of China (51403126) and SJTU-UM Joint Research Project.Notes and references
- E. Yoo, J. Kim, E. Hosono, H.-S. Zhou, T. Kudo and I. Honma, Nano Lett., 2008, 8, 2277 CrossRef CAS PubMed.
- H. Li, Z. Wang, L. Chen and X. Huang, Adv. Mater., 2009, 21, 4593 CrossRef CAS.
- J. B. Goodenough and Y. Kim, Chem. Mater., 2010, 22, 587 CrossRef CAS.
- L. Ji, Z. Lin, M. Alcoutlabi and X. Zhang, Energy Environ. Sci., 2011, 4, 2682 CAS.
- X. Zhuang, F. Zhang, D. Wu and X. Feng, Adv. Mater., 2014, 26, 3081 CrossRef CAS PubMed.
- X. Liu, Y. Wu, Z. Yang, F. Pan, X. Zhong, J. Wang, L. Gu and Y. Yu, J. Power Sources, 2015, 293, 799 CrossRef CAS.
- F. Zheng, Y. Yang and Q. Chen, Nat. Commun., 2014, 5, 5261 CrossRef CAS PubMed.
- Z. Jiang, Z.-J. Jiang, X. Tian and L. Luo, Electrochim. Acta, 2014, 146, 455 CrossRef CAS.
- W. Ren, D. Li, H. Liu, R. Mi, Y. Zhang, L. Dong and L. Dong, Electrochim. Acta, 2013, 105, 75 CrossRef CAS.
- P. F. Fulvio, G. M. Veith, J. L. Adcock, S. S. Brown, R. T. Mayes, X. Wang, S. M. Mahurin, B. Guo, X.-G. Sun, A. A. Puretzky, C. M. Rouleau, D. B. Geohegan and S. Dai, J. Mater. Chem. A, 2013, 1, 9414 CAS.
- Y. Fang, Y. Lv, R. Che, H. Wu, X. Zhang, D. Gu, G. Zheng and D. Zhao, J. Am. Chem. Soc., 2013, 135, 1524 CrossRef CAS PubMed.
- L. Qie, W.-M. Chen, Z.-H. Wang, Q.-G. Shao, X. Li, L.-X. Yuan, X.-L. Hu, W.-X. Zhang and Y.-H. Huang, Adv. Mater., 2012, 24, 2047 CrossRef PubMed.
- Y. Mao, H. Duan, B. Xu, L. Zhang, Y. Hu, C. Zhao, Z. Wang, L. Chen and Y. Yang, Energy Environ. Sci., 2012, 5, 7950 CAS.
- H. Zhou, S. Zhu, M. Hibino, I. Honma and M. Ichihara, Adv. Mater., 2003, 15, 2107 CrossRef CAS.
- H.-Q. Li, R.-L. Liu, D.-Y. Zhao and Y.-Y. Xia, Carbon, 2007, 45, 2628 CrossRef CAS.
- M.-S. Kim, D. Bhattacharjya, B. Fang, D.-S. Yang, T.-S. Bae and J.-S. Yu, Langmuir, 2013, 29, 6754 CrossRef CAS PubMed.
- A. F. Leonard, C. J. Gommes, M. L. Piedboeuf, J. P. Pirard and N. Job, Microporous Mesoporous Mater., 2014, 195, 92 CrossRef CAS.
- D. Saikia, T.-H. Wang, C.-J. Chou, J. Fang, L.-D. Tsai and H.-M. Kao, RSC Adv., 2015, 5, 42922 RSC.
- R. Ryoo, S. H. Joo, M. Kruk and M. Jaroniec, Adv. Mater., 2001, 13, 677 CrossRef CAS.
- Y. Wang, B. Li, C. Zhang, H. Tao, S. Kang, S. Jiang and X. Li, J. Power Sources, 2012, 219, 89 CrossRef CAS.
- L. Shen, X. Zhang, E. Uchaker, C. Yuan and G. Cao, Adv. Energy Mater., 2012, 2, 691 CrossRef CAS.
- L. Zeng, C. Zheng, J. Xi, H. Fei and M. Wei, Carbon, 2013, 62, 382 CrossRef CAS.
- Y. Meng, D. Gu, F. Zhang, Y. Shi, H. Yang, Z. Li, C. Yu, B. Tu and D. Zhao, Angew. Chem., Int. Ed., 2005, 117, 7215 CrossRef.
- Y. Meng, D. Gu, F. Zhang, Y. Shi, L. Cheng, D. Feng, Z. Wu, Z. Chen, Y. Wan, A. Stein and D. Zhao, Chem. Mater., 2006, 18, 4447 CrossRef CAS.
- L. Borchardt, M. Oschatz, M. Lohe, V. Presser, Y. Gogotsi and S. Kaskel, Carbon, 2012, 50, 3987 CrossRef CAS.
- Q. W. Wang, Y. J. Mu, W. L. Zhang, L. S. Zhong, Y. Meng and Y. H. Sun, RSC Adv., 2014, 4, 32113 RSC.
- T. Kwon, H. Nishihara, H. Itoi, Q.-H. Yang and T. Kyotani, Langmuir, 2009, 25, 11961 CrossRef CAS PubMed.
- X. Zhai, Y. Song, J. Liu, P. Li, M. Zhong, C. Ma, H. Wang, Q. Guo and L. Zhi, J. Electrochem. Soc., 2012, 159, E177 CrossRef CAS.
- C. H. Choi, S. H. Park and S. I. Woo, ACS Nano, 2012, 6, 7084 CrossRef CAS PubMed.
- Y. Qu, Z. Zhang, X. Zhang, G. Ren, Y. Lai, Y. Liu and J. Li, Carbon, 2015, 84, 399 CrossRef CAS.
- X. Wang, C.-G. Liu, D. Neff, P. F. Fulvio, R. T. Mayes, A. Zhamu, Q. Fang, G. Chen, H. M. Meyer, B. Z. Jang and S. Dai, J. Mater. Chem. A, 2013, 1, 7920 CAS.
- W. Kim, M. Y. Kang, J. B. Joo, N. D. Kim, I. K. Song, P. Kim, J. R. Yoon and J. Yi, J. Power Sources, 2010, 195, 2125 CrossRef CAS.
- M. Chen, L.-L. Shao, Y.-P. Liu, T.-Z. Ren and Z.-Y. Yuan, J. Power Sources, 2015, 283, 305 CrossRef CAS.
- Z. Wu, P. A. Webley and D. Zhao, J. Mater. Chem., 2012, 22, 11379 RSC.
- J. Wei, D. Zhou, Z. Sun, Y. Deng, Y. Xia and D. Zhao, Adv. Funct. Mater., 2013, 23, 2322 CrossRef CAS.
- C. H. Choi, S. H. Park and S. I. Woo, J. Mater. Chem., 2012, 22, 12107 RSC.
- G.-l. Zhuang, J.-Q. Bai, X.-Y. Tao, J.-M. Luo, X.-D. Wang, Y.-F. Gao, X. Zhong, X.-N. Li and J.-G. Wang, J. Mater. Chem. A, 2015, 3, 20244 CAS.
- G. Lota, B. Grzyb, H. Machnikowska, J. Machnikowski and E. Frackowiak, Chem. Phys. Lett., 2005, 404, 53 CrossRef CAS.
- J. Yu, M. Guo, F. Muhammad, A. Wang, G. Yu, H. Ma and G. Zhu, Microporous Mesoporous Mater., 2014, 190, 117 CrossRef CAS.
- G.-P. Hao, W.-C. Li, S. Wang, G.-H. Wang, L. Qi and A.-H. Lu, Carbon, 2011, 49, 3762 CrossRef CAS.
- S. C. Yan, Z. S. Li and Z. G. Zou, Langmuir, 2009, 25, 10397 CrossRef CAS PubMed.
- S. Zhang, S. Tsuzuki, K. Ueno, K. Dokko and M. Watanabe, Angew. Chem., Int. Ed., 2015, 54, 1302 CrossRef CAS PubMed.
- J. Lu, X. Bo, H. Wang and L. Guo, Electrochim. Acta, 2013, 108, 10 CrossRef CAS.
- R. Liu, D. Wu, X. Feng and K. Mullen, Angew. Chem., Int. Ed., 2010, 49, 2565 CrossRef CAS PubMed.
- Y. C. Zhao, D. L. Yu, H. W. Zhou, Y. J. Tian and O. Yanagisawa, J. Mater. Sci., 2005, 40, 2645 CrossRef CAS.
- X. Li, J. Liu, Y. Zhang, Y. Li, H. Liu, X. Meng, J. Yang, D. Geng, D. Wang, R. Li and X. Sun, J. Power Sources, 2012, 197, 238 CrossRef CAS.
- Z. Li, N. Liu, X. Wang, C. Wang, Y. Qi and L. Yin, J. Mater. Chem., 2012, 22, 16640 RSC.
Footnote |
| † Electronic supplementary information (ESI) available. See DOI: 10.1039/c5ta09073c |
| This journal is © The Royal Society of Chemistry 2016 |

