Role of Pd nanoparticles in gas sensing behaviour of Pd@In2O3 yolk–shell nanoreactors†
Prabhakar
Rai
*a,
Ji-Wook
Yoon
b,
Chang-Hoon
Kwak
b and
Jong-Heun
Lee
*b
aDepartment of Chemical Engineering, Indian Institute of Technology Kanpur, Kanpur 208016, India. E-mail: prkrai@iitk.ac.in
bDepartment of Materials Science and Engineering, Korea University, Anam-Dong 5-1, Seoul 136-713, South Korea. E-mail: jongheun@korea.ac.kr
First published on 19th November 2015
Abstract
Pd@In2O3 yolk–shell nanoparticles (NPs) were synthesized by a simple solution route using Pd@C core–shell NPs as template and applied for gas sensing. A glucose-assisted hydrothermal method was used for the synthesis of Pd@C core–shell NPs. Pd@In2O3 yolk–shell NPs were formed after calcination (450 °C for 3h) of Pd@C core–shell NPs containing indium precursor. In the Pd@In2O3 yolk–shell geometry, about 50–70 nm Pd NPs were present at the periphery of an In2O3 shell (10–20 nm thickness). The In2O3 shell was composed of ∼10 nm primary particles. The role of Pd NPs in gas sensing behavior of In2O3 has been investigated. The loading of In2O3 with Pd NPs improved the response for reducing gases, but reduced the response for oxidizing gases. The response of Pd@In2O3 yolk–shell NPs to ethanol was approximately 14 times higher than that of pure In2O3 hollow nanospheres at 350 °C. However, no response was recorded for NO2 for Pd@In2O3 as compared to In2O3 (resistance ratio Rs = 2.50) at 350 °C. The maximum response of Pd@In2O3 yolk–shell NPs to 5 ppm ethanol was 159.02 at 350 °C, which was approximately 2.5 times higher than those for other interfering gases (NO2, p-xylene, trimethylamine, HCHO, CO and H2). The effect of humidity on the gas sensing characteristics of Pd@In2O3 yolk–shell NPs suggested that the present sensor can be used to detect ppm-level ethanol even in highly humid atmosphere (80% RH). The improved gas sensing performance of Pd@In2O3 yolk–shell NPs was attributed to catalytic activity of Pd NPs as well as hollow spaces that allowed the accessibility of Pd NPs to gas molecules.
Introduction
The growing concerns related to adverse effects of air pollutants on humans and the surrounding atmosphere have resulted in the rapid development of gas sensors for personal safety, environmental sustainability, and monitoring of industrial processes.1–3 Metal oxide semiconductor (MOS) gas sensors play an important role in the detection of toxic pollutants and flammable gases, since their discovery in the 1960s.4–11 Among various MOS gas sensors, In2O3 with band gap energy equal to 3.6–4.0 eV is widely investigated for gas sensor applications.12–15 The performance of In2O3-based gas sensors has been improved by tuning the morphology or band gap engineering using doping or heterojunction formation.16–18 Band gap engineering through the deposition of noble metals on the surface of MOS16–20 is effective for improving gas sensor performance but passivates the effective surface area involved in gas sensing.21,22 Also, the deposition of noble metals on MOS surface is not always useful in gas sensing because noble metals may lose their catalytic activity because of sintering and agglomeration during heat treatment and sensor operation at high temperature.23 From this perspective, many researchers including us started to use core–shell type structures, where a noble metal present in the core of an oxide shell was protected from agglomeration at elevated temperatures.21,23–30 However, utilization of these core–shell structures as sensing materials in gas sensors can be limited when the accessibility of metal NPs to gas molecules is relatively low. Therefore, hybrids of core–shell structures, i.e. yolk–shell structures with the unique properties of hollow spaces and the functionality of oxide shells as well as highly catalytic noble metal yolks, have attracted tremendous interest in gas sensing and catalysis applications.31–34 The advantage of hollow spaces in gas sensing has been established by Li et al.32 by comparative sensing investigation of ZnO nanospheres with different inner structures, i.e. hollow and solid inner structures. They found that Au@ZnO yolk–shell nanospheres exhibited a dramatic enhancement in response to acetone compared with the pure ZnO nanospheres with hollow and solid inner structures, whereas hollow ZnO nanospheres exhibited higher response as compared to the solid counterpart. It was proposed that the enhanced sensing properties be attributed to the unique microstructures (porous shell and internal voids) and the catalytic effect of the encapsulated Au NPs. Therefore, the yolk–shell structure with different noble metal and metal oxide components can be considered as a promising approach to achieve high-performance gas sensors.Previously, we have synthesized Au@NiO yolk–shell NPs using Au@C as template.31 In the present study, this technique has been further extended to the synthesis of Pd@In2O3 yolk–shell NPs, using Pd@C as template, and the role of Pd NPs in sensing behavior of In2O3 for reducing and oxidizing gases has been investigated. The Pd@In2O3 yolk–shell sensor exhibited enhanced sensing performance towards reducing gases, but negligibly low response towards oxidizing gases as compared to In2O3. Furthermore, the Pd@In2O3 yolk–shell sensor exhibited significantly enhanced sensing performance in terms of high sensitivity and selectivity to ethanol in comparison with a sensor based on hollow In2O3. Therefore, this new finding and mechanism study of Pd@In2O3 yolk–shell nanoreactors present a feasible strategy for the design of novel sensing materials.
Experimental
Materials
D-Glucose, K2PdCl4, urea, ethanol, and In(NO3)3·xH2O were all purchased from Sigma-Aldrich, were of analytical grade and were used without further purification.Synthesis of Pd@C core–shell NPs
A 2 mL, 0.01 M solution of K2PdCl4 was added to a glucose solution (50 mL, 0.5 M) with stirring to form a clear solution. This solution was placed in a Teflon-lined autoclave and maintained at 180 °C for 8 h. The brown-black products were separated by centrifugation, cleaned by three cycles of centrifugation/washing/redispersion in water and in ethanol, and oven-dried at 80 °C for longer than 6 h. Carbon spheres were also synthesized by a similar method without using Pd precursor.Synthesis of Pd@In2O3 yolk–shell NPs
The Pd@In2O3 yolk–shell NPs were synthesized by chemical precipitation of indium nitrate followed by calcination as reported previously.31 In a typical synthesis, 100 mg of Pd@C NPs were dispersed in 20 mL ethanol with the assistance of sonication for 15 min. The Pd@C solution was mixed with 5 mL water containing indium salt and urea. The concentrations of indium salt and urea were fixed at 0.04 and 0.4 M, respectively. The synthesis was carried out at 80 °C for 24 h with vigorous stirring and the product was collected by centrifugation. The products were washed with ethanol and distilled water several times and dried at 70 °C for 5 h. Finally, Pd@In2O3 yolk–shell NPs were obtained after calcination at 450 °C in static air for 3 h with a heating rate of 1 °C min−1. Hollow In2O3 spheres were also synthesized by a similar method using carbon spheres as template.Characterization
The crystallinity and phase of as prepared specimens were analyzed by X-ray diffraction (XRD) (PANalytical, Dresden, Germany) with Cu Kα radiation (λ = 1.5406 Å) from 25 to 85° at a scanning speed of 2° per minute. The morphologies were investigated by high resolution transmission electron microscopy (HR-TEM; JEM-2100F, JEOL Co. Ltd, USA). The surface property was studied by X-ray photoelectron spectroscopy (XPS; PHI 5000 Versa Prob II, FEI Inc.).Sensing device fabrication and measurement
For gas sensing analysis, an alumina substrate (area = 1.5 × 1.5 mm2; thickness = 0.25 mm) with two Au electrodes on its top surface (electrode widths = 1 mm; separation = 0.2 mm) and a microheater on its bottom surface was used as an electrode. Slurries of pure and Pd@In2O3 yolk–shell NPs were prepared in de-ionized water and coated on the Au electrodes by drop-coating using a micropipette. An IR temperature sensor (Metis MP25, Sensortherm GmbH, Germany) was used to measure the sensing temperatures, which were controlled by the microheater underneath the alumina substrate. The alumina substrate was heated at 300, 350 and 400 °C using heater powers of 302, 376 and 445 mW, respectively. The sensors were placed in a specially designed, low-volume (1.5 cm3), quartz tube to minimize delays in changing their surrounding atmosphere. The sensor element was heated at 450 °C for 12 h to remove the remaining solvents and to prepare thermally stable sensors at the gas sensing temperature (300–400 °C). The gas responses (Rs = Ra/Rg) to 5 ppm of trimethylamine (TMA, C3H9N), carbon monoxide (CO), ethanol (C2H5OH), hydrogen (H2), formaldehyde (HCHO) and p-xylene (1,4-dimethylbenzene, C6H4(CH3)2) were measured at 300–400 °C. The Rg/Ra value was obtained as the response to oxidizing gas (NO2). The gas concentrations were controlled by changing the mixing ratio of the parent gases (5 ppm TMA, 5 ppm formaldehyde, 5 ppm p-xylene, 100 ppm carbon monoxide, 100 ppm ethanol, 100 ppm hydrogen and 5 ppm NO2; all in dry air balance) and dry synthetic air. The DC two-probe resistances were measured using an electrometer interfaced with a computer.Results and discussion
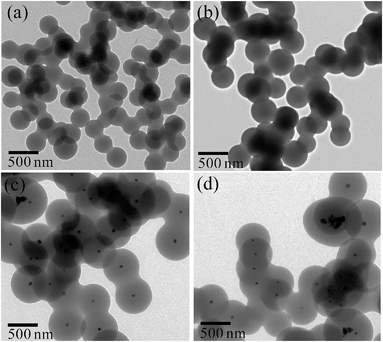
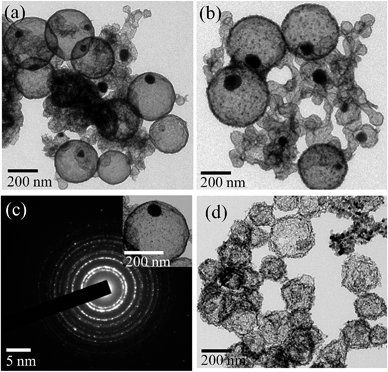
TEM images of pure carbon and Pd@C core–shell NPs are displayed in Fig. 1. TEM images show the formation of spherical carbon NPs (Fig. 1a and b) in the absence of Pd precursor. The size of these particles was 200–250 nm and they were connected to each other. However, submicrometer (400–500 nm) Pd@C core–shell NPs, having Pd NPs (50–70 nm) in the core of the carbon shell (200 nm), are formed in the presence of Pd precursor (Fig. 1c and d). Multiple Pd cores and few Pd-free carbon nanospheres were also observed.Fig. 2 shows the detailed TEM analysis of Pd@In2O3 yolk–shell NPs. TEM images show the formation of a submicrometer (∼500 nm) Pd@In2O3 yolk–shell nanostructure after calcination of Pd@C core–shell NPs (Fig. 2a and b). This yolk–shell structure shows the presence of a hollow space inside the shell (thickness of ca. 10–20 nm) and Pd NPs (50–80 nm) are present at the periphery of the shell. It has been found that the shell is formed of closely packed ∼10 nm In2O3 NPs (Fig. 2b). Furthermore, the sizes of Pd NPs in the Pd@In2O3 yolk–shell and Pd@C core–shell NPs are similar, which suggests that the grain growth of Pd NPs during calcination has been restricted by the presence of the In2O3 shell. Furthermore, the selected area electron diffraction pattern clearly indicates the presence of a polycrystalline In2O3 shell (Fig. 2c). Meanwhile, the use of carbon spheres as template resulted in the formation of hollow In2O3 nanospheres in the range of 200–250 nm as shown in Fig. 2d. The wall thickness of the In2O3 nanospheres was 20–30 nm, which is composed of ∼15 nm primary In2O3 NPs.
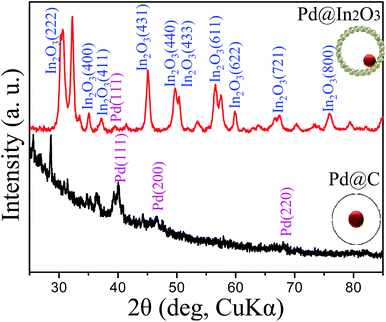
Fig. 3 presents the XRD patterns of the Pd@C core–shell and Pd@In2O3 yolk–shell NPs. XRD results reveal the crystal structure of In2O3 (JCPDS card no. 01-074-1990). Two distinct peaks for Pd NPs with (111) and (200) face-centered cubic structure are observed in the pattern of Pd@C core–shell NPs (JCPDS card no. 01-087-0643). However, in the pattern of Pd@In2O3 yolk–shell NPs, only the (111) peak of Pd NPs is observed, which is possibly related to low intensity of other peaks of Pd NPs.
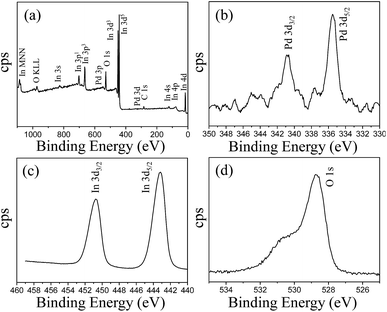
The chemical composition of the Pd@In2O3 yolk–shell NPs was determined by XPS, the results of which are presented in Fig. 4. The survey spectrum of Pd@In2O3 yolk–shell NPs suggests that the sample consists of Pd, In, O and C as shown in Fig. 4a. The elements of Pd, In and O belong to the Pd@In2O3 sample. The presence of elemental C in the spectrum is due to the binding energy of C 1s, which is usually used as an internal reference in the spectrum during XPS measurements. The XPS spectrum of Pd, as shown in Fig. 4b, shows a doublet with binding energies at 335.5 and 340.8 eV, corresponding to Pd 3d5/2 and Pd 3d3/2, respectively.35Fig. 4c shows the In 3d spectrum, which consists of a doublet at binding energies of 450.8 eV for In 3d3/2 and 443.2 eV for In 3d5/2.36 The O 1s spectrum also shows two peaks at 528.6 and 530.8 eV as shown in Fig. 4d. Here, the intense peak at 528.6 eV can be assigned to lattice oxygen in In2O3 species, whereas the weak peak at 530.8 eV is possibly related to adsorbed oxygen.37
The role of Pd NPs in gas sensing performance of In2O3 has been investigated by comparing the response of In2O3 and Pd@In2O3 yolk–shell NPs for ethanol (5 ppm) and NO2 (5 ppm) gases. The results are displayed in Fig. 5. Both devices show typical n-type semiconductor behaviour. It is interesting to note that the baseline resistance of Pd@In2O3 is much higher than that of In2O3. The response of Pd@In2O3 yolk–shell (Rs = 159.02) was about 10 times higher as compared to In2O3 (Rs = 14.85) as displayed in Fig. 5a. However, it is interesting to note that the responses of these two devices are significantly different when tested for NO2 gas (Fig. 5b). As can be seen, Pd@In2O3 shows no signal/response, whereas In2O3 shows clear signal (Rs = 2.89).
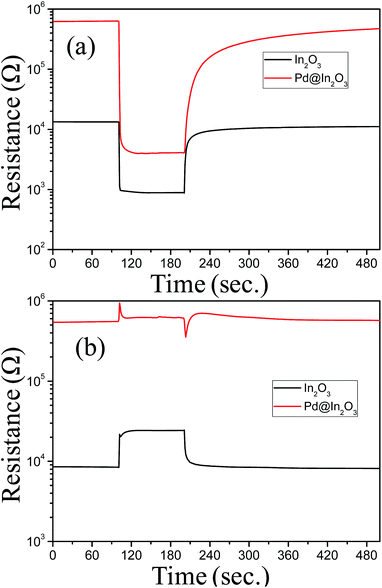 | ||
| Fig. 5 Response transients of Pd@In2O3 yolk–shell and In2O3 hollow sphere at 350 °C for (a) 5 ppm ethanol and (b) 5 ppm NO2. | ||
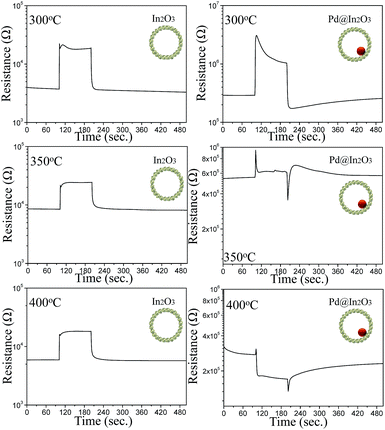
The effect of sensing temperature on gas sensing characteristics of these two devices has also been investigated. It has been found that the response of both devices for ethanol increased when temperature was raised from 300 to 350 °C and then decreased at 400 °C. However, interesting results have been found for NO2 gas. As can be seen from Fig. 6, Pd@In2O3 yolk–shell NPs show n-type response (Rs = 3.69) at 300 °C and then no response at 350 °C. However, at 400 °C they again show a response with p-type semiconductor behaviour. At the same time, In2O3 shows only n-type gas sensing characteristics regardless of sensing temperature and the response of In2O3 decreases from 5.71 to 2.89 when temperature is raised from 300 to 400 °C.
Furthermore, sensor stability was checked by repeating the response measurement at 350 °C for 5 ppm of ethanol for 1 month (Fig. S1†). It can be seen that the response remained stable even after 1 month of testing, which indicates that the response of Pd@In2O3 yolk–shell can be reproducible.
Furthermore, the selectivity has been investigated for common interfering gases (Fig. 7). It has been found that In2O3 shows the highest response for ethanol (Rs = 14.85) but there is no clear selectivity as the response for p-xylene (Rs = 11.63) is also very close. However, Pd@In2O3 shows clear selectivity for ethanol as the response for ethanol is about 2.6 times higher compared to HCHO.
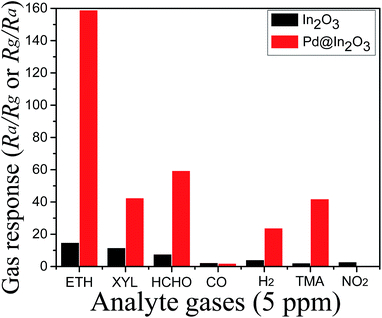 | ||
| Fig. 7 Response of Pd@In2O3 yolk–shell NPs and In2O3 NPs at 350 °C for 5 ppm of analyte gases (ETH, ethanol; XYL, xylene; TMA, trimethylamine). | ||
The effect of humidity on gas sensing characteristics of Pd@In2O3 yolk–shell NPs was also investigated for their real applications. The gas response was analyzed for 1 ppm analyte gases in dry and 80% RH atmospheres to examine the effect of humidity on the gas sensing characteristics (Fig. S2†). It has been found that the response was decreased for all gases in humid conditions as compared to dry conditions. For example, the response of ethanol was decreased from 58.7 to 11.26 when the atmosphere was changed from dry to humid (80% RH) condition. However, the selective detection of ethanol over the interfering gases was maintained even in 80% RH and the response to 1 ppm ethanol is still more than two times higher than that to p-xylene. From this perspective, the present sensor can be used to detect ppm-level ethanol even in a highly humid atmosphere, although it is necessary to decrease further the humidity dependence of the gas sensing characteristics.
The high response of Pd@In2O3 yolk–shell NPs as compared to In2O3 for reducing gases and low response for oxidizing gases is possibly related to electronic as well as chemical sensitization of Pd NPs. In electronic sensitization, formation of a Schottky barrier between Pd and In2O3 NPs results in charge transfer from In2O3 to Pd NPs, as the work function of Pd NPs (5.3 eV) is higher as compared to In2O3 (5.0 eV).29,38 This results in an increase in air resistance of Pd@In2O3 yolk–shell NPs as compared to In2O3, which is also supported by experimental results as shown in Fig. 5. In chemical sensitization, Pd NPs catalytically activate the dissociation of O2 molecules and the product then adsorbs on the surface of In2O3 by capturing the electron, and therefore the air resistance of In2O3 increases after Pd loading. The chemiresistive variation to fixed concentration of analyte gas will become higher when the background charge carrier concentration (electrons) of the sensor in air becomes lower by electronic/chemical sensitization due to Pd NPs. This explains the enhancement of ethanol response by Pd loading.
However, the role of Pd NPs in NO2 sensing is not simple. The Pd@In2O3 yolk–shell sensors show n-type, neither n-type nor p-type, and p-type sensing characteristics at 300, 350, and 400 °C, respectively.
In principle, for the pure In2O3 sensor, the chemiresistive variations to ethanol and NO2 can be discriminated because these are opposite to each other. However, the decrease of Ra upon exposure to C2H5OH can be nullified by the increase of Ra by the coexistence of NO2. From this viewpoint, the operation of the Pd@In2O3 sensor at 350 °C can minimize the possible interference from NO2 and thus provide reliable and selective detection of ethanol.
The selectivity of Pd@In2O3 towards ethanol is possibly related to catalytic activity of In2O3 and Pd NPs towards ethanol. Furthermore, switching of the response of Pd@In2O3 yolk–shell NPs from n-type to p-type with increasing temperature is interesting and needs to be explained. Ruhland et al.39 also reported similar results on SnO2 surface, where resistance increases upon exposure to NO2 at low temperature. At high temperature (>200 °C), the sensor resistance decreases upon exposure to NO2 (only at low concentration). A similar result has also been reported in our previous study.40,41 This anomalous behaviour has been explained by the Lennard-Jones model, where distance between adsorbed molecules has been taken into account.40 Our result can also be explained by the above mentioned mechanism. For example, in the presence of air, oxygen molecules adsorb on the surface of In2O3 as given in eqn (1):
| O2(gas) + 2e− → 2O(ads)− | (1) |
In the presence of NO2, it directly adsorbs by capturing the surface electron due to its high electrophilicity as compared to O2 molecules:
| NO2(g) + 2e− → NO2(ads)− | (2) |
At low temperature, the concentration of adsorbed oxygen ions is low and it increases with increasing temperature. Furthermore, the loading of Pd NPs also increases the adsorption of oxygen ions due to the catalytic activity in Pd@In2O3 yolk–shell NPs. It is believed that at low temperature adsorbed oxygen and NO2(ads)− ions are too far apart to interact in both devices, although adsorbed oxygen ion concentration is higher in Pd@In2O3 yolk–shell NPs as compared to In2O3. Therefore, both devices showed n-type sensing behaviour. At high temperature, the concentration of adsorbed oxygen ions increases but still the distance between these two ions is too far to interact in In2O3.42 In contrast, for Pd@In2O3 yolk–shell NPs, oxygen adsorption becomes more marked due to the catalytic activity of Pd NPs; thus, the adsorption of NO2(ads)− ions occurred by substitution of oxygen ions:
| NO2(g) + 2O(ads)− → NO2(ads)− + O2(gas) + e− | (3) |
Therefore, Pd@In2O3 yolk–shell NPs' sensing behaviour is governed by balance between eqn (1) and (2) and simultaneous transfer of electrons to the sensing body resulting in a decrease in resistance and therefore p-type sensing behavior.
Conclusions
Pd@In2O3 yolk–shell NPs were synthesized by chemical precipitation of indium precursors on Pd@C template followed by calcination. Pd@In2O3 yolk–shell NPs were formed having 50–80 nm Pd NPs at the periphery of the In2O3 shell. The response of In2O3 was increased for reducing gases and decreased for oxidizing gases after Pd NP loading. The maximum response of Pd@In2O3 yolk–shell NPs was 159.02 at 350 °C for 5 ppm of ethanol gas. The ethanol response of Pd@In2O3 yolk–shell NPs was ∼10 times higher as compared to pure In2O3 and ∼2.5 times higher than the common interfering gases at 350 °C. The sensing behavior of Pd@In2O3 switched from n-type to p-type with increasing temperature for NO2 gas. Thus, the Pd@In2O3 yolk–shell sensor showed the selective detection of C2H5OH. The response significantly decreased in the presence of humidity; however, selective detection of ethanol over the interfering gases was maintained. The better sensing performance of Pd@In2O3 yolk–shell NPs as compared to In2O3 NPs was attributed to electronic as well as chemical sensitization of Pd NPs along with the hollow interior, which allowed the accessibility of Pd NPs to gas molecules.Acknowledgements
This study was supported by Department of Science and Technology (DST), New Delhi, India vide DST-INSPIRE Faculty Scheme (DST/INSPIRE/04/2014/001318). P. Rai acknowledges the use of characterization facilities at Thematic Unit of Excellence on Soft Nanofabrication with Application in Energy, Environment and Bioplatform.Notes and references
- D. Kohl, J. Phys. D: Appl. Phys., 2001, 34, R125–R149 CrossRef CAS.
- L. Feng, C. J. Musto, J. W. Kemling, S. H. Limb and K. S. Suslick, Chem. Commun., 2010, 46, 2037–2039 RSC.
- J. M. Bingham, J. N. Anker, L. E. Kreno and R. P. van Duyne, J. Am. Chem. Soc., 2010, 132, 17358–17359 CrossRef CAS PubMed.
- T. Seiyama, A. Kato, K. Fujiishi and M. Nagatani, Anal. Chem., 1962, 34, 1502–1503 CrossRef CAS.
- N. Taguchi, Japanese Patent Application S45–38200, 1962.
- G. Jiménez-Cadena, J. Riu and F. Xavier Rius, Analyst, 2007, 132, 1083–1099 RSC.
- J.-H. Lee, Sens. Actuators, B, 2009, 140, 319–336 CrossRef CAS.
- H.-J. Kim and J.-H. Lee, Sens. Actuators, B, 2014, 192, 607–627 CrossRef CAS.
- K. Potje-Kamloth, Chem. Rev., 2008, 108, 367–399 CrossRef CAS PubMed.
- E. Comini, C. Baratto, I. Concina, G. Faglia, M. Falasconi, M. Ferroni, V. Galstyan, E. Gobbi, A. Ponzoni, A. Vomiero, D. Zappa, V. Sberveglieri and G. Sberveglieri, Sens. Actuators, B, 2013, 179, 3–20 CrossRef CAS.
- S. J. Pearton, F. Ren, Y.-L. Wang, B. H. Chu, K. H. Chen, C. Y. Chang, W. Lim, J. Lin and D. P. Norton, Prog. Mater. Sci., 2010, 55, 1–59 CrossRef.
- S.-J. Kim, I.-S. Hwang, J.-K. Choi, Y. C. Kang and J.-H. Lee, Sens. Actuators, B, 2011, 155, 512–518 CrossRef CAS.
- X. Sun, H. Hao, H. Ji, X. Li, S. Cai and C. Zheng, ACS Appl. Mater. Interfaces, 2014, 6, 401–409 CAS.
- J. Zai, J. Zhu, R. Qi and X. Qian, J. Mater. Chem. A, 2013, 1, 735–745 CAS.
- J. Liu, G. Chen, Y. Yu, Y. Wu, M. Zhou, H. Zhang, C. Lv, Y. Zheng and F. He, RSC Adv., 2015, 5, 44306–44431 RSC.
- P. Li, Y. Cai and H. Fan, RSC Adv., 2013, 3, 22239–22245 RSC.
- N. Singh, R. K. Gupta and P. S. Lee, ACS Appl. Mater. Interfaces, 2011, 3, 2246–2252 CAS.
- S.-J. Kim, I.-S. Hwang, C. W. Na, I.-D. Kim, Y. C. Kang and J.-H. Lee, J. Mater. Chem., 2011, 21, 18560–18567 RSC.
- P. Rai, Y.-S. Kim, H.-M. Song, M.-K. Song and Y.-T. Yu, Sens. Actuators, B, 2012, 165, 133–142 CrossRef CAS.
- S.-J. Hwang, K.-I. Choi, J.-W. Yoon, Y. C. Kang and J.-H. Lee, Chem.–Eur. J., 2015, 21, 5872–5878 CrossRef CAS PubMed.
- L. Xu, M.-L. Yin and S. Liu, Sci. Rep., 2014, 4, 6745 CrossRef CAS PubMed.
- R.-J. Wu, D.-J. Lin, M.-R. Yu, M. H. Chen and H.-F. Lai, Sens. Actuators, B, 2013, 178, 185–191 CrossRef CAS.
- P. M. Arnal, M. Comotti and F. Schüth, Angew. Chem., Int. Ed., 2006, 45, 8224–8227 CrossRef CAS PubMed.
- Y.-T. Yu and P. Dutta, Sens. Actuators, B, 2011, 157, 444–449 CrossRef CAS.
- P. Rai, S. M. Majhi, Y.-T. Yu and J.-H. Lee, RSC Adv., 2015, 5, 17653–17659 RSC.
- X. Li, J. Liu, H. Guo, X. Zhou, C. Wang, P. Sun, X. Hu and G. Lu, RSC Adv., 2015, 5, 545–551 RSC.
- Y.-S. Kim, P. Rai and Y.-T. Yu, Sens. Actuators, B, 2013, 186, 633–639 CrossRef CAS.
- S. M. Majhi, P. Rai and Y.-T. Yu, ACS Appl. Mater. Interfaces, 2015, 7, 9462–9468 CAS.
- Y.-K. Lin, Y.-J. Chiang and Y.-J. Hsu, Sens. Actuators, B, 2014, 204, 190–196 CrossRef CAS.
- P. Rai, R. Khan, S. Raj, S. M. Majhi, K.-K. Park, Y.-T. Yu, I.-H. Lee and P. K. Sekhar, Nanoscale, 2014, 6, 581–588 RSC.
- P. Rai, J.-W. Yoon, H.-M. Jeong, S.-J. Hwang, C.-H. Kwak and J.-H. Lee, Nanoscale, 2014, 6, 8292–8299 RSC.
- X. Li, X. Zhou, H. Guo, C. Wang, J. Liu, P. Sun, F. Liu and G. Lu, ACS Appl. Mater. Interfaces, 2014, 6, 18661–18667 CAS.
- G. Li and Z. Tang, Nanoscale, 2014, 6, 3995–4011 RSC.
- Y. Yao, X. Zhang, J. Peng and Q. Yang, Chem. Commun., 2015, 51, 3750–3753 RSC.
- S. Yang, J. Dong, Z. Yao, C. Shen, X. Shi, Y. Tian, S. Lin and X. Zhang, Sci. Rep., 2014, 4, 4501 Search PubMed.
- J. Ba, D. Fattakhova Rohlfing, A. Feldhoff, T. Brezesinski, I. Djerdj, M. Wark and M. Niederberger, Chem. Mater., 2006, 18, 2848–2854 CrossRef CAS.
- L. Yin, D. Chen, B. Fan, H. Lu, H. Wang, H. Xu, D. Yang, G. Shao and R. Zhang, Mater. Chem. Phys., 2013, 143, 461–469 CrossRef CAS.
- S.-H. Wang, S. Liu, S.-J. Chang, T.-Y. Tsaia and C.-L. Hsu, RSC Adv., 2015, 5, 5192–5196 RSC.
- B. Ruhland, Th. Becker and G. Muller, Sens. Actuators, B, 1998, 50, 85–94 CrossRef CAS.
- Z. Dai, C.-S. Lee, Y. Tian, I.-D. Kim and J.-H. Lee, J. Mater. Chem. A, 2015, 3, 3372–3381 CAS.
- Y.-S. Kim, I.-S. Hwang, S.-J. Kim, C.-Y. Lee and J.-H. Lee, Sens. Actuators, B, 2008, 135, 298–303 CrossRef CAS.
- K. Wetchakun, T. Samerjai, N. Tamaekong, C. Liewhiran, C. Siriwong, V. Kruefu, A. Wisitsoraat, A. Tuantranont and S. Phanichphant, Sens. Actuators, B, 2011, 160, 580–591 CrossRef CAS.
Footnote |
| † Electronic supplementary information (ESI) available. See DOI: 10.1039/c5ta08873a |
| This journal is © The Royal Society of Chemistry 2016 |

