 Open Access Article
Creative Commons Attribution 3.0 Unported Licence
Efficient identification of hydrophobic MOFs: application in the capture of toxic industrial chemicals†
Peyman Z.
Moghadam‡
a,
David
Fairen-Jimenez‡
b and
Randall Q.
Snurr
*a
aDepartment of Chemical and Biological Engineering, Northwestern University, Evanston, Illinois 60208, USA. E-mail: snurr@northwestern.edu
bDepartment of Chemical Engineering and Biotechnology, University of Cambridge, Pembroke St., Cambridge CB2 3RA, UK
First published on 27th November 2015
Abstract
Water is an ever-present component in the air, and competitive adsorption of water is a major challenge in many applications of adsorbents, including capture of toxic industrial chemicals (TICs) from the atmosphere. For metal–organic framework (MOF) adsorbents, the presence of water often leads to major material instabilities that could limit their practical performance. MOFs displaying hydrophobic behavior might be useful in overcoming these problems. In this work, we present a new computational strategy to quickly identify hydrophobic MOFs based on their water Henry's constants. Starting with a database of 137![[thin space (1/6-em)]](https://www.rsc.org/images/entities/char_2009.gif) 953 hypothetical MOFs, we identified 45
953 hypothetical MOFs, we identified 45![[thin space (1/6-em)]](https://www.rsc.org/images/entities/char_2009.gif) 975 structures as hydrophobic based on their simulated water Henry's constants. Using grand canonical Monte Carlo simulations, we further analyzed 2777 of these hydrophobic materials whose linkers did not contain chemical functionalization. The results show insignificant water uptake in the identified MOFs, confirming their hydrophobic nature. The capability of the hydrophobic MOFs was assessed for ammonia capture under humid conditions, and analysis of the data generated from this high-throughput computational screening revealed the role of the textural properties and surface chemistry on the removal of toxic compounds. The results suggest that if materials are too hydrophilic, they adsorb too much water and show little or no selectivity towards TICs. On the other hand, if they are too hydrophobic, they adsorb too little ammonia.
975 structures as hydrophobic based on their simulated water Henry's constants. Using grand canonical Monte Carlo simulations, we further analyzed 2777 of these hydrophobic materials whose linkers did not contain chemical functionalization. The results show insignificant water uptake in the identified MOFs, confirming their hydrophobic nature. The capability of the hydrophobic MOFs was assessed for ammonia capture under humid conditions, and analysis of the data generated from this high-throughput computational screening revealed the role of the textural properties and surface chemistry on the removal of toxic compounds. The results suggest that if materials are too hydrophilic, they adsorb too much water and show little or no selectivity towards TICs. On the other hand, if they are too hydrophobic, they adsorb too little ammonia.
Introduction
Water adsorption is one of the most important characteristics of porous metal–organic frameworks (MOFs)1–3 because the co-adsorption of water can greatly affect the ability to selectively adsorb a target species. Capture of volatile toxic industrial chemicals (TICs) is a potential application of MOFs where competitive water adsorption is a particular challenge.4 TIC capture has historically been centered on adsorption and trapping by activated carbon.5–7 While activated carbon is clearly useful, its capacity is lower than desired and its ability to capture low-molecular-weight chemicals such as ammonia, NOx, and formaldehyde is somewhat limited.5 For example, maximal NH3 adsorption capacity is 130 mg g−1 for highly activated carbons impregnated with H2SO4.8 The relatively low capacity of carbons is a consequence of their ill-defined porosity, less than optimal pore and channel dimensions, and weak adsorbate–adsorbent interactions with these compounds.4 Therefore, capturing chemical agents requires novel adsorbents featuring specific characteristics such as strong adsorption sites to create very high gravimetric and volumetric adsorption capacities. Furthermore, structures with synthetically tunable cavities are highly desired since they allow for structural design for optimal capacity and selectivity.MOFs are, in principle, capable of satisfying these requirements. The tunability of the pore textural properties (i.e. pore surface area, volume, size, and shape) as well as surface chemistry (i.e. functional groups) allows for generation of an almost limitless number of MOFs and the ability to tailor their features for separation applications.9–12 A number of MOFs have been examined in the literature for the removal of TICs from air with both experiments and molecular simulation.13–16 Numerous reports have discussed detrimental water effects on MOF's adsorption performance.15,17–21 Indeed, an inherent challenge in the capture of TICs in humid conditions is the competitive adsorption of water from the atmosphere. In order to produce optimal MOF adsorbents, it is therefore desirable to design porous structures that have high affinity for TICs but not for water. This suggests that hydrophobic materials might be a good starting point. A number of studies in the literature have focused on different strategies to increase MOF hydrophobicity – and stability with respect to water vapor – by introducing hydrophobic moieties such as fluorinated functional groups or shielding the metal clusters with bulky functional groups.22–27 However, the principles for designing hydrophobic MOFs and the effects of textural properties on hydrophobicity are not well understood.
Molecular simulations can provide insights into water adsorption in MOFs, but equilibrating water isotherms using grand canonical Monte Carlo (GCMC) simulations is notoriously tedious and time consuming.28 These simulations require a large number of Monte Carlo steps, as slight changes in water arrangements result in drastic energy changes in the system and low acceptance rates of the Monte Carlo moves. Moreover, performing experimental water adsorption tests for the thousands of known MOF structures is not feasible. To address the above challenges, we present a fast and efficient computational approach involving calculation of Henry's constants to predict the water adsorption capabilities of a large number of adsorbents, and we apply it to identify hydrophobic structures in a database of 137![[thin space (1/6-em)]](https://www.rsc.org/images/entities/char_2009.gif) 953 MOFs.29 We also determine the affinities of ammonia and methane, as representative polar and non-polar molecules, in these MOFs and compare them with the adsorption affinity of water. As a complement to the Henry's constant calculations, which are relevant at very low loadings, the performance of the selected hydrophobic MOFs for water adsorption and ammonia capture at finite loading is tested using GCMC simulations.
953 MOFs.29 We also determine the affinities of ammonia and methane, as representative polar and non-polar molecules, in these MOFs and compare them with the adsorption affinity of water. As a complement to the Henry's constant calculations, which are relevant at very low loadings, the performance of the selected hydrophobic MOFs for water adsorption and ammonia capture at finite loading is tested using GCMC simulations.
Approach: Henry's constant (KH) calculations for efficient screening
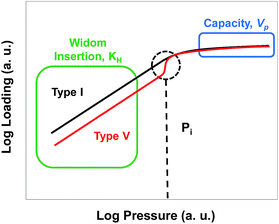
The shape of an adsorption isotherm provides a great deal of information about the interactions present in a system30 and, in the case of water adsorption, about the hydrophilic or hydrophobic character of the material. Water in hydrophobic MOFs exhibits Type V adsorption isotherms, which indicate weak water–MOF interactions, with low loadings at low pressures followed by water condensation in the pores at higher pressures due to strong water–water interactions. Examples of Type V isotherms in MOFs include water adsorption in ZIF-8,31 Zn(pyrazol),32 and Al(NDC).33 In contrast, hydrophilic MOFs such as HKUST-1 and MOF-74 exhibit Type I isotherms and adsorb large amounts of water at low pressure as a consequence of strong water–MOF interactions, which are due to the presence of open metal sites in the case of HKUST-1 and MOF-74.31,34–36 Regardless of their classification, adsorption isotherms can be interpreted in simple terms by plotting them on a log–log scale as illustrated in Fig. 1. For all isotherms, the low pressure regime can be described by a Henry's constant (KH), identified in this log–log representation by a slope of 1. In a standard representation, KH is the slope of the isotherm in the Henry region at very low loadings and is a simple way to quantify the adsorbate–adsorbent interaction affinity. At the highest pressures, the saturation capacity of a given adsorbate is determined by the available pore volume (Vp) and the density of the adsorbed fluid. As shown in Fig. 1, the difference between Type I and Type V isotherms is the deviation of the isotherm from linearity as the pressure increases; for Type I isotherms the slope becomes less than unity due to pore saturation, and for Type V isotherms the slope becomes greater than unity due to a cooperative adsorption effect at a given pressure which we will call Pi. Ghosh et al.28 suggested that the hydrophobicity of MOFs could be quantified by the pressure at which water condenses in the pores, with a higher pressure indicating a more hydrophobic MOF. However, calculating or measuring the full isotherm is very time consuming. We hypothesized that Pi could be correlated with the more easily calculated KH, and KH therefore could be used as a metric to estimate the hydrophilicity or hydrophobicity of a given MOF.Henry's constant can be obtained from the low pressure regime of a simulated or experimental adsorption isotherm. However, using this approach is not efficient for screening a large number of structures, especially for water adsorption. Alternatively, KH can be computed by using the Widom insertion method.37 In this method, the adsorbate molecule is inserted in the adsorbent at randomly chosen positions and its energy is calculated each time before it is removed from the system. By repeating the process over a large number of random points, it is possible to quickly evaluate the guest–MOF interaction without including the contribution of guest–guest interactions.38 The benefit of this method is that the calculations are orders of magnitude faster than calculating water adsorption isotherms using GCMC simulations. Fig. S1† compares the Henry's constants obtained from the slope of the isotherm at low pressure from GCMC simulations with those computed from the Widom method for water and methane in a number of selected MOFs. Given the excellent agreement observed between the two methods, we decided to carry out all other KH calculations in this work using the Widom insertion method.
Simulation details
Adsorbate–adsorbent and adsorbate–adsorbate interactions were modeled with a Lennard-Jones (LJ) plus Coulomb potential with a LJ cut-off distance of 12.8 Å and no tail corrections. Electrostatic interactions were computed using the Ewald summation method for both adsorbate–adsorbent and adsorbate–adsorbate interactions. The force field parameters for water were taken from the TIP4P39 model. The TraPPE force field was used for ammonia40 and methane.41 All adsorbate force field parameters are listed in the ESI.† The force field parameters and partial charges for ZIF-8, Al(NDC), and Zn-pyrazole are described in our previous publication.28 The LJ parameters for the framework atoms of all other MOFs were taken from the Universal Force Field (UFF).42 For FMOF-1, the partial charges on CF3 groups were taken from the work of Dalvi et al.43 The partial charges for all other atoms in FMOF-1 were obtained from DFT calculations (see ESI†). The partial charges for MIL-47 were obtained from the work of Yazaydın et al.44 and those for the hypothetical MOFs were calculated from the extended charge equilibrium method.45 All MOFs were treated as rigid in the simulations.Henry's constants were computed using the Widom insertion method. We used orientational-biasing to insert the adsorbate molecules at positions throughout the simulation cell. We first compared results with 10![[thin space (1/6-em)]](https://www.rsc.org/images/entities/char_2009.gif) 000, 100
000, 100![[thin space (1/6-em)]](https://www.rsc.org/images/entities/char_2009.gif) 000, and 1
000, and 1![[thin space (1/6-em)]](https://www.rsc.org/images/entities/char_2009.gif) 000
000![[thin space (1/6-em)]](https://www.rsc.org/images/entities/char_2009.gif) 000 insertions in MIL-47, ZIF-8, Al(NDC), and Zn-pyrazole, and found that 100
000 insertions in MIL-47, ZIF-8, Al(NDC), and Zn-pyrazole, and found that 100![[thin space (1/6-em)]](https://www.rsc.org/images/entities/char_2009.gif) 000 provided sufficient accuracy (see Fig. S1†). For the screening of the hypothetical MOFs, we therefore used 100
000 provided sufficient accuracy (see Fig. S1†). For the screening of the hypothetical MOFs, we therefore used 100![[thin space (1/6-em)]](https://www.rsc.org/images/entities/char_2009.gif) 000 insertions. The amount adsorbed for water and ammonia at finite loading was calculated using grand canonical Monte Carlo (GCMC) simulations46 implemented in the RASPA molecular simulation software.47 The Monte Carlo moves attempted were insertions, deletions, displacements, and rotations plus, for binary mixtures of water and ammonia, identity changes. We used 1 × 10⁵ cycles for equilibration and another 1 × 10⁵ cycles for production in the ammonia pure component simulations. For water simulations (pure and mixtures), we used at least 4 × 10⁵ cycles each for the equilibrium and production periods. A cycle is defined as the maximum of 20 or the number of molecules in the system. The number of unit cells in each MOF was adjusted to be at least twice the LJ cut-off distance.
000 insertions. The amount adsorbed for water and ammonia at finite loading was calculated using grand canonical Monte Carlo (GCMC) simulations46 implemented in the RASPA molecular simulation software.47 The Monte Carlo moves attempted were insertions, deletions, displacements, and rotations plus, for binary mixtures of water and ammonia, identity changes. We used 1 × 10⁵ cycles for equilibration and another 1 × 10⁵ cycles for production in the ammonia pure component simulations. For water simulations (pure and mixtures), we used at least 4 × 10⁵ cycles each for the equilibrium and production periods. A cycle is defined as the maximum of 20 or the number of molecules in the system. The number of unit cells in each MOF was adjusted to be at least twice the LJ cut-off distance.
Results and discussion
TICs present in the air are generally found as trace amounts with very low partial pressures, where adsorption is in the Henry's law region of the adsorption isotherms. Lab-scale experiments for ammonia capture often use a partial pressure of ca. 290 Pa, for example.48,49 For hydrophobic MOFs, water adsorption before condensation is also in the Henry's law region. In this case, the selectivity of a TIC over water can be estimated simply by the ratio of the individual KH values.50 We initially calculated and compared the KH values for water, ammonia as a representative TIC, and methane as a representative non-polar molecule for a small number of MOFs with different levels of hydrophobicity: Al-NDC, MIL-47, Zn-pyrazole, and ZIF-8. Using the same force field parameters as used here, Ghosh et al. simulated water uptake in Al-NDC, Zn-pyrazole, and ZIF-8 and found good agreement between experimental and simulated water adsorption isotherms.28Fig. 2 shows the KH values for water, ammonia, and methane in the selected MOFs, as well as the selectivity of ammonia and methane over water as calculated by the ratio of their Henry's constants. Surprisingly, among the hydrophobic MOFs studied, the structure with the highest affinity for water (i.e. Al-NDC, the least hydrophobic) presents high selectivities for ammonia and methane. Furthermore, the MOF with the lowest affinity for water (i.e. ZIF-8, the most hydrophobic) shows the lowest selectivity for ammonia and moderate selectivity for methane. One question that arises is whether this observed trend can be generalized towards a larger number of hydrophobic MOFs and to what extent the relative hydrophobicity in MOFs can provide preferential adsorption towards a specific toxic chemical. To answer this question, we calculated KH and the selectivities of ammonia and methane over water for a larger number of hydrophobic and hydrophilic MOFs.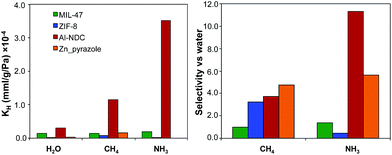 | ||
| Fig. 2 (Left) Henry's constants (KH) for water, methane, and ammonia and (right) selectivities for methane and ammonia over water for the four selected MOFs. | ||
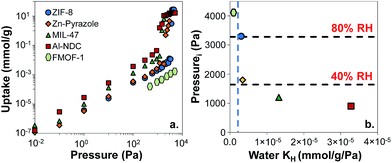
First, we wanted to validate our approach for discriminating between different levels of hydrophobicity in MOFs via their water Henry's constants. We had previously simulated water adsorption isotherms in Al-NDC, MIL-47, Zn-pyrazole, and ZIF-8 and compared them with experiments where available.28 In addition to these MOFs, we simulated the water adsorption isotherm for FMOF-1 (Fig. S2†), a superhydrophobic MOF with fully fluorinated pores.26,51 Predicted water isotherms for these 5 MOFs (Fig. 3a) show that water condenses at different pressures for the different MOFs, indicating a range of water affinities. Note that in FMOF-1, water does not condense in the pores even at 100% RH in agreement with experimental measurements.26Fig. 3b shows that the water condensation Pi inversely correlates with water KH. For example, the superhydrophobic MOF, FMOF-1, has the lowest water KH (i.e. 2 × 10⁻⁷ mmol g−1 Pa−1) and the highest Pi (the Pi for FMOF-1 is set to be equal to the water saturation vapor pressure). For ZIF-8, condensation occurs around 80% RH. Zn-pyrazole, Al-NDC, and MIL-47 exhibit relatively less hydrophobic behavior, as the condensation steps occur at ca. 40%, 30%, and 20% RH, respectively.
For TIC capture, we consider a scenario where the relative humidity is 80% in the atmosphere. Under these conditions, we want a MOF to be hydrophobic enough that only a very small amount of water is adsorbed. Using ZIF-8 as a benchmark, we will consider MOFs to be hydrophobic if their water KH values are lower than 5 × 10⁻⁶ mmol g−1 Pa−1, shown by the vertical, blue, dashed line in Fig. 3b. To support this choice, we collected experimental water isotherms for another 19 MOFs from the literature (Fig. S4†).27,35,52–56 From the selected MOFs, 16 have Type V water isotherms and three have Type I isotherms (Fig. S4†). From the experimental isotherms, we calculated the condensation pressure Pi and the water Henry's constants and plotted Piversus KH (Fig. S3†). If our criterion of KH < 5 × 10⁻⁶ mmol g−1 Pa−1 for hydrophobic MOFs is reasonable, then any MOF with KH less than this value should have a value of Pi of at least 80% RH. Similarly, MOFs with KH > 5 × 10⁻⁶ mmol g−1 Pa−1 should have a value of Pi less than 80% RH. Fig. S3† shows that this is, indeed, true for the 19 MOFs for which we could find experimental water isotherms, thus supporting our proposed KH threshold for hydrophobicity. Note that very hydrophilic MOFs such as HKUST-1 (ref. 35) and Mg–MOF-74 (ref. 56) have water KH values orders of magnitude higher than the proposed KH threshold, with values larger than 0.05 mmol g−1 Pa−1.
After validation of our KH criterion, we applied it to a database of MOFs with 137![[thin space (1/6-em)]](https://www.rsc.org/images/entities/char_2009.gif) 953 hypothetical structures previously developed in our group.29 Given the very large number of structures, it is not practical to calculate water adsorption isotherms for every structure and examine their water affinities. On the other hand, by calculating water KH using the Monte Carlo Widom insertion method we can rapidly screen the database for hydrophobic MOFs. Following this approach, we calculated the water KH for all 137
953 hypothetical structures previously developed in our group.29 Given the very large number of structures, it is not practical to calculate water adsorption isotherms for every structure and examine their water affinities. On the other hand, by calculating water KH using the Monte Carlo Widom insertion method we can rapidly screen the database for hydrophobic MOFs. Following this approach, we calculated the water KH for all 137![[thin space (1/6-em)]](https://www.rsc.org/images/entities/char_2009.gif) 953 structures in the database, and by implementing the KH criterion described above we identified 45
953 structures in the database, and by implementing the KH criterion described above we identified 45![[thin space (1/6-em)]](https://www.rsc.org/images/entities/char_2009.gif) 975 hydrophobic hypothetical MOFs. To analyze their selectivity, we also calculated the KH values for ammonia and methane and compared them with those obtained for water.
975 hydrophobic hypothetical MOFs. To analyze their selectivity, we also calculated the KH values for ammonia and methane and compared them with those obtained for water.
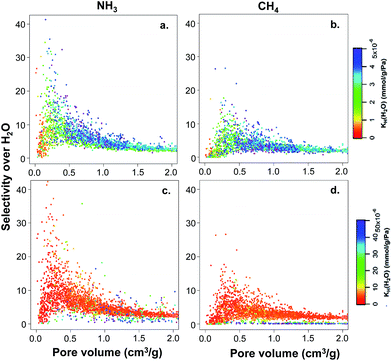
The hypothetical MOF database contains not only structures with a wide range of textural properties (i.e. pore size, surface area, and pore volume) but also contains a diverse surface chemistry due to the presence of different functional groups. In order to investigate first the effects of textural properties on structure–property relationships, we studied the 2777 non-functionalized hydrophobic structures present in the database. Fig. 4 shows the selectivity values for ammonia and methane over water versus the pore volume for the hydrophobic MOFs (i.e. water KH < 5 × 10⁻⁶ mmol g−1 Pa−1 – Fig. 4a and b) and 3372 unfunctionalized MOFs with somewhat higher affinities for water (i.e. water KH < 50 × 10−6 mmol g−1 Pa−1 – Fig. 4c and d). For both groups, the color code in Fig. 4 represents the KH values for water. In general, MOFs with pore volumes larger than 1 cm3 g−1 exhibit very low selectivities towards both ammonia and methane. In contrast, MOFs with lower pore volume can exhibit either low or high TIC selectivity. The differences found in the selectivity of these lower pore volume MOFs are related to their hydrophobic/hydrophilic character. In particular, MOFs with only moderate hydrophobicity (i.e. KH values between 2 × 10⁻⁶ and 4 × 10⁻⁶ mmol g−1 Pa−1, green to blue in Fig. 4a and b) exhibit high TIC selectivity, whereas highly hydrophobic MOFs with very low water KH (red to yellow in Fig. 4a and b) do not show high selectivity. This is more prominent for ammonia than methane. MOFs with higher affinities for water (i.e. MOFs with larger water KH shown by darker colors in Fig. 4c and d) show low TIC selectivity, suggesting that competitive water adsorption is important in these MOFs.
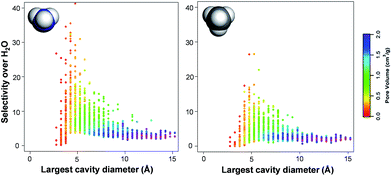
Fig. 5 shows the relationship between TIC selectivity and other textural properties, namely the pore size and pore volume, for the non-functionalized hydrophobic MOFs. The pore size is characterized here by the largest cavity diameter.57 The highest selectivity is achieved when the largest cavity diameter is ca. 4 Å, which is comparable to the kinetic diameter of CH4 (3.8 Å) and NH3 (3.6 Å)58vs. the smaller H2O (2.6 Å).10,59 As illustrated by the color codes in Fig. 5, the pore size and pore volume are interrelated parameters. Note that with a 4 Å largest cavity diameter, only one methane or ammonia molecule can fit across the pore. MOFs containing pores of up to ca. 8 Å diameter, i.e. with the possibility of adsorbing a double layer of ammonia and methane, show rather good selectivities with higher pore volumes.
Following the textural property analysis, we assessed the effects of surface chemistry on ammonia and methane selectivity. We classified the 45![[thin space (1/6-em)]](https://www.rsc.org/images/entities/char_2009.gif) 975 hydrophobic MOFs present in the database into five different categories depending on the functional groups present: (i) non-functionalized MOFs; (ii) polar groups (i.e. –NH2, –OH, and –CN); (iii) alkyl; (iv) ether; and (v) halogens. Fig. 6 shows this classification as well as the resulting frequency of occurrence for each category versus the selectivities.
975 hydrophobic MOFs present in the database into five different categories depending on the functional groups present: (i) non-functionalized MOFs; (ii) polar groups (i.e. –NH2, –OH, and –CN); (iii) alkyl; (iv) ether; and (v) halogens. Fig. 6 shows this classification as well as the resulting frequency of occurrence for each category versus the selectivities.
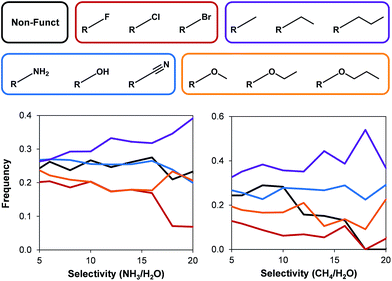 | ||
| Fig. 6 The effects of different functional groups on (left) ammonia and (right) methane selectivity over water for all hydrophobic hypothetical MOFs. | ||
In general, the structures with halogens show the lowest ammonia and methane selectivity. In the case of methane, frameworks with non-functionalized structures also exhibit low selectivities. Frameworks containing alkyl groups can show low selectivities, but also the highest selectivity towards methane and ammonia. These longer functional groups affect TIC selectivity by a combination of decreasing the pore size and being more hydrophobic. No clear trends were evident for other functional groups due to the dependency of selectivity on a combination of factors that arise from both structural properties as well as the presence and the density of the functional groups.
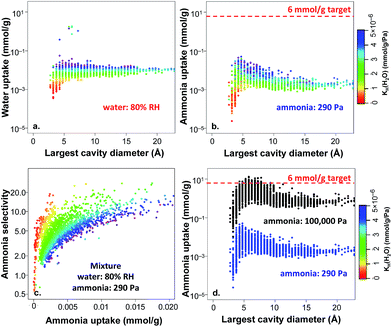
In the results above, 2777 non-functionalized hydrophobic MOFs were identified from the hypothetical MOF database based on the water KH criterion, and the selectivities were all estimated based on the ratio of Henry's constants. To further explore these materials, we performed GCMC simulations for the adsorption of ammonia, water, and their mixtures, focusing on conditions of 80% RH, i.e. a water partial pressure of 3280 Pa. Fig. 7a shows the water uptake versus the largest cavity diameter for adsorption of pure water at 3280 Pa. Since the MOFs were selected based on the satisfaction of our defined hydrophobicity criterion, the majority of the MOFs in Fig. 7a exhibit very low water uptake (i.e. less than 0.1 mmol g−1) even at 80% RH. Notably, the water adsorption correlates very well with the calculated water Henry's constants as illustrated by the color coding in Fig. 7a and not with the pore size. The small magnitude of water adsorption provides further confidence in the hydrophobic nature of the studied MOFs and the computational strategy we used to define hydrophobicity in MOFs.
As discussed above, for practical applications it is necessary to capture trace amounts of TICs at very low partial pressures from the atmosphere, and competitive water adsorption needs to be minimized. Aiming to evaluate ammonia adsorption in the identified unfunctionalized hydrophobic MOFs, we also performed GCMC simulations for pure-component ammonia at 290 Pa, corresponding to the partial pressure commonly used in breakthrough experiments.48,49 As shown in Fig. 7b, ammonia adsorption under dry conditions (i.e. pure-component ammonia) is quite low and does not exceed 0.1 mmol g−1 even for optimal pore sizes of ca. 4–5 Å; none of the hydrophobic MOFs meet the target of 6 mmol g−1 (ref. 60) for ammonia capture under these conditions. Interestingly, the ammonia uptake is also correlated with the water KH values (color coding): the more hydrophobic a MOF is, the less affinity it has towards ammonia.
Fig. 7c shows the ammonia selectivity for a binary mixture of ammonia and water as a function of ammonia uptake at 290 Pa of ammonia and 80% RH. The selectivity is defined as:
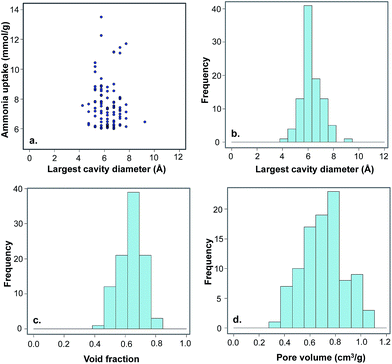
In order to test if the selected MOFs are capable of reaching the 6 mmol g−1 target for ammonia capture at a higher pressure, we also performed GCMC ammonia simulations at 100![[thin space (1/6-em)]](https://www.rsc.org/images/entities/char_2009.gif) 000 Pa (1 bar) and compared the results with those obtained at 290 Pa. As shown in Fig. 7d, the ammonia uptake is much higher under these conditions, with 97 hydrophobic MOFs above the 6 mmol g−1 target. At this high pressure, the peak in ammonia uptake is slightly shifted towards MOFs with larger pores because more ammonia molecules are able to fill the additional adsorption sites at higher pressure. The frequency of different structural properties are shown in Fig. 8 for the top 97 MOFs, in which the optimal textural properties are observed for MOFs with pore sizes between 5–7.5 Å, void fractions of 0.6–0.7, and pore volumes in the range of 0.6–0.8 cm3 g−1. A number of top MOF structures along with their constituent building blocks are shown in Fig. S6.†
000 Pa (1 bar) and compared the results with those obtained at 290 Pa. As shown in Fig. 7d, the ammonia uptake is much higher under these conditions, with 97 hydrophobic MOFs above the 6 mmol g−1 target. At this high pressure, the peak in ammonia uptake is slightly shifted towards MOFs with larger pores because more ammonia molecules are able to fill the additional adsorption sites at higher pressure. The frequency of different structural properties are shown in Fig. 8 for the top 97 MOFs, in which the optimal textural properties are observed for MOFs with pore sizes between 5–7.5 Å, void fractions of 0.6–0.7, and pore volumes in the range of 0.6–0.8 cm3 g−1. A number of top MOF structures along with their constituent building blocks are shown in Fig. S6.†
Conclusions
We presented a new computational strategy based on Henry's constants to quickly identify hydrophobic MOFs and applied it to identify 45![[thin space (1/6-em)]](https://www.rsc.org/images/entities/char_2009.gif) 975 hydrophobic materials from a pool of 137
975 hydrophobic materials from a pool of 137![[thin space (1/6-em)]](https://www.rsc.org/images/entities/char_2009.gif) 953 hypothetical MOFs. The Henry's constants also allowed the efficient calculation of the adsorption selectivity for toxic industrial chemicals (TICs) and other molecules in competitive adsorption with water. GCMC simulations of water adsorption at 80% relative humidity corroborated the existence of little water adsorption in the subset of 2777 unfunctionalized hydrophobic MOFs, providing further proof of the hydrophobic nature of the identified MOFs and the reliability of our method. The selected MOFs were also studied for methane and ammonia capture as representative non-polar and polar molecules. The simulations results show that, on the one hand, strongly hydrophilic MOFs present high competitive water adsorption and therefore exhibit poor selectivity towards TICs. On the other hand, MOFs that are too hydrophobic present low affinity for the TICs and therefore exhibit low selectivity as well. However, MOFs with moderate hydrophobicity and pore sizes comparable to the TIC's kinetic diameter deliver the highest selectivities over water. Investigation of the surface chemistry effects revealed that structures containing alkyl groups present high TIC selectivity due their high hydrophobicity as well as pore size effects.
953 hypothetical MOFs. The Henry's constants also allowed the efficient calculation of the adsorption selectivity for toxic industrial chemicals (TICs) and other molecules in competitive adsorption with water. GCMC simulations of water adsorption at 80% relative humidity corroborated the existence of little water adsorption in the subset of 2777 unfunctionalized hydrophobic MOFs, providing further proof of the hydrophobic nature of the identified MOFs and the reliability of our method. The selected MOFs were also studied for methane and ammonia capture as representative non-polar and polar molecules. The simulations results show that, on the one hand, strongly hydrophilic MOFs present high competitive water adsorption and therefore exhibit poor selectivity towards TICs. On the other hand, MOFs that are too hydrophobic present low affinity for the TICs and therefore exhibit low selectivity as well. However, MOFs with moderate hydrophobicity and pore sizes comparable to the TIC's kinetic diameter deliver the highest selectivities over water. Investigation of the surface chemistry effects revealed that structures containing alkyl groups present high TIC selectivity due their high hydrophobicity as well as pore size effects.
Acknowledgements
We thank the Army Research Office (grant W911NF-12-1-0130) and the EPSRC IAA Partnership Development Award (RG/75759) for financial support. Computational work was partly supported by Northwestern University's shared computer system, Quest (project: P20261). D. F.-J. thanks the Royal Society for funding through a University Research Fellowship. We also thank Prof. Omar Yaghi and Dr Hiroyasu Furukawa for supplying the experimental water isotherms for some of the MOFs studied in this work. We thank Dr Pritha Ghosh and Dr Diego A. Gómez-Gualdrón for fruitful discussions.References
- H. Li, M. Eddaoudi, M. O'Keeffe and O. M. Yaghi, Nature, 1999, 402, 276 CrossRef CAS
.
- G. Ferey, Chem. Soc. Rev., 2008, 37, 191 RSC
.
- S. Horike, S. Shimomura and S. Kitagawa, Nat. Chem., 2009, 1, 695 CrossRef CAS PubMed
.
- J. B. DeCoste and G. W. Peterson, Chem. Rev., 2014, 114, 5695 CrossRef CAS PubMed
.
- G. Odell Wood, Carbon, 1992, 30, 593 CrossRef
.
- G. W. Peterson, J. A. Rossin, P. B. Smith and G. W. Wagner, Carbon, 2010, 48, 81 CrossRef CAS
.
- E. Barea, C. Montoro and J. A. R. Navarro, Chem. Soc. Rev., 2014, 43, 5419 RSC
.
- J. Guo, W. S. Xu, Y. L. Chen and A. C. Lua, J. Colloid Interface Sci., 2005, 281, 285 CrossRef CAS PubMed
.
- D. Britt, H. Furukawa, B. Wang, T. G. Glover and O. M. Yaghi, Proc. Natl. Acad. Sci. U. S. A., 2009, 106, 20637 CrossRef CAS PubMed
.
- J.-R. Li, R. J. Kuppler and H.-C. Zhou, Chem. Soc. Rev., 2009, 38, 1477 RSC
.
- T. M. McDonald, J. A. Mason, X. Kong, E. D. Bloch, D. Gygi, A. Dani, V. Crocella, F. Giordanino, S. O. Odoh, W. S. Drisdell, B. Vlaisavljevich, A. L. Dzubak, R. Poloni, S. K. Schnell, N. Planas, K. Lee, T. Pascal, L. F. Wan, D. Prendergast, J. B. Neaton, B. Smit, J. B. Kortright, L. Gagliardi, S. Bordiga, J. A. Reimer and J. R. Long, Nature, 2015, 519, 303 CrossRef CAS PubMed
.
- J. M. Holcroft, K. J. Hartlieb, P. Z. Moghadam, J. G. Bell, G. Barin, D. P. Ferris, E. D. Bloch, M. M. Algaradah, M. S. Nassar, Y. Y. Botros, K. M. Thomas, J. R. Long, R. Q. Snurr and J. F. Stoddart, J. Am. Chem. Soc., 2015, 137, 5706 CrossRef CAS PubMed
.
- D. Britt, D. Tranchemontagne and O. M. Yaghi, Proc. Natl. Acad. Sci. U. S. A., 2008, 105, 11623 CrossRef CAS PubMed
.
- N. A. Khan, Z. Hasan and S. H. Jhung, J. Hazard. Mater., 2013, 244–245, 444 CrossRef CAS PubMed
.
- T. Grant Glover, G. W. Peterson, B. J. Schindler, D. Britt and O. Yaghi, Chem. Eng. Sci., 2011, 66, 163 CrossRef CAS
.
- K. C. Kim, P. Z. Moghadam, D. Fairen-Jimenez and R. Q. Snurr, Ind. Eng. Chem. Res., 2015, 54, 3257 CrossRef CAS
.
- G. W. Peterson, J. B. DeCoste, F. Fatollahi-Fard and D. K. Britt, Ind. Eng. Chem. Res., 2013, 53, 701 CrossRef
.
- J. B. DeCoste, G. W. Peterson, B. J. Schindler, K. L. Killops, M. A. Browe and J. J. Mahle, J. Mater. Chem. A, 2013, 1, 11922 CAS
.
- L. Bellarosa, S. Calero and N. Lopez, Phys. Chem. Chem. Phys., 2012, 14, 7240 RSC
.
- J. Canivet, A. Fateeva, Y. Guo, B. Coasne and D. Farrusseng, Chem. Soc. Rev., 2014, 43, 5594 RSC
.
- S. S. Kaye, A. Dailly, O. M. Yaghi and J. R. Long, J. Am. Chem. Soc., 2007, 129, 14176 CrossRef CAS PubMed
.
- J. B. Decoste, G. W. Peterson, M. W. Smith, C. A. Stone and C. R. Willis, J. Am. Chem. Soc., 2012, 134, 1486 CrossRef CAS PubMed
.
- J. G. Nguyen and S. M. Cohen, J. Am. Chem. Soc., 2010, 132, 4560 CrossRef CAS PubMed
.
- P. Z. Moghadam, P. Ghosh and R. Q. Snurr, J. Phys. Chem. C, 2015, 119, 3163 CAS
.
- P. Deria, J. E. Mondloch, E. Tylianakis, P. Ghosh, W. Bury, R. Q. Snurr, J. T. Hupp and O. K. Farha, J. Am. Chem. Soc., 2013, 135, 16801 CrossRef CAS PubMed
.
- C. Yang, U. Kaipa, Q. Z. Mather, X. Wang, V. Nesterov, A. F. Venero and M. A. Omary, J. Am. Chem. Soc., 2011, 133, 18094 CrossRef CAS PubMed
.
- H. Jasuja, N. C. Burtch, Y.-G. Huang, Y. Cai and K. S. Walton, Langmuir, 2012, 29, 633 CrossRef PubMed
.
- P. Ghosh, K. C. Kim and R. Q. Snurr, J. Phys. Chem. C, 2013, 118, 1102 Search PubMed
.
- C. E. Wilmer, M. Leaf, C. Y. Lee, O. K. Farha, B. G. Hauser, J. T. Hupp and R. Q. Snurr, Nat. Chem., 2012, 4, 83 CrossRef CAS PubMed
.
- D. Fairen-Jimenez, N. A. Seaton and T. Düren, Langmuir, 2010, 26, 14694 CrossRef CAS PubMed
.
- P. Küsgens, M. Rose, I. Senkovska, H. Fröde, A. Henschel, S. Siegle and S. Kaskel, Microporous Mesoporous Mater., 2009, 120, 325 CrossRef
.
- C. Montoro, F. Linares, E. Quartapelle Procopio, I. Senkovska, S. Kaskel, S. Galli, N. Masciocchi, E. Barea and J. A. R. Navarro, J. Am. Chem. Soc., 2011, 133, 11888 CrossRef CAS PubMed
.
- A. Comotti, S. Bracco, P. Sozzani, S. Horike, R. Matsuda, J. Chen, M. Takata, Y. Kubota and S. Kitagawa, J. Am. Chem. Soc., 2008, 130, 13664 CrossRef CAS PubMed
.
- Q. Min Wang, D. Shen, M. Bülow, M. Ling Lau, S. Deng, F. R. Fitch, N. O. Lemcoff and J. Semanscin, Microporous Mesoporous Mater., 2002, 55, 217 CrossRef
.
- P. M. Schoenecker, C. G. Carson, H. Jasuja, C. J. J. Flemming and K. S. Walton, Ind. Eng. Chem. Res., 2012, 51, 6513 CrossRef CAS
.
- N. C. Burtch, H. Jasuja and K. S. Walton, Chem. Rev., 2014, 114, 10575 CrossRef CAS PubMed
.
- B. Widom, J. Chem. Phys., 1963, 39, 2808 CrossRef CAS
.
- R. L. June, A. T. Bell and D. N. Theodorou, J. Phys. Chem. Lett., 1990, 94, 1508 CAS
.
- W. L. Jorgensen, J. Chandrasekhar, J. D. Madura, R. W. Impey and M. L. Klein, J. Chem. Phys., 1983, 79, 926 CrossRef CAS
.
- L. Zhang and J. I. Siepmann, ChemPlusChem, 2010, 75, 577 CrossRef CAS
.
- M. G. Martin and J. I. Siepmann, J. Phys. Chem. B, 1998, 102, 2569 CrossRef CAS
.
- A. K. Rappe, C. J. Casewit, K. S. Colwell, W. A. Goddard and W. M. Skiff, J. Am. Chem. Soc., 1992, 114, 10024 CrossRef CAS
.
- V. H. Dalvi, V. Srinivasan and P. J. Rossky, J. Phys. Chem. C, 2010, 114, 15553 CAS
.
- A. Ö. Yazaydın, R. Q. Snurr, T.-H. Park, K. Koh, J. Liu, M. D. LeVan, A. I. Benin, P. Jakubczak, M. Lanuza, D. B. Galloway, J. J. Low and R. R. Willis, J. Am. Chem. Soc., 2009, 131, 18198 CrossRef PubMed
.
- C. E. Wilmer, K. C. Kim and R. Q. Snurr, J. Phys. Chem. Lett., 2012, 3, 2506 CrossRef CAS PubMed
.
-
D. Frenkel and B. Smit, Understanding Molecular Simulation: From Algorithms to Applications (Computational Science), Academic Press, 2nd edn, 2001 Search PubMed
.
- D. Dubbeldam, S. Calero, D. E. Ellis and R. Q. Snurr, Mol. Simul., 2016, 42, 81 CrossRef CAS
.
- G. W. Peterson, G. W. Wagner, A. Balboa, J. Mahle, T. Sewell and C. J. Karwacki, J. Phys. Chem. C, 2009, 113, 13906 CAS
.
- G. W. Peterson, J. B. DeCoste, F. Fatollahi-Fard and D. K. Britt, Ind. Eng. Chem. Res., 2014, 53, 701 CrossRef CAS
.
- L. Sarkisov, J. Phys. Chem. C, 2012, 116, 3025 CAS
.
- C. Yang, X. Wang and M. A. Omary, J. Am. Chem. Soc., 2007, 129, 15454 CrossRef CAS PubMed
.
- H. Furukawa, F. Gándara, Y.-B. Zhang, J. Jiang, W. L. Queen, M. R. Hudson and O. M. Yaghi, J. Am. Chem. Soc., 2014, 136, 4369 CrossRef CAS PubMed
.
- G. Akiyama, R. Matsuda, H. Sato, A. Hori, M. Takata and S. Kitagawa, Microporous Mesoporous Mater., 2012, 157, 89 CrossRef CAS
.
- V. Bon, I. Senkovska, M. S. Weiss and S. Kaskel, CrystEngComm, 2013, 15, 9572 RSC
.
- H. Reinsch, M. A. van der Veen, B. Gil, B. Marszalek, T. Verbiest, D. de Vos and N. Stock, Chem. Mater., 2013, 25, 17 CrossRef CAS
.
- D.-A. Yang, H.-Y. Cho, J. Kim, S.-T. Yang and W.-S. Ahn, Energy Environ. Sci., 2012, 5, 6465 CAS
.
- Y. J. Colon and R. Q. Snurr, Chem. Soc. Rev., 2014, 43, 5735 RSC
.
- J. Masih, J. Chem. Pharm. Res., 2010, 2, 546 CAS
.
- K. Sumida, D. L. Rogow, J. A. Mason, T. M. McDonald, E. D. Bloch, Z. R. Herm, T.-H. Bae and J. R. Long, Chem. Rev., 2012, 112, 724 CrossRef CAS PubMed
.
- H. Jasuja, G. W. Peterson, J. B. Decoste, M. A. Browe and K. S. Walton, Chem. Eng. Sci., 2015, 124, 118 CrossRef CAS
.
Footnotes |
| † Electronic supplementary information (ESI) available: Force field models, Henry's constant values for selected MOFs, experimental water adsorption isotherms, ammonia and water uptakes for hydrophobic MOFs, and top candidate structures with ammonia uptake higher than 6 mol kg−1. See DOI: 10.1039/c5ta06472d |
| ‡ These authors contributed equally to this work. |
| This journal is © The Royal Society of Chemistry 2016 |

