Prediction of structures and properties of 2,4,6-triamino-1,3,5-triazine-1,3,5-trioxide (MTO) and 2,4,6-trinitro-1,3,5-triazine-1,3,5-trioxide (MTO3N) green energetic materials from DFT and ReaxFF molecular modeling†
Received
15th August 2015
, Accepted 2nd November 2015
First published on 9th November 2015
Abstract
2,4,6-Triamino-1,3,5-triazine-1,3,5-trioxide (MTO) and 2,4,6-trinitro-1,3,5-triazine-1,3,5-trioxide (MTO3N) were suggested by Klapötke et al. as candidates for green high energy density materials (HEDM), but a successful synthesis has not yet been reported. In order to predict the properties of these systems, we used quantum mechanics (PBE flavor of density functional theory) to predict the most stable conformations of MTO and MTO3N and their optimum packing into the most stable crystal structures. We found that MTO has the P21 space-group with a density of ρ = 1.92 g cm−3 while MTO3N has the P21/c space-group with a density of ρ = 2.10 g cm−3. The heats of reaction (ΔHrxn) were computed to be 1036 kcal kg−1 for MTO, 1412 kcal kg−1 for MTO3N, and 1653 kcal kg−1 for a mixture of them. These properties are comparable to those of such other useful energetic materials as RDX (ρ = 1.80 g cm−3, ΔHrxn = 1266 kcal kg−1), HMX, and PETN, making MTO and MTO3N excellent candidates for environmentally friendly HEDMs. In addition, we predicted the stability of –NH2, –NO, and –NO2 groups in water solution. We also show that the ReaxFF-lg reactive FF leads to an accurate description of the structural properties of MTO and MTO3N crystals making it practical to carry out large-scale reactive molecular dynamics simulations practical for these systems to determine the sensitivity and performance (CJ point calculation and velocity) under shear, shock, and thermal loads.
1 Introduction
High energy density materials (HEDMs) react very rapidly upon initiation releasing large amounts of energy, which makes them suitable for a number of civil and industrial applications. Recent research efforts have led to the design, characterization and evaluation of HEDMs that achieve higher performance.1 However, increased environmental and safety concerns now require consideration of such other aspects of HEDMs as toxicity, emission, contamination of ground water and soil, environmentally friendly synthesis and processing, destruction or disposal, life-span (chemical stability), storage, handling, and vulnerability to a variety of external stimuli such as accidental impact, shock, or fire. Of particular interest is the design of new HEDMs that are more stable, less sensitive and more environmentally friendly while meeting or exceeding the performance of benchmark materials such as RDX, HMX and ammonium perchlorate (AP).2 We consider here two candidate energetic materials 2,4,6-triamino-1,3,5-triazine-1,3,5-trioxide (MTO) and 2,4,6-trinitro-1,3,5-triazine-1,3,5-trioxide (MTO3N) designed by Klapötke et al. to meet these criteria. The possible synthesis steps for MTO and MTO3N are shown in Fig. 1. Korkin et al. estimated the gaseous heat of formation of MTO3N to be 108 kcal mol−1 using ab-initio calculations.3 Klapötke et al. estimated that the velocity of detonation for MTO would be 8.979 km s−1 (which places it between 8.855 km s−1 for RDX and 9.247 km s−1 for HMX-β) with a density of 1.9 g cm−3 and an impact sensitivity >30 J, much better than HMX (7 J) and RDX (7.5 J).4 They used EXPLO5 software for these calculations.5 Since the synthesis of these compounds has not yet been successful, we introduced a computational methodology to predict crystal structures of molecular solids that we illustrate by predicting the structures of these new promising green energetic materials, MTO and MTO3N. There are several techniques for structural prediction of new materials. A review of them can be found elsewhere.6 Our new methodology combines Monte Carlo (MC) sampling with molecular dynamics (MD) based both on generic force fields (FFs) and on DFT calculations to provide computationally feasible FF sampling over enough number of crystal structures with QM based optimization of the lower energy predicted structures. Thus we first apply Monte Carlo simulated annealing using Dreiding FF for crystal packing within the typical space groups of the organic materials.7,8 This allows a very large number of candidates to be sampled within each space group to ensure a sufficient sampling of the configurational space to identify candidate structures for the global minimum. We then optimize the best using MD. Finally, the best structure of each space group is optimized with QM. This methodology provides a straightforward and robust method to obtain the optimum space group and crystal structure of other unknown crystals. We use the PBE flavor of density functional theory (DFT)9 that has been validated abundantly in the literature to produce accurate results for many properties such as density, cohesive energy, and equations of state. However, until recently, DFT methods did not describe well the London dispersion or van der Waals (vdW) attraction forces resulting from dynamical correlations between fluctuating charge distributions. This problem has been solved over the last few years by adding empirical parameters to DFT functionals to correct for dispersion forces while keeping the scalability. Many popular approaches include: the Grimme corrections (e.g. DFT-D2), the M05-12 family and PBE-ulg.10–12 The Grimme corrections have been tested for a wide variety of non-covalent complexes including large vdW systems and molecules with atoms beyond the second-row.10 They have been also used to study known energetic materials. For example, Peng et al.13 used Grimme vdW corrections (DFT-D2) to study the molecular structures, mechanical properties, electronic properties, and equations of state (up to 100 GPa) of β-HMX. They obtained very good agreement between the DFT-D2 and experimental results. In addition, PBE-ulg which has been developed by our group performs DFT calculations in the periodic system that correctly captures the non-covalent interaction within 2 kcal mol−1,11 which is in the range of chemical accuracy.
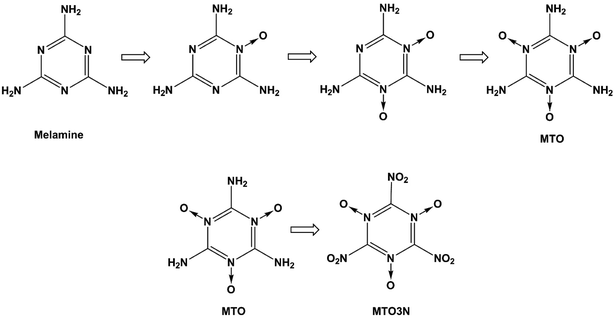 |
| | Fig. 1 Steps for synthesizing MTO and MTO3N. | |
Such prediction methods are very important as we attempt to use in silico techniques to design new materials with novel properties, allowing us to study the properties of these materials prior to synthesis. Indeed, we have also used the crystal structures predicted in this paper to study the thermal decomposition of MTO and MTO3N using ab initio quantum mechanics molecular dynamics (QMMD) methods.14 These high level QM calculations showed that the proposed MTO and MTO3N materials should have excellent performance; however, we found that MTO should be more sensitive than MTO3N because it undergoes a simultaneous two proton transfer at modest temperature or pressure. This shows the value of the structures reported herein and the importance of having a practical methodology for crystal structure prediction, which is the focus of the current paper. In addition, we report here the reaction mechanism and the expected performances of the MTO and MTO3N molecular models. We also validate the accuracy of ReaxFF reactive force field for large scale simulation of these materials.
Section 2 reports predictions of the structures of the isolated MTO and MTO3N molecules and their heats of reaction. Section 3 reports the pKa values computed for various molecular groups in the presence of water. Section 4 reports the computational search of the optimal crystal packings of these materials using Monte Carlo simulated annealing with the Dreiding non-reactive force field.15,16 Section 5 analyzes these structures further to find the minimum-energy structures of the MTO and MTO3N using periodic DFT calculations. Section 6 validates the accuracy of the ReaxFF-lg for modeling the structural properties of MTO and MTO3N crystals. Finally, the results are summarized in Section 7.
2 Structures and heats of reaction
The structures of MTO and MTO3N molecules were obtained using the B3LYP flavor of density functional theory (DFT), a hybrid method including both the generalized gradient approximation and a component of the exact Hartree–Fock (HF) exchange.17–21 These calculations were done using the 6-311G(d,p) (or 6-311G**++) basis set.22 The optimized geometries of MTO and MTO3N with the analysis of bonds and charges are shown in Fig. 2. The charges were calculated by the Mulliken population method using 6-31G** basis set.23 The six CN bonds in the rings of both MTO and MTO3N indicate strong resonance. For MTO the charge in the nitroxide is formally (N+)(O−) but there is strong resonance with the ring to incorporate the NO pi bond character with the concomitant CN double bond character to the NH2, leading to a planar structure with a 1.32 Å NO bond and a 1.33 Å CN bond. For MTO3N the steric interactions between the NO2 and the nitroxide, forces the NO2 plane to be perpendicular to the ring. The energy change with the N–C–N–O dihedral angle (see Fig. 3) shows the same effect. This leads to a normal CN single bond of 1.47 Å but a shorter nitroxide NO bond of 1.26 Å. Both MTO and MTO3N have zero dipole moment by symmetry.
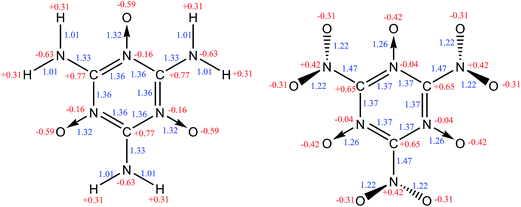 |
| | Fig. 2 The molecular structures of MTO (left) and MTO3N (right). Mulliken charges (red) and bond distances (blue) are shown. | |
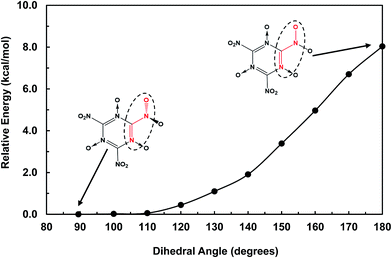 |
| | Fig. 3 The energy change with the N–C–N–O dihedral angle (red) in the MTO3N molecule. The out-of-plane –NO2 group (89.5°) was found to be the most stable form. | |
The heats of reaction (ΔHrxn) were computed with the B3LYP functional and 6-311G**++ basis set. We referred them to the most likely stable products from the decomposition of MTO and MTO3N and their mixtures shown in reactions (1)–(3). MTO and MTO3N have good performances and the mixture of them has much higher performance compare to standard energetic materials (see Table 1).
| | | MTO3N → 3N2 + 1.5O2 + 3CO2 | (2) |
| | | 2(MTO3N) + MTO → 9N2 + 3H2O + 9CO2 | (3) |
Table 1 Comparison of the heats of reaction (ΔHrxn) of MTO, MTO3N, and their mixture with those of RDX, HMX, PETN, and TNT2
| Compound |
ΔHrxn (kcal kg−1) |
| MTO |
−1036 |
| MTO3N |
−1412 |
| MTO + MTO3N |
−1653 |
| RDX |
−1266 |
| HMX |
−1255 |
| PETN |
−1398 |
| TNT |
−871 |
3 Stability of –NH2, –NO2, and –NO groups in water
In order to determine the stability of –NH2, –NO2, and –NO groups in water the acid dissociation constants (pKa) were computed for reactions shown in Table 2. The pKa of HA (aq) was computed according to the thermodynamic cycle shown in Fig. 4 and based on the following computational method.24–26 Here, ΔG0g is the gas phase standard free energy, and ΔG0aq is the solution-phase standard free energy of deprotonation. ΔG0solv(HA), ΔG0solv(A−), and ΔG0solv(H+) are the standard free energies of solvation of HA, A−, and H+, respectively. According to Fig. 4, the ΔG0aq is expressed by| | 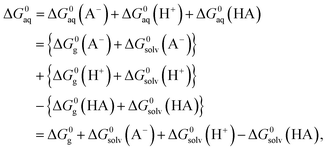 | (4) |
and then is used in the following equation to calculate the pKa of HA (aq),| |  | (5) |
Table 2 Computed pKa values for protonation and deprotonation of –NH2, –NO2, and –NO groups of MTO and MTO3N molecules
| No. |
Reaction |
QM |
| 1 |

|
4.1 (exp. 5.0) |
| 2 |

|
18.5 |
| 3 |

|
−4.8 |
| 4 |

|
−5.8 |
| 5 |

|
−30.2 |
| 6 |

|
−11.7 |
| 7 |

|
−13.4 |
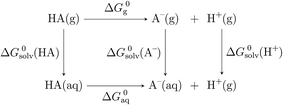 |
| | Fig. 4 Thermodynamic cycle used in the calculation of pKa. | |
The ΔG0g in eqn (4) refers to the sum of the standard Gibbs free energies of HA, A−, and H+. Each standard gas free energy was computed using
| | | ΔG0g(X) = E0 K + ZPE + ΔΔG0→298 K, | (6) |
where X is HA, A
−, or H
+,
E0 K is the total energy at 0 K, ZPE is the zero-point energy, and ΔΔ
G0→298 K is the Gibbs free energy change from 0 to 298 K. The
E0 K for each molecule was obtained by QM for the optimized geometry. The ZPE and ΔΔ
G0→298 K are computed from the vibrational frequency calculations. The translational and rotational free energies were computed in the ideal gas approximation. The geometries and energies used the B3LYP functional and 6-311G**++ basis set. The standard free energy of solvation in water (
i.e. Δ
G0solv(HA) and Δ
G0solv(A
−)) was calculated using the continuum-solvation approach
27–29 at the B3LYP/6-311G**++ level where the interactions between the molecule and solvent were computed by the Poisson–Boltzmann (PB) equation numerically.
30 To build the solute envelop the following atomic radii were used based on previous studies:
29 2.00 Å for C (sp
2), 1.50 Å for N in the –N
![[double bond, length as m-dash]](https://www.rsc.org/images/entities/char_e001.gif)
O group, 2.00 Å for N in the –NO
2 group, 2.00 Å for O, and 1.15 Å for H. The Δ
G0g(H
+) = 2.5
RT −
TΔ
S0 and Δ
G0solv(H
+) were obtained to be −6.28 kcal mol
−1 and −270.3 kcal mol
−1 according to the literature.
24–26,31 Since some of the molecules have two or more equivalent sites for protonation or deprotonation (see below), an extra stabilization in free energy due to the configurational entropy (−
RT![[thin space (1/6-em)]](https://www.rsc.org/images/entities/char_2009.gif)
ln
![[thin space (1/6-em)]](https://www.rsc.org/images/entities/char_2009.gif) nd
nd) was added for such cases, where
nd is the
n-fold degeneracy number,
R is the gas constant and
T is the temperature (298.15 K). Reaction
(1) in
Table 2 shows the deprotonation reaction for one of the melamine's tautomers. The tautomer is made by the protonation of the nitrogen atom on the triazine ring. Because there are three equivalent sites for this nitrogen, the degeneracy is considered to be 3-fold degeneracy (
nd = 3). The computed p
Ka value for reaction
(1) is in good agreement with the experimental one
32,33 which shows the accuracy of the computational method. Reaction
(2) shows the deprotonation from one of the –NH
2 groups of the MTO molecule (
nd = 3). The p
Ka of 18.5 shows the high stability of the –NH
2 group toward dissociation in water. In reaction
(3), the protonated –NH
2 group (–NH
3+) in the MTO molecule (
nd = 3) is very unstable (p
Ka = −4.8) and quickly dissociates to produce the –NH
2 group. The –N
![[double bond, length as m-dash]](https://www.rsc.org/images/entities/char_e001.gif)
O group is also very stable in water as shown in reaction
(4), because the deprotonation of the –N
![[double bond, length as m-dash]](https://www.rsc.org/images/entities/char_e001.gif)
OH
+ tautomer (
nd = 3) is the favorable reaction (p
Ka = −5.8). Similarly in reaction
(5), the –NO
2 group is very stable and deprotonation of –NO
2H
+ (
nd = 1) occurs quickly. Reactions
(6) and
(7) show the stability of the –N
![[double bond, length as m-dash]](https://www.rsc.org/images/entities/char_e001.gif)
O group toward protonation in the presence of both –NH
2 and –NO
2 groups at 1- and 2-fold degeneracies (
nd = 1, 2).
In summary, our calculations predict that the proposed MTO and MTO3N materials would remain stable and safe in a water environment or severe weather conditions which are important factors in developing new energetic materials.
4 Crystal packing using Monte Carlo (MC) simulated annealing
Predicting crystal structures should in principle require examining all 230 space groups considering various numbers of molecules per asymmetric unit. However, 75% of organic crystals belong to only five space groups: P21/c (36.0%), P![[1 with combining macron]](https://www.rsc.org/images/entities/char_0031_0304.gif) (13.7%), P212121 (11.6%), P21 (6.7%) and C2/c (6.6%).34,35 Therefore, we considered the packing of MTO and MTO3N into the crystals of just these five space groups using the Dreiding non-reactive FF15,16 with charges from QM based on the Mulliken populations. We used Ewald summation for long-range non-bond interactions.36 Geometry optimizations used conjugate gradient (CG) algorithm.
(13.7%), P212121 (11.6%), P21 (6.7%) and C2/c (6.6%).34,35 Therefore, we considered the packing of MTO and MTO3N into the crystals of just these five space groups using the Dreiding non-reactive FF15,16 with charges from QM based on the Mulliken populations. We used Ewald summation for long-range non-bond interactions.36 Geometry optimizations used conjugate gradient (CG) algorithm.
We used Monte Carlo (MC) simulated annealing to search for the global minimum energy as a thermodynamic problem. This involves heating the crystal quickly to high temperature and then cooling slowly to anneal the heated structure. During both phases, we sampled a large number of trial packings by rotating and translating the rigid molecular units, within the asymmetric unit cell while modifying the cell parameters. This procedure efficiently selects low potential energy (E) packings for each space group. The standard Metropolis algorithm37 is used to determine whether generated trial structures are accepted or rejected. The acceptance ratio (probability) is computed by
| |  | (7) |
where
En and
Em are the energy of new and old configurations,
R is the universal gas constant and
T is the temperature. Therefore transition from higher energy to lower energy (
i.e. En −
Em < 0) is always accepted but transition from lower to higher energy (
i.e. En −
Em > 0) is accepted with a probability which goes to zero as
En and
Em become close to each other. In addition, if the density of the structure falls below 0.3 g cm
−3, during a trial step, it is always rejected. During the heating phase the new temperature is obtained by
Tnew =
Told (1.0 +
Th) where
Told is the temperature of the previous trial and
Th is the heating factor. The heating continues until the predefined number of consecutive trial moves (
nh) have been accepted. If the current trial is rejected, the MC move factor (
mf) is halved and if it is accepted the
mf is doubled. During the cooling phase the new temperature is obtained in the same way by
Tnew =
Told (1.0 +
Tc) where
Tc is the cooling factor. It is crucial to utilize correct temperature schemes to obtain accurate and efficient samplings of packing arrangements. For example, lower
Tc values should be used when it is hard to pack the structure (
i.e. more degrees of freedom). Therefore,
Tc is defined by the following equation to be a dynamic function of number of fragments in the unit cell,
| |  | (8) |
where
N is the number of fragments in the unit cell. The packing parameters used during MC simulated annealing are given in
Table 3. The final crystal structures from the MC consist of a series of unoptimized molecular packings for each space group, which must be optimized subsequently to obtain the true minimum energy structures. An example of MC simulated annealing steps is shown in
Fig. 5 for MTO3N with the
P2
12
12
1 space group. During the heating phase the temperature was increased to about 5200 K and then reduced to 300 K during cooling phases. During 4680 steps (heating and cooling), 2930 structures were accepted. Before geometry optimization, duplicates were filtered and removed reducing the number of accepted structures to 206.
Table 3 MC simulated annealing parameters for optimal packing search
| Param. |
Value |
|
T
h
|
0.025 |
|
T
c
|
0.001 |
|
n
h
|
12 |
|
T
min
|
300.0 K |
|
T
max
|
100![[thin space (1/6-em)]](https://www.rsc.org/images/entities/char_2009.gif) 000.0 K 000.0 K |
|
N
max
|
7000 |
|
m
fmin
|
0.1 × 10⁻⁸ |
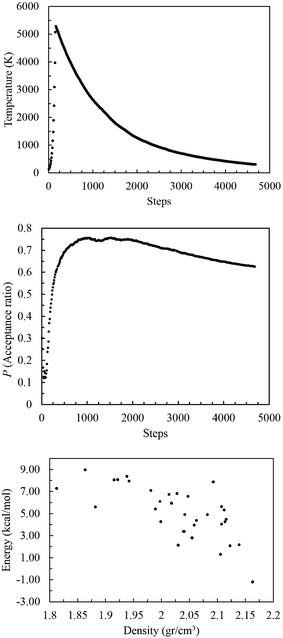 |
| | Fig. 5 The acceptance ratio (top) and temperature change (middle) with time during Monte Carlo simulated annealing of MTO3N (P212121). The energy versus density (bottom) is plotted after the Dreiding FF optimization of accepted crystal trials. The structure with the lowest energy is selected for the periodic DFT optimization. | |
Fig. 5 shows that the stability generally increases (lower E values) as the density increases for each space group. The optimized structure with the lowest potential energy (i.e. the most stable) was selected for periodic QM calculations in the next step.
The most stable structures from MC simulated annealing and FF optimization for different space groups of MTO and MTO3N are shown in Fig. 6 and 7, respectively.
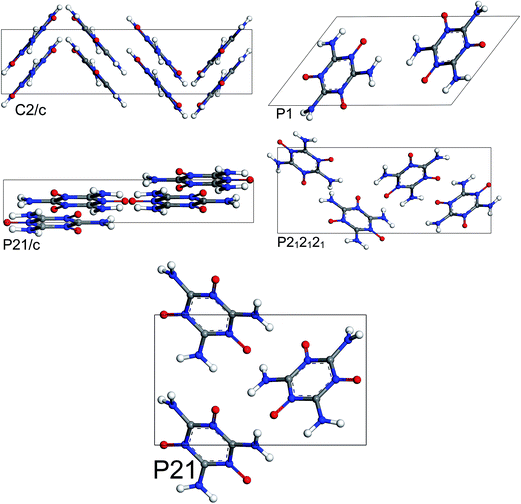 |
| | Fig. 6 Most stable structures of MTO for 5 different space groups obtained using Monte Carlo simulated annealing and Dreiding FF optimization. | |
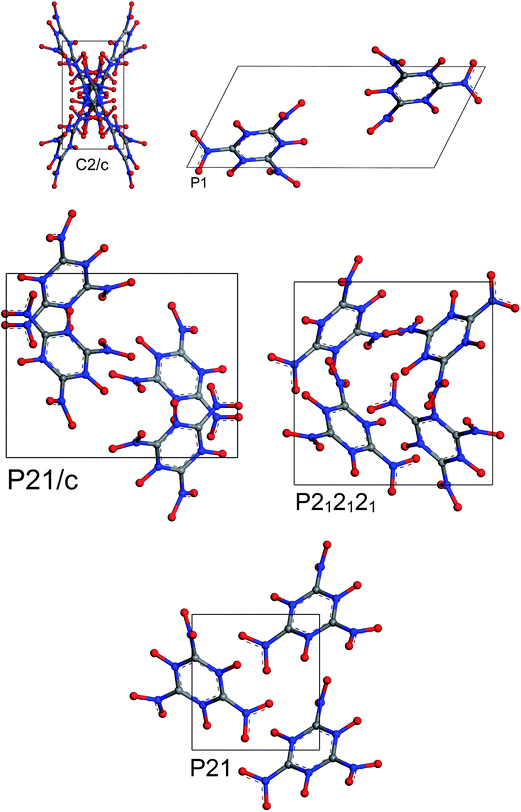 |
| | Fig. 7 Most stable structures of MTO3N for 5 different space groups obtained using Monte Carlo simulated annealing and Dreiding FF optimization. | |
5 Crystal optimization using periodic DFT calculations
Each of the final structures of each of the five space groups obtained in the previous section was used as an input for crystal cell optimization using periodic DFT, based on the Perdew–Burke–Ernzerhof (PBE) generalized gradient approximation (GGA) for the exchange–correlation energy9 and a plane wave energy cutoff of 550 eV. We used the convergence criteria of E −6 eV for energy and E −4 eV Å−1 for force. The k-space sampling was the gamma point centered with full space group symmetry. All calculations in this section were performed using the VASP package.38,39
These calculations include either the empirical correction for long-range dispersive forces from Grimme (PBE-D2)10 or the universal low-gradient12 corrections (PBE-ulg) in separate cell optimizations.
The results of periodic DFT calculations for MTO are shown in Table 4 and Fig. 8 and for MTO3N are shown in Table 5 and Fig. 9. Tables 4 and 5 provide the optimized crystal density, heat of vaporization (ΔHvap), and stability (i.e. the minimum-energy) rank for the space groups using PBE-D2 and PBE-ulg. ΔHvap was computed with respect to the single molecule of the corresponding system. The P21 space group was predicted by both PBE-D2 and PBE-ulg methods to be the most stable minimum-energy structure of MTO with close densities of around 1.92 g cm−3 and 1.86 g cm−3, respectively (Table 4). The PBE-ulg and PBE-D2 predict the P21 space group to be 3.2 kcal mol−1 and 3.0 kcal mol−1 more stable than P212121, respectively. In the case of MTO3N, the P21/c was also predicted to be the most stable structure by both PBE-D2 and PBE-ulg methods with close densities of 2.10 g cm−3 and 2.02 g cm−3, respectively (Table 5). The unit cell parameters with visualization from different angles for MTO (P21) and MTO3N (P21/c) are given in Fig. 10 and 11, respectively. The coordinates and cell information of these crystals are provided in the ESI.†
Table 4 DFT:PBE-ulg and PBE-D2 results. Heat of vaporization (ΔHvap, kcal mol−1 per MTO), density (ρ, g cm−3) and minimum-energy rank for the five predicted MTO crystals (shown in Fig. 8)
| Structure |
ρ
ulg (g cm−3) |
ΔHvapulg (kcal mol−1) |
ρ
D2 (g cm−3) |
ΔHvapD2 (kcal mol−1) |
Rankulg |
RankD2 |
| MTO molec. |
— |
0.0 |
— |
0.0 |
— |
— |
|
P21 |
1.86 |
−38.7 |
1.92 |
−42.2 |
1 |
1 |
|
P212121 |
1.79 |
−35.5 |
1.86 |
−39.2 |
2 |
2 |
|
P21/c |
1.81 |
−33.4 |
1.88 |
−36.8 |
3 |
3 |
P![[1 with combining macron]](https://www.rsc.org/images/entities/char_0031_0304.gif) |
1.80 |
−33.3 |
1.87 |
−36.7 |
4 |
4 |
|
C2/c |
1.78 |
−33.1 |
1.87 |
−36.4 |
5 |
5 |
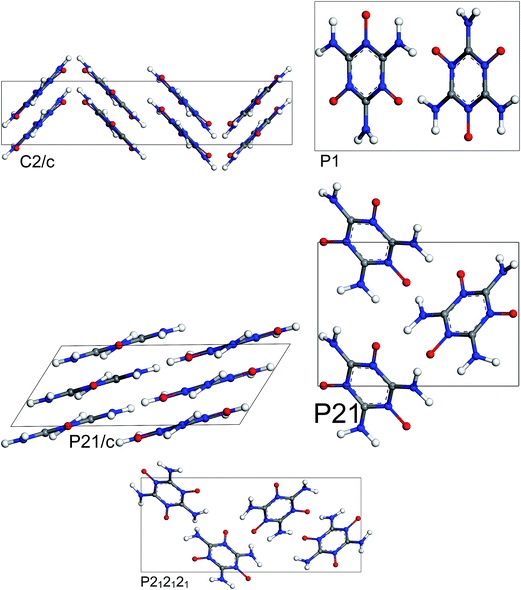 |
| | Fig. 8 Most stable structures of MTO for 5 different space groups obtained from optimization using periodic DFT calculations and the PBE-ulg functional with dispersive force corrections. | |
Table 5 DFT:PBE-ulg and PBE-D2 results. Heat of vaporization (ΔHvap, kcal mol−1 per MTO3N), density (ρ, g cm−3) and minimum-energy rank for the five predicted MTO3N crystals (shown in Fig. 9)
| Structure |
ρ
ulg (g cm−3) |
ΔHvapulg (kcal mol−1) |
ρ
D2 (g cm−3) |
ΔHvapD2 (kcal mol−1) |
Rankulg |
RankD2 |
| MTO3N molec. |
— |
0.0 |
— |
0.0 |
— |
— |
|
P21/c |
2.02 |
−14.9 |
2.10 |
−18.4 |
1 |
1 |
|
C2/c |
1.91 |
−14.3 |
2.00 |
−16.9 |
2 |
3 |
P![[1 with combining macron]](https://www.rsc.org/images/entities/char_0031_0304.gif) |
1.95 |
−13.8 |
1.99 |
−17.0 |
3 |
2 |
|
P21 |
1.95 |
−12.6 |
1.99 |
−16.0 |
4 |
4 |
|
P212121 |
1.98 |
−11.0 |
2.04 |
−14.1 |
5 |
5 |
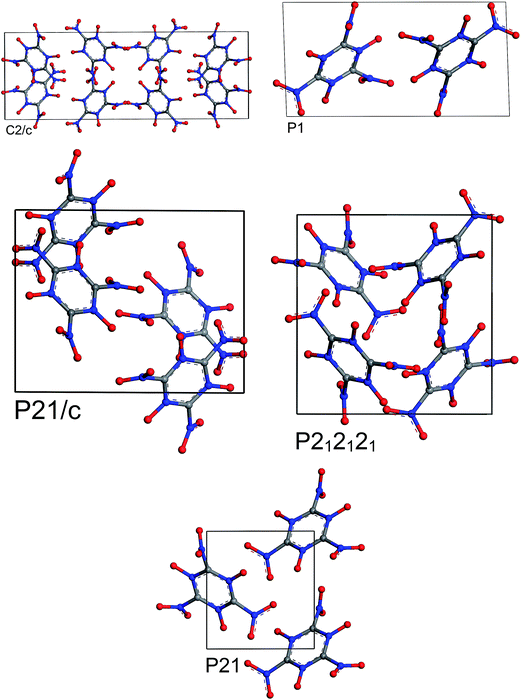 |
| | Fig. 9 Most stable structures of MTO3N for 5 different space groups obtained from optimization using periodic DFT calculations and the PBE-ulg functional with dispersive force corrections. | |
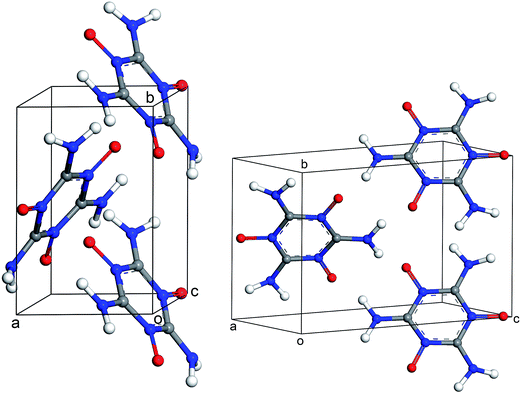 |
| | Fig. 10 Different views of the crystal structure of MTO (P21) obtained after periodic DFT cell optimization. The unit cell parameters are: a = 4.6 Å, b = 7.0 Å, c = 10.0 Å, α = 90.0°, β = 103.6°, and γ = 90.0°. | |
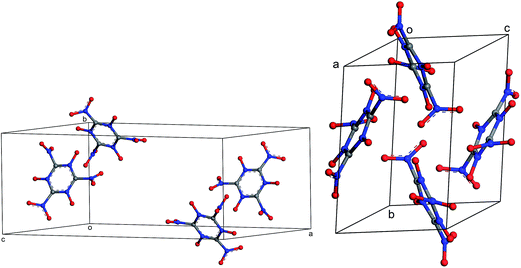 |
| | Fig. 11 Different views of the crystal structure of MTO3N (P21/c) obtained after periodic DFT cell optimization. The unit cell parameters are: a = 19.4 Å, b = 9.0 Å, c = 8.5 Å, α = 90.0°, β = 144.1°, and γ = 90.0°. | |
The hydrogen-bond (HB) coupling in the MTO (P21) crystal is shown in Fig. 12 which includes a super-cell crystal of the MTO (P21). The intermolecular HB attraction between the H atom of the –NH2 groups and the O atom of a nearby –NO group causes the –NH2 to slightly bend toward the –NO group pulling it out of the plane. To further understand this effect, we selected two adjacent molecules from the crystal structure of MTO (P21) for non-periodic QM optimization (see Fig. 13) using the M06 functional11 with the 6-311G**++ basis set, which allows for a more accurate description of the interaction. The results in Fig. 13 show that the hydrogen-bond interaction (site 1) keeps the –NH2 group out of plane as in the crystal structure whereas the other –NH2 group (site 2) no longer has intermolecular interaction with the –NO group becoming planar.
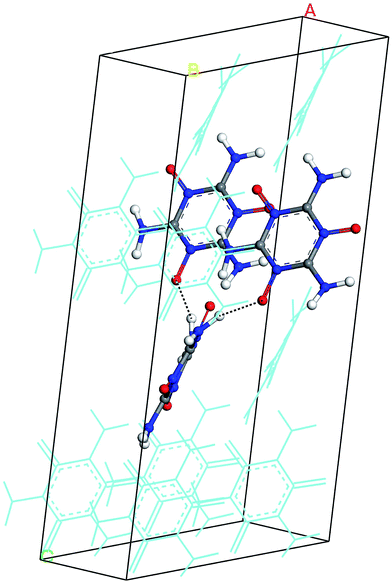 |
| | Fig. 12 The hydrogen-bond (HB) effect on the MTO (P21) crystal. For a better view, a super cell was generated by duplicating a and c dimensions. The dotted lines show the HB between H and O atoms of the adjacent molecules (displayed with solid balls and sticks). For distinction, other molecules in the system are displayed by thin lines. | |
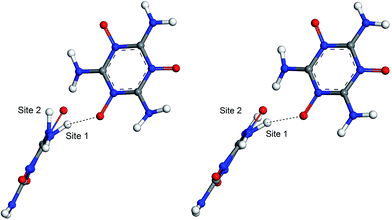 |
| | Fig. 13 The hydrogen-bond (HB) effect before (left) and after (right) QM minimization using the M06 functional and 6-311G**++ basis set. The molecules were extracted from the crystal of MTO (P21) (see Fig. 12). After minimization site 1 remains unchanged due to the HB effect while the –NH2 groups at site 2 become planar since the HB effect does not exist for this site. | |
6 Reactive molecular dynamics using ReaxFF-lg
Simulating such phenomena as shock compression and detonation require length and time scales far beyond DFT capabilities. Instead, we use ReaxFF reactive FF40–44 to study the decomposition mechanism and shock behavior. This methodology has been used for many energetic materials, including triacetonetriperoxide (TATP),45 hexahydro-1,3,5-trinitro-1,3,5-s-triazine (RDX),46–48 pentaerythritol tetranitrate (PETN),49 octahydro-1,3,5,7-tetranitro-1,3,5,7-tetrazocine (HMX),50 1,3,5-triamino-2,4,6-trinitrobenzene (TATB),50 and nitromethane.51
Such simulations have provided valuable information on initial chemical decomposition and subsequent energy release processes on a system with millions of atoms.52 ReaxFF-lg is the extension of ReaxFF, in which the London dispersion (van der Waals attraction) has been improved by adding a long-range-correction term. Here we use the low-gradient form, which is constant for distances much shorter than van der Waals radii and proportional to 1/r6 for long distances.53 ReaxFF-lg has been tested for several energetic materials53 and shown to increase the accuracy of the equilibrium cell parameters for molecular crystals. To test the accuracy of ReaxFF-lg for MTO (P21) and MTO3N (P21/c) space groups, we compare in Table 6 the optimum cell parameters from DFT and ReaxFF-lg. The good agreement here validates the current ReaxFF-lg for large-scale simulations of these materials. Fig. 14 and 15 show the conservation of energy and convergence of the total pressure and pressure components during the cell optimization of MTO and MTO3N crystals, respectively. All calculations in this section were performed using ReaxFF-lg implemented in LAMMPS.54 The time step was 0.1 fs and the CG method was used for energy minimization.
Table 6 Comparison of the equilibrium super-cell lattice parameters for the most stable MTO (P21) and MTO3N (P21/c) structures calculated from ReaxFF-lg and from DFT
| System |
Simulation |
a (Å) |
b (Å) |
c (Å) |
α (deg) |
β (deg) |
γ (deg) |
Density (g cm−3) |
| MTO |
DFT |
9.18 |
13.95 |
10.01 |
90.00 |
103.64 |
90.00 |
1.86 |
| ReaxFF-lg |
9.171 |
13.90 |
10.05 |
90.00 |
103.79 |
90.00 |
1.86 |
| MTO3N |
DFT |
19.42 |
9.02 |
16.95 |
90.00 |
144.10 |
90.00 |
2.02 |
| ReaxFF-lg |
19.42 |
9.02 |
16.95 |
90.00 |
144.10 |
90.00 |
2.02 |
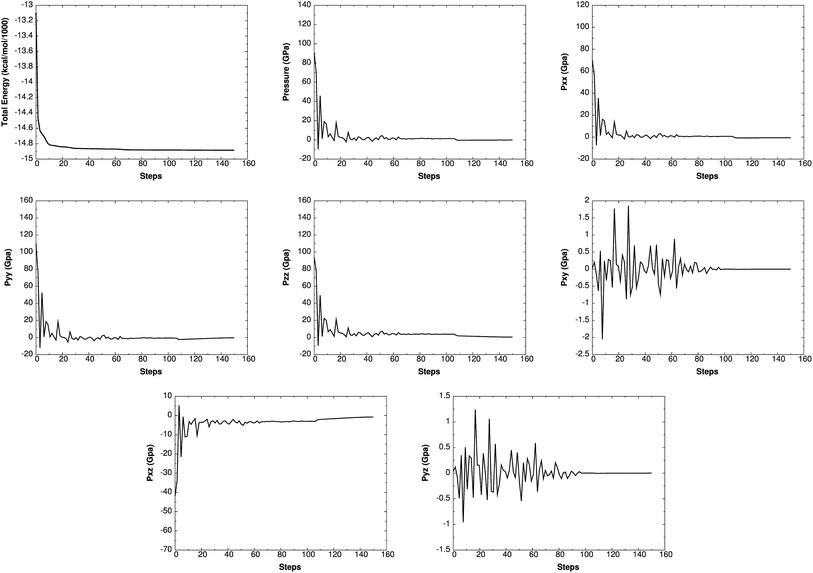 |
| | Fig. 14 The change of energy, total pressure, and pressure components with time during minimization and box relaxation simulations of the MTO (P21) crystal. A super-cell system was generated by duplicating the a and b dimensions of the unit cell. | |
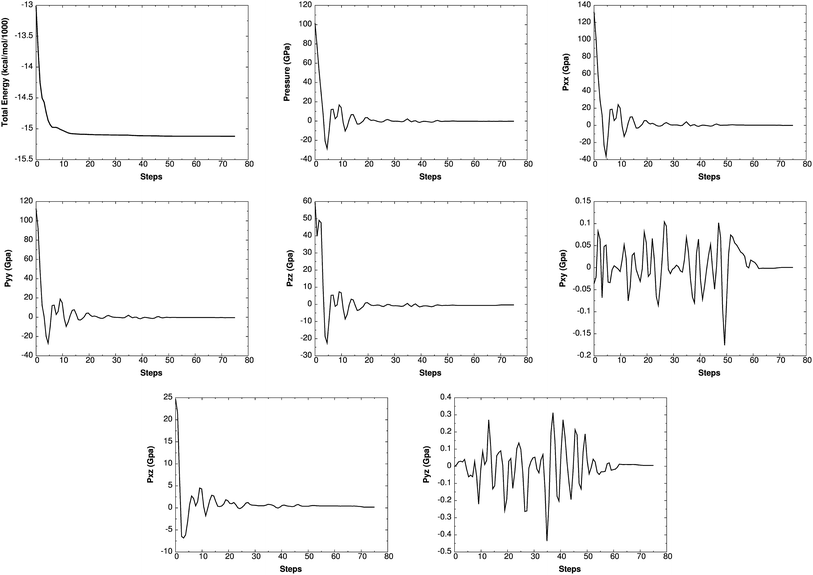 |
| | Fig. 15 The change of energy, total pressure, and pressure components with time during minimization and box relaxation simulations of the MTO3N (P21/c) crystal. A super-cell system was generated by duplicating the c dimension of the unit cell. | |
7 Summary
We report predictions using quantum mechanics of the most stable crystal structures of MTO and MTO3N, two promising green high-energy density materials. These predictions were based on Monte Carlo simulated annealing using the Dreiding FF to find the most stable polymorphs of these materials. Then, for the most promising space groups and packings, we performed periodic DFT calculations with correction for non-covalent dispersive interactions (PBE-ulg and PBE-D2) to optimize for each space group obtained from the FF annealing step to obtain finally the optimum space group and crystal structure. For MTO we find the P21 space group with a density of 1.92 g cm−3 and a heat of reaction of 1036 kcal kg−1. For MTO3N we find the P21/c space group with a density of 2.10 g cm−3 and a heat of reaction of 1412 kcal kg−1. Thus MTO and MTO3N have densities and heats of reaction in the range of other energetic materials such as RDX (1266 kcal kg−1), HMX (1255 kcal kg−1), PETN (1398 kcal kg−1), and TNT (871 kcal kg−1). We also find that the mixture of MTO and MTO3N has a heat of reaction of 1653 kcal kg−1 which is much higher than other energetic materials. We calculated the pKa values for MTO and MTO3N, concluding that they are stable in water solution. Finally, we validated that the published ReaxFF-lg reactive FF reproduces the crystal structures of MTO and MTO3N.
Acknowledgements
This work was supported by the ONR (N00014-12-1-0538, Dr Cliff Bedford).
References
-
J. Akhavan, The Chemistry of Explosives, Royal Society of Chemistry, 2011 Search PubMed.
-
R. Meyer, J. Köhler and A. Homburg, Explosives, John Wiley & Sons, 2008 Search PubMed.
- A. A. Korkin, A. Lowrey, J. Leszczynski, D. B. Lempert and R. J. Bartlett, J. Phys. Chem. A, 1997, 101, 2709–2714 CrossRef CAS.
-
T. M. Klapötke, personal communication, 2014.
-
M. Sućeska, EXPLO5 program, Zagreb, Croatia, 2005 Search PubMed.
- S. M. Woodley and R. Catlow, Nat. Mater., 2008, 7, 937–946 CrossRef CAS PubMed.
- J. Pannetier, J. Bassas-Alsina, J. Rodriguez-Carvajal and V. Caignaert, Nature, 1990, 346, 343–345 CrossRef CAS.
- J. C. Schön and M. Jansen, Angew. Chem., Int. Ed., 1996, 35, 1286–1304 CrossRef.
- J. P. Perdew, K. Burke and M. Ernzerhof, Phys. Rev. Lett., 1996, 77, 3865 CrossRef CAS PubMed.
- S. Grimme, J. Comput. Chem., 2006, 27, 1787–1799 CrossRef CAS PubMed.
- Y. Zhao and D. G. Truhlar, Theor. Chem. Acc., 2008, 120, 215–241 CrossRef CAS.
- H. Kim, J.-M. Choi and W. A. Goddard III, J. Phys. Chem. Lett., 2012, 3, 360–363 CrossRef CAS PubMed.
- Q. Peng, G. Wang, G.-R. Liu and S. de,
et al.
, Phys. Chem. Chem. Phys., 2014, 16, 19972–19983 CAS.
- C.-C. Ye, Q. An, T. Cheng, S. Zybin, S. Naserifar, X.-H. Ju and W. A. Goddard III, J. Mater. Chem. A, 2015, 3, 12044–12050 CAS.
- A. Tkatchenko and M. Scheffler, Phys. Rev. Lett., 2009, 102, 073005 CrossRef PubMed.
- S. L. Mayo, B. D. Olafson and W. A. Goddard, J. Phys. Chem., 1990, 94, 8897–8909 CrossRef CAS.
- A. D. Becke, J. Chem. Phys., 1993, 98, 5648–5652 CrossRef CAS.
-
J. C. Slater, Quantum Theory of Molecules and Solids, McGraw-Hill, New York, 1974, vol. 4 Search PubMed.
- A. D. Becke, Phys. Rev. A: At., Mol., Opt. Phys., 1988, 38, 3098 CrossRef CAS.
- S. Vosko, L. Wilk and M. Nusair, Can. J. Phys., 1980, 58, 1200–1211 CrossRef CAS.
- C. Lee, W. Yang and R. G. Parr, Phys. Rev. B: Condens. Matter Mater. Phys., 1988, 37, 785 CrossRef CAS.
- M. J. Frisch, J. A. Pople and J. S. Binkley, J. Chem. Phys., 1984, 80, 3265–3269 CrossRef CAS.
- M. M. Francl, W. J. Pietro, W. J. Hehre, J. S. Binkley, M. S. Gordon, D. J. DeFrees and J. A. Pople, J. Chem. Phys., 1982, 77, 3654–3665 CrossRef CAS.
- C. Lim, D. Bashford and M. Karplus, J. Phys. Chem., 1991, 95, 5610–5620 CrossRef CAS.
- I. Topol, G. Tawa, S. Burt and A. Rashin, J. Phys. Chem. A, 1997, 101, 10075–10081 CrossRef CAS.
- Y. H. Jang, L. C. Sowers, T. Cagin and W. A. Goddard, J. Phys. Chem. A, 2001, 105, 274–280 CrossRef CAS.
- D. J. Tannor, B. Marten, R. Murphy, R. A. Friesner, D. Sitkoff, A. Nicholls, B. Honig, M. Ringnalda and W. A. Goddard III, J. Am. Chem. Soc., 1994, 116, 11875–11882 CrossRef CAS.
- B. Honig and A. Nicholls, Science, 1995, 268, 1144–1149 CAS.
- B. Marten, K. Kim, C. Cortis, R. A. Friesner, R. B. Murphy, M. N. Ringnalda, D. Sitkoff and B. Honig, J. Phys. Chem., 1996, 100, 11775–11788 CrossRef CAS.
- A. Nicholls and B. Honig, J. Comput. Chem., 1991, 12, 435–445 CrossRef CAS.
- Y. H. Jang, S. Hwang, S. B. Chang, J. Ku and D. S. Chung, J. Phys. Chem. A, 2009, 113, 13036–13040 CrossRef CAS PubMed.
- J. K. Dixon, N. Woodberry and G. Costa, J. Am. Chem. Soc., 1947, 69, 599–603 CrossRef CAS.
-
D. Lide and W. Haynes, Crc Handbook of Chemistry and Physics: a Ready-Reference Book of Chemical and Physical Data, ed. D. R. Lide and W. M. Haunes, CRC, Boca Raton, Fla, 2009 Search PubMed.
- A. D. Mighell, V. L. Himes and J. Rodgers, Acta Crystallogr., Sect. A: Found. Crystallogr., 1983, 39, 737–740 CrossRef.
- V. Belsky and P. Zorkii, Acta Crystallogr., Sect. A: Cryst. Phys., Diffr., Theor. Gen. Crystallogr., 1977, 33, 1004–1006 CrossRef.
- P. P. Ewald, Ann. Phys., 1921, 369, 253–287 CrossRef.
- N. Metropolis, A. W. Rosenbluth, M. N. Rosenbluth, A. H. Teller and E. Teller, J. Chem. Phys., 1953, 21, 1087–1092 CrossRef CAS.
- G. Kresse and J. Furthmüller, Phys. Rev. B: Condens. Matter Mater. Phys., 1996, 54, 169 CrossRef.
- G. Kresse and J. Hafner, Phys. Rev. B: Condens. Matter Mater. Phys., 1993, 47, 558 CrossRef CAS.
- S. Naserifar, L. Liu, W. A. Goddard III, T. T. Tsotsis and M. Sahimi, J. Phys. Chem. C, 2013, 117, 3308–3319 CAS.
- S. Naserifar, W. A. Goddard III, L. Liu, T. T. Tsotsis and M. Sahimi, J. Phys. Chem. C, 2013, 117, 3320–3329 CAS.
- A. Jaramillo-Botero, S. Naserifar and W. A. Goddard III, J. Chem. Theory Comput., 2014, 10, 1426–1439 CrossRef CAS PubMed.
- S. Naserifar, T. T. Tsotsis, W. A. Goddard III and M. Sahimi, J. Membr. Sci., 2015, 473, 85–93 CrossRef CAS.
- S. Naserifar, W. A. Goddard III, T. T. Tsotsis and M. Sahimi, J. Chem. Phys., 2015, 142, 174703 CrossRef PubMed.
- A. C. van Duin, Y. Zeiri, F. Dubnikova, R. Kosloff and W. A. Goddard, J. Am. Chem. Soc., 2005, 127, 11053–11062 CrossRef CAS PubMed.
- K.-I. Nomura, R. K. Kalia, A. Nakano, P. Vashishta, A. C. van Duin and W. A. Goddard III, Phys. Rev. Lett., 2007, 99, 148303 CrossRef PubMed.
-
A. Strachan, E. M. Kober, A. C. van Duin, J. Oxgaard and W. A. Goddard III, Thermal Decomposition of RDX from Reactive Molecular Dynamics, Dtic document technical report, 2005 Search PubMed.
- A. Strachan, A. C. van Duin, D. Chakraborty, S. Dasgupta and W. A. Goddard III, Phys. Rev. Lett., 2003, 91, 098301 CrossRef PubMed.
- J. Budzien, A. P. Thompson and S. V. Zybin, J. Phys. Chem. B, 2009, 113, 13142–13151 CrossRef CAS PubMed.
- L. Zhang, S. V. Zybin, A. C. van Duin, S. Dasgupta, W. A. Goddard III and E. M. Kober, J. Phys. Chem. A, 2009, 113, 10619–10640 CrossRef CAS PubMed.
- S.-P. Han, A. C. van Duin, W. A. Goddard III and A. Strachan, J. Phys. Chem. A, 2011, 115, 6534–6540 CrossRef CAS PubMed.
- A. Nakano, R. K. Kalia, K.-I. Nomura, A. Sharma, P. Vashishta, F. Shimojo, A. C. van Duin, W. A. Goddard, R. Biswas and D. Srivastava, Comput. Mater. Sci., 2007, 38, 642–652 CrossRef CAS.
- L. Liu, Y. Liu, S. V. Zybin, H. Sun and W. A. Goddard III, J. Phys. Chem. A, 2011, 115, 11016–11022 CrossRef CAS PubMed.
- S. Plimpton, J. Comput. Phys., 1995, 117, 1–19 CrossRef CAS.
Footnote |
| † Electronic supplementary information (ESI) available: The unit cell parameters and atomic coordinates for the most stable crystal structures of MTO and MTO3N. See DOI: 10.1039/c5ta06426k |
|
| This journal is © The Royal Society of Chemistry 2016 |
Click here to see how this site uses Cookies. View our privacy policy here.  Open Access Article
 ab and
William A.
Goddard III
*a


![[double bond, length as m-dash]](https://www.rsc.org/images/entities/char_e001.gif) O group, 2.00 Å for N in the –NO2 group, 2.00 Å for O, and 1.15 Å for H. The ΔG0g(H+) = 2.5RT − TΔS0 and ΔG0solv(H+) were obtained to be −6.28 kcal mol−1 and −270.3 kcal mol−1 according to the literature.24–26,31 Since some of the molecules have two or more equivalent sites for protonation or deprotonation (see below), an extra stabilization in free energy due to the configurational entropy (−RT
O group, 2.00 Å for N in the –NO2 group, 2.00 Å for O, and 1.15 Å for H. The ΔG0g(H+) = 2.5RT − TΔS0 and ΔG0solv(H+) were obtained to be −6.28 kcal mol−1 and −270.3 kcal mol−1 according to the literature.24–26,31 Since some of the molecules have two or more equivalent sites for protonation or deprotonation (see below), an extra stabilization in free energy due to the configurational entropy (−RT![[thin space (1/6-em)]](https://www.rsc.org/images/entities/char_2009.gif) ln
ln![[thin space (1/6-em)]](https://www.rsc.org/images/entities/char_2009.gif) nd) was added for such cases, where nd is the n-fold degeneracy number, R is the gas constant and T is the temperature (298.15 K). Reaction (1) in Table 2 shows the deprotonation reaction for one of the melamine's tautomers. The tautomer is made by the protonation of the nitrogen atom on the triazine ring. Because there are three equivalent sites for this nitrogen, the degeneracy is considered to be 3-fold degeneracy (nd = 3). The computed pKa value for reaction (1) is in good agreement with the experimental one32,33 which shows the accuracy of the computational method. Reaction (2) shows the deprotonation from one of the –NH2 groups of the MTO molecule (nd = 3). The pKa of 18.5 shows the high stability of the –NH2 group toward dissociation in water. In reaction (3), the protonated –NH2 group (–NH3+) in the MTO molecule (nd = 3) is very unstable (pKa = −4.8) and quickly dissociates to produce the –NH2 group. The –N
nd) was added for such cases, where nd is the n-fold degeneracy number, R is the gas constant and T is the temperature (298.15 K). Reaction (1) in Table 2 shows the deprotonation reaction for one of the melamine's tautomers. The tautomer is made by the protonation of the nitrogen atom on the triazine ring. Because there are three equivalent sites for this nitrogen, the degeneracy is considered to be 3-fold degeneracy (nd = 3). The computed pKa value for reaction (1) is in good agreement with the experimental one32,33 which shows the accuracy of the computational method. Reaction (2) shows the deprotonation from one of the –NH2 groups of the MTO molecule (nd = 3). The pKa of 18.5 shows the high stability of the –NH2 group toward dissociation in water. In reaction (3), the protonated –NH2 group (–NH3+) in the MTO molecule (nd = 3) is very unstable (pKa = −4.8) and quickly dissociates to produce the –NH2 group. The –N![[double bond, length as m-dash]](https://www.rsc.org/images/entities/char_e001.gif) O group is also very stable in water as shown in reaction (4), because the deprotonation of the –N
O group is also very stable in water as shown in reaction (4), because the deprotonation of the –N![[double bond, length as m-dash]](https://www.rsc.org/images/entities/char_e001.gif) OH+ tautomer (nd = 3) is the favorable reaction (pKa = −5.8). Similarly in reaction (5), the –NO2 group is very stable and deprotonation of –NO2H+ (nd = 1) occurs quickly. Reactions (6) and (7) show the stability of the –N
OH+ tautomer (nd = 3) is the favorable reaction (pKa = −5.8). Similarly in reaction (5), the –NO2 group is very stable and deprotonation of –NO2H+ (nd = 1) occurs quickly. Reactions (6) and (7) show the stability of the –N![[double bond, length as m-dash]](https://www.rsc.org/images/entities/char_e001.gif) O group toward protonation in the presence of both –NH2 and –NO2 groups at 1- and 2-fold degeneracies (nd = 1, 2).
O group toward protonation in the presence of both –NH2 and –NO2 groups at 1- and 2-fold degeneracies (nd = 1, 2).
![[1 with combining macron]](https://www.rsc.org/images/entities/char_0031_0304.gif) (13.7%), P212121 (11.6%), P21 (6.7%) and C2/c (6.6%).34,35 Therefore, we considered the packing of MTO and MTO3N into the crystals of just these five space groups using the Dreiding non-reactive FF15,16 with charges from QM based on the Mulliken populations. We used Ewald summation for long-range non-bond interactions.36 Geometry optimizations used conjugate gradient (CG) algorithm.
(13.7%), P212121 (11.6%), P21 (6.7%) and C2/c (6.6%).34,35 Therefore, we considered the packing of MTO and MTO3N into the crystals of just these five space groups using the Dreiding non-reactive FF15,16 with charges from QM based on the Mulliken populations. We used Ewald summation for long-range non-bond interactions.36 Geometry optimizations used conjugate gradient (CG) algorithm.


![[thin space (1/6-em)]](https://www.rsc.org/images/entities/char_2009.gif) 000.0 K
000.0 K

![[1 with combining macron]](https://www.rsc.org/images/entities/char_0031_0304.gif)

![[1 with combining macron]](https://www.rsc.org/images/entities/char_0031_0304.gif)


