The intriguing poison tolerance of non-precious metal oxygen reduction reaction (ORR) catalysts†
Received
30th September 2015
, Accepted 16th November 2015
First published on 17th November 2015
Abstract
Electrochemical devices such as fuel cells are key to a sustainable energy future. However the applicability of such under realistic conditions is not viable to date. Expensive precious metals are used as electrocatalysts and contaminants present in the operating media poison the utilized catalysts. Here the one pot synthesis of a highly active, self-supporting and surprisingly poison tolerant catalyst is reported. The polymerisation of 1,5-diaminonaphthalene provides self-assembled nanospheres, which upon pyrolysis form a catalytically active high surface area material. Tolerance to a wide range of substances that poison precious metal based catalysts combined with high electrocatalytic activity might enable numerous additional technological applications. In addition to fuel cells these could be metal–air batteries, oxygen-depolarized chlor-alkali cathodes, oxygen sensors, medical implantable devices, waste water treatment and as counter electrodes for many other sensors where the operating medium is a complex and challenging mixture.
Introduction
The oxygen reduction reaction (ORR) is both crucial and important not only for life on Earth, but also increasingly for energy conversion and storage devices utilizing the clean energy cycle between water on the one side and hydrogen and oxygen on the other.1 The growth in adoption and application of this sustainable energy cycle as an alternative to fossil fuel based technologies is almost entirely dependent on the development of the oxygen reduction reaction. Due to its complex four electron pathway and the susceptibility of current catalysts to common air poisons and to corrosion in acid environments, designing catalysts for the ORR is challenging. To date the industry standard electrocatalyst for this task is platinum, either alone or alloyed with other elements. In a state-of-the-art H2/air polymer electrolyte fuel cell (PEFC) with platinum catalysts, the cathode ORR is at least six orders of magnitude slower than the anode hydrogen oxidation reaction (HOR).2 This causes the cathode to require approximately 20 times the catalyst loading of the anode. Furthermore even with this high loading of precious metal the performance and thus usability of the cell drops if exposed to parts per million of common air poisons e.g. sulphur dioxide, hydrogen sulphide, nitrous oxides, aromatic hydrocarbons to name only a few.3–5 Therefore, the poison tolerance of catalysts is a crucial design metric which is often ignored and to the best of our knowledge there are no reports of catalysts that are demonstrated to operate under such highly demanding conditions. At present, the most promising alternative ORR electrocatalysts, with respect to price, availability, performance and durability are non-precious metal nitrogen carbon composites.6–8 Generally, these catalysts are prepared through a complex route of pyrolysing a mixture of conductive carbon support with metal salts and a nitrogen source.7 The carbon support acts as a high surface area template and improves the electrical conductivity of the resultant catalyst. Recently, non-precious electrocatalysts with a very high surface area have been reported that performed better than Pt in perchloric acid,9 although with a complex structure and impractical for large scale production. Numerous other ways of preparing such catalysts exist. The approach shown here demonstrates that generating versatile, simple, scalable and highly active carbon based ORR catalysts is possible solely by choosing a nitrogen-containing carbon precursor with suitable morphology. Although the produced catalysts may not match the activities of the very best carbon/nitrogen containing catalysts in the literature, the removal of the carbon support makes the catalyst much less complex and simplifies the synthesis whilst retaining the desirable high activity and conductivity. Moreover, it is shown that this catalyst is highly poison tolerant i.e. highly selective towards the reduction of oxygen, which is of fundamental importance in practical applications, where platinum based catalysts are adversely affected. This applies not only in an electrolyte solution but also at the device level.
Experimental
Synthesis of catalyst
The catalyst ODAN was synthesized by dispersing 500 mg (3.16 mmol) of 1,5-diaminonaphthalene (97% from Alfa Aesar) and 500 mg (2.19 mmol) of (NH4)2S2O8 (98% from Sigma-Aldrich) in 50 mL of ethanol (absolute from VWR). The dispersion is stirred for 24 h at room temperature. The resulting mixture is heated to 80 °C in order to evaporate the solvent. When dry, the resulting residue is transferred to an alumina boat (11 cm long by 2 cm wide by 1 cm deep, approximately 10 mL of volume capacity) and heat treated at 1000 °C for 2 h in a tube (quartz) furnace (Carbolite) at a heating rate of 20 °C min−1. This heat treatment was performed in an inert atmosphere, under a continuous flow of nitrogen (50 ccm). After cooling down under this nitrogen atmosphere, the resulting material was removed from the quartz boat and ready for use.
Electrochemical analysis of catalyst
For the electrochemical experiments using the Rotating Ring Disk Electrode (Pine Instruments, model AFE6R1AU having a mirror polished glassy carbon as disk and rotator model AFMSRCE), the catalyst was deposited on the glassy carbon disk following a procedure described in the literature.10 The reference platinum catalyst was 60 wt% Pt on high surface area carbon from Johnson Matthey (HiSpec 9100, Alfa Aesar). A three compartment electrochemical glass cell was used for the aqueous electrochemical tests, being the electrolytes prepared by diluting the concentrated reagent to the necessary degree, or 0.5 M H2SO4 (H2SO4 97% Aristar from VWR), 0.5 M HCl (HCl 37% from VWR), 0.1 M NaOH (NaOH 97% from Sigma-Aldrich), Ringers solution (Sigma Aldrich). The RHE reference electrode (GaskatelHydroFlex) was ionically connected to the main compartment of the electrochemical glass cell via a Luggin–Haber-capillary. A glassy carbon rod was used as counter electrode and ionically connected to the main compartment of the glass cell through a porous frit. Glassy carbon was used instead of Pt in order to avoid contamination with catalytically active precious metals. A potentiostat (Autolab, model PGSTAT20) was used for potential or current control during the electrochemical measurements. Steady state oxygen reduction reaction polarization curves, performed in O2-saturated electrolyte solutions were obtained via step potentials of 30 mV with waiting time of 30 seconds. Ultrapure gases utilized in this study were, nitrogen and oxygen (BIP plus-X47S, Air products). For fuel cell tests, compressed air, oxygen (as above) and hydrogen BOC grade N6.0 was utilized.
Poisoning experiments (in electrolyte solution)
The experiments where the catalysts are exposed to poisons were carried out by quantitatively adding the desired substance to the electrolyte to reach the mentioned concentration levels. For the experiments where chloride anions are involved, a quantitative volume of HCl (HCl 37% from Sigma-Aldrich) was added to the main compartment of the electrochemical glass cell, which is the same condition for when methanol (ACS grade from VWR) was employed. In the experiments where urea was involved the respective amount of a 2.5 M urea solution in 0.5 M H2SO4 was added.
Single PEFC tests
For tests in a single Polymer Electrolyte Fuel Cell (PEFC), the Membrane Electrode Assembly (MEA) was prepared as per a procedure described in the literature.11 The reference catalyst was a Johnson Matthey Reformate Cathode Electrode with a loading of 0.4 mgPt cm−2 electrode (from Alfa Aesar), which was also utilized as anode electrode on every MEA. The polymeric electrolyte was a Nafion™ 212 membrane (from Ion Power). The catalysts synthesized here were quantitatively deposited on a 5 cm2 gas diffusion layer (Toray Carbon Paper, Baselayered, TGP-H-60 from Alfa Aesar) as per literature procedure.11 All single PEFC tests refer to a 5 cm2 in electrode area. Polarization curves were performed utilizing an electronic load (Kikusui KFM2150). Gases were humidified via a humidification system from Fuel Cell Technologies, Inc.
Poisoning experiments (single PEFC)
For the contamination experiments, the contaminated gas stream was obtained by mixing pure air with a N2 or air stream containing the desired substance (e.g. H2S, benzene or toluene). The gas streams containing contaminants were injected without humidification to the main gas stream (pure air), which were already humidified. For the experiment where hydrogen sulphide was employed, 50 ccm of 1000 ppm H2S in balance of nitrogen (from Air Products) was mixed with 550 ccm of air, reaching a final flow rate of 600 ccm, containing 83 ppm of H2S. When benzene and toluene was utilized, an air stream (50 ccm) was flowed through a solution of either benzene (AnalaRNormapur from VWR) or toluene (toluene 99.8% from Sigma-Aldrich) prior to mixing with 550 ccm of air. The concentration of toluene and benzene in the 50 ccm air stream was verified by the use of a Benchtop UV-Vis Spectrometer (Perkin-Elmer Lambda 25). For this experiment 50 ccm of air was flowed through either a benzene or toluene pure solution and fed into a quartz flow cell in the spectrometer, by recording the absorbance of the characteristic peaks for benzene and toluene the respective concentrations in the gas stream could be determined.
Results and discussion
Catalyst precursors were synthesized in a simple one pot process at room-temperature by dispersion of an appropriate diamine in ethanol with addition of ammonium persulfate to promote the formation of oligomers. This was monitored by UV-Vis spectroscopy and Mass Spectrometry (see ESI Fig. S1† and Appendix). After 24 h the temperature was raised to 80 °C, thereby removing the solvent and completing the polymerization. A particularly important precursor was the polymer produced from 1,5-diaminonaphthalene, which appropriately formed self-assembled nanospheres, verified by scanning electron microscopy (Fig. 1b). The catalyst precursors were then subjected to heat treatment in a tube furnace at 1000 °C in an inert atmosphere for 2 h in order to obtain the final catalysts, with ODAN denoting a catalyst where no additional transition metal salt was added. The pyrolysis step promotes a number of chemical transformations towards achieving high electrically conductive and high surface area carbon materials, doped with heteroatoms, e.g. nitrogen and sulphur, which possess a desirable morphology (Fig. 1c) and a high electrocatalytic activity for the technologically important reduction of oxygen (Fig. 4). The electrical conductivity of ODAN was determined as per modified literature method to be as high as ∼100 S m−1 under a compression of ∼2 MPa, a value that is comparable to that measured for highly conductive carbon blacks (see ESI†).12 Furthermore, a range of different diamines were assessed as monomers (see ESI†), with oligo-1,5-diaminonaphthalene possessing the most suitable morphology13 to obtain the desired high surface area, electrically conductive material upon heat treatment. The other polymerized diamines showed coarse structures with larger agglomerates (ESI Fig. S2 and S3†) and formed low surface area materials upon pyrolysis. In this study, catalysts synthesized with addition of FeCl2 and CoCl2 to the ethanolic monomer solution and in the absence of an additional oxidant were also assessed. It was found that these metal cation species facilitate the oxidative polymerization (see ESI Fig. S1† for UV-Vis spectra and Appendix for Mass Spectra). Presumably, this occurs via the autoxidation to the metal +3 species by oxygen in this solution, a phenomenon already described for ferrous ions in water.14 Co and Fe containing catalysts were synthesized with a high metal content of 2.2/0.9 molar ratio monomer/metal ion or ∼14 wt% monomer of Fe denoted as Fe-ODAN-14% and ∼16 wt% Co respectively denoted as Co-ODAN-16%. Another catalyst was synthesized with 1 wt% of Fe denoted as Fe-ODAN-1%. The surface area of the catalysts were determined by nitrogen adsorption analysis (Table 1). The catalyst without any addition of metal salt (ODAN) has a BET surface area as high as 614 m2 g−1, the catalyst Fe-ODAN-14% 391 m2 g−1, the catalyst Fe-ODAN-1% 493 m2 g−1 and the catalyst Co-ODAN-16% 64 m2 g−1 (see ESI Fig. S4† for N2 adsorption isotherms). This suggests that metal ions promote carbon materials with lower surface areas.
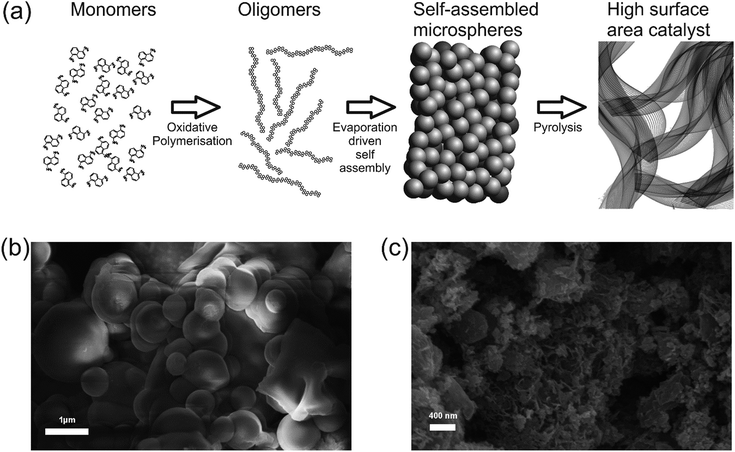 |
| | Fig. 1 (a) Schematic, depicting the synthesis procedure of the catalyst (b) Scanning Electron Microscopy image of polymerized 1,5-diaminonaphthalene as precursor for the ODAN catalyst (c) Scanning Electron Microscopy image of ODAN catalyst material after heat treatment at 1000 °C for 2 h. | |
The analysis of the external versus microporous surface area is shown in Table 1. While for the catalyst ODAN and Fe-ODAN-1%, the contributions of microporous surface area is larger than that of external surface area, it is reversed for the catalysts Fe-ODAN-14% and Co-ODAN-16%. It seems that the addition of metal salts leads to the formation of a less microporous carbon framework. Further structural information on the carbon phase was obtained by X-ray powder diffraction (XRD) and Raman spectroscopy (Fig. 2). XRD shows reflection peaks characteristic for graphitic structures on the diffraction patterns of Co-ODAN, Fe-ODAN and ODAN (Fig. 2c). Judging from the Bragg reflection of the (002) peak for the diffraction position, the intensity and the width of the peak, the crystallinity of the catalysts are in the order Fe-ODAN-1% < ODAN < Fe-ODAN-14% < Co-ODAN-16%. This is confirmed by the calculated average interlayer distance (d002) using Bragg's law for Fe-ODAN-1%, ODAN, Fe-ODAN-14% and Co-ODAN-16% being 0.355 nm, 0.353 nm, 0.346 nm and 0.341 nm respectively, with graphite being 0.335 nm.15,16 This result along with analysis of the crystallite size indicate that single crystallites were composed of approximately 6, 7, 15 and 19 π-stacked nanographene sheets for ODAN, Fe-ODAN-1%, Fe-ODAN-14% and Co-ODAN-16% respectively. This suggests that metals clearly promote increased stacking of the carbon catalysts. The trend in graphitization observed in XRD was also verified by Raman spectroscopy (Fig. 2a). The width of the Raman G and D bands increases in the order Co-ODAN-16% < Fe-ODAN-14% < ODAN < Fe-ODAN-1% (Fig. 2a), suggesting increased defects and/or tortuosity of the graphene layers.17,18 A plot of the average continuous graphene length including tortuosity (Leq) vs. the inverse full width at half maximum of the 2D band (ΔW2D−1) (Fig. 2b) gives further insight. The plot shows that the average in-plane graphene lengths (La) for ODAN, Fe-ODAN-1%, Fe-ODAN-14% and Co-ODAN-16% are estimated as 0.8 nm, 1.1 nm, 1.9 nm and 2.7 nm respectively. This suggests that the presence of iron and cobalt in the preparation of the catalysts promotes the formation of lengthier graphene sheets. In contrast, the catalyst prepared without addition of metals (ODAN) presents a highly disordered carbon nanostructure, which is indicated by the second-order Raman peaks for ODAN (Fig. 2a) that merge to form a modulated bump from ∼2400 to ∼3100 cm−1, in contrast, the high degree of graphitization for Fe-ODAN-14% and Co-ODAN-16% can be deducted from the sharp peaks at these wavenumbers.17,18 As the catalytic activity of the less graphitized and higher disordered catalysts Fe-ODAN-1% and ODAN is significantly higher than for Fe-ODAN-14% and Co-ODAN-16%, both in acid and alkaline electrolyte (Fig. 4a and b) a disordered structure with a lower degree of graphitization could be linked to catalytic activity, however the BET surface area also decreases in the same order, suggesting an alternative correlation. In order to gain further insight into the nanostructure of the catalyst, high resolution transmission electron microscopy (HRTEM) was performed (Fig. 3c and d). This generally confirms BET, XRD and Raman results, with further and important information. Clearly, there are turbostratic-like regions and others with an interesting fabric-like nanostructure,17 where metal apparently promotes the latter and the catalyst without metal promotes the former (see ESI Fig. S5†). In order to gain further understanding of the elemental surface composition, X-ray photoelectron spectroscopy on the best acid-performing catalyst Fe-ODAN-1% was performed. The wide scan revealed all detected elements at the surface to be C (∼86.2%), N (∼4.0%), O (∼7.6%), S (∼2.1%) and a minute amount of Fe (∼0.2%) (ESI Fig. S6†). The nitrogen species are 25% pyridinic, 11% pyrrolic, 45% quaternary, 14% NO2−, 5% NO (Fig. 3a). Examination of the sulphur 2p peak (Fig. 3b) reveals two main contributions of sulphur present in the sample that can be assigned to aromatic sulphur or thiophene and sulfones or sulphates respectively.19 It is likely that all the sulphur introduced by the persulphate species used for oxidative polymerization is either decomposed or completely incorporated into the carbon framework as aromatic sulphur and the sulphate present on the surface is due to leaching with sulphuric acid. This is deduced because of the lack of a sulphate peak in a not acid-leached sample (ESI Fig. S7 and S8†). Neutron Activation Analysis (NAA) is a very sensitive technique, being especially useful for trace element analysis (ESI†). It has been argued in the literature that iron, cobalt and less importantly chromium take part in the catalytic activity of non-precious catalysts.20 The NAA result of ODAN after being subjected to reflux in 0.5 M H2SO4 for 8 h shows a concentration of 7 ppm, 10 ppm and 732 ppm by weight of Co, Fe and Mn respectively. Therefore, the present investigation notably shows that neither iron nor cobalt are necessarily required to produce highly active carbon based catalysts for both acid and especially alkaline media (Fig. 4). However a trace amount of Mn that was detected could be the cause of the higher activity compared to other metal free catalysts reported in the literature.20 The catalytic activity and 4 electron selectivity of the catalysts towards the ORR was assessed along with a reference catalyst using the Rotating Ring Disc Electrode (RRDE) method, with cross-comparison at 1600 rpm (Fig. 4a and b). To ensure that no ORR active precious metal contamination was introduced into the electrochemical cell, a RRDE with a glassy carbon disc and gold ring together with a glassy carbon counter electrode was chosen. Among the various catalysts synthesized, the metal-free synthesized ODAN showed a remarkably high ORR activity in alkaline media, which even surpasses the activity of the state of the art Pt catalyst used in this study (Fig. 4b). It shows a ∼40 mV reduction in overpotential (∼70 mV at half-wave potential) vs. Pt/C, determined by extrapolating the tangent at the half wave potential towards zero current. Additionally the catalysts ODAN and Fe-ODAN-1% with only 1 wt% Fe also performs well in 0.5 M H2SO4, conditions that resemble the acidic environment in an operating fuel cell. Fe-ODAN-1% performs slightly better than ODAN and shows an only ∼50 mV increase in ORR overpotential (∼100 mV at half-wave potential) vs. Pt/C (Fig. 4a). The oxygen reduction pathway to the desirable water (4e−) versus the detrimental hydrogen peroxide (2e−) was assessed directly through the peroxide yield detected in situ and indirectly via the number of electrons transferred in the reaction, with a Koutecky–Levich analysis. For the catalysts Fe-ODAN-1% and ODAN peroxide yield is below 4% measured in 0.5 M H2SO4 and below 8% in 0.1 M NaOH, which is comparable to the Pt catalyst and shows that the reduction favours the formation of water. The 4 electron selectivity of the catalyst ODAN is further confirmed by Koutecky–Levich analysis, showing an electron transfer number of ∼4 in 0.5 M H2SO4 (ESI Fig. S11†) and ∼3.6 in 0.1 M NaOH (ESI Fig. S12†). This is in agreement with the observed peroxide yield at the gold ring, showing a preference for the complete 4 electron pathway. This low peroxide yield even on the almost metal free catalyst confirms that H2O2 decomposition induced by transition metal centres might not play a crucial role for the 4 electron route in this specific catalyst, as shown in literature for similar catalysts.22,23 The catalysts with a higher metal content Fe-ODAN-14% and Co-ODAN-16% showed a significantly higher peroxide yield, especially in alkaline medium. Striking is the high peroxide yield of the Co containing catalyst of 20–30% in the potential region between 0.6 V and 0.2 V vs. RHE. This selectivity might be exploited to create efficient hydrogen peroxide forming catalysts. The Tafel plot of the kinetic current density shows the typical 2 slopes for Pt/C of ∼60 mV dec−1 and ∼120 mV dec−1, both in 0.1 M NaOH and 0.5 M H2SO4 (Fig. 4c).10 To get a better understanding of the kinetics of the catalysts ODAN in 0.5 M H2SO4 and 0.1 M NaOH, and Fe-ODAN-1% in 0.5 M H2SO4 are shown on the same plot as the Pt/C catalyst (Fig. 4c) with Tafel slopes of ∼94 mV dec−1, ∼75 mV dec−1 and ∼89 mV dec−1 respectively. To enable comparison to other non-precious metal catalysts Table 2 shows the mass activities and volumetric current densities of the best catalysts at 0.8 V vs. RHE in acidic and 0.9 V vs. RHE in alkaline electrolyte calculated from the RDE data at room temperature. The data was not corrected for mass transport effects. These results fall well within the range of other active Fe–N/C catalysts reported in literature on an RDE in the same electrolyte.24 To perform RDE durability testing, an ORR steady state polarization plot was recorded and the catalyst was cycled in N2 saturated electrolyte between 0.6 V and 1.0 V. Subsequently steady state polarization plots were taken again. A plot of the geometric ORR current densities obtained after these cycles at 0.81 V (Fig. 4d) shows that the main degradation takes place during the first 100 cycles, approaching a low level of degradation thereafter. This is important for technological applications. It is well known in literature that a higher catalyst loading can change the apparent peroxide yield detected on the ring.25 If a 2 + 2 mechanism is present, the thicker catalyst layer will allow the further reduction of peroxide before it can diffuse out of the layer, thereby reducing the observed yield and making it difficult to assess the true electron transfer number.23,25,26 Therefore there might be different types of active sites, as suggested in literature.27,28 Firstly the desirable active sites that promote the true 4 electron pathway. Secondly active sites which predominantly promote a 2 electron pathway with or without the capability to further reduce peroxide and lastly a type of active site that predominantly reduces peroxide. All active sites might be present within the catalyst at the same time.28 If a high enough number of the 2 electron active sites is present, a lower loading of catalyst will show a higher measured peroxide yield at the ring.25,28 Therefore we tested the best performing acid catalyst Fe-ODAN-1% at different loadings (Fig. 5). It can be clearly seen that for this catalyst the peroxide yield seems to be independent on loading. This indicates a high proportion of 4 electron active sites. Another important aspect to applicability under challenging conditions, such as in fuel cells, sensors or as cathode catalyst for the oxygen depolarized chlor-alkali electrolysis is that the catalyst has to be tolerant to a wide range of substances. While Pt and also other metals show high activities, they are not selective towards the desired reaction and catalyse other unwanted side-reactions. They are therefore susceptible to poisons such as methanol, hydrocarbons, chlorine/chloride and hydrogen sulphide.29–31 This limits the use of Pt and other catalysts for green technologies under demanding conditions, where the ORR could otherwise be applied. Surprisingly, the catalyst we developed is tolerant to all of these substances. To assess the poison tolerance, RDE measurements were taken in pure electrolyte and in the presence of contaminants at different concentrations. As a measure of loss in activity, we look at the decrease in current density for oxygen reduction at the half-wave potential (determined in the poison free environment) upon introduction of the contaminant (see inset in Fig. 6a). While the activity of the Pt catalyst is always reduced significantly, our catalyst is not or only slightly affected in its activity (Fig. 6a–c). Chloride was introduced into the electrochemical cell, because of the abundance of that element in the environment and as representative species for ions that will strongly adsorb to precious metal surfaces and decrease their activity. While the influence on the activity on our ODAN catalyst is minute, the activity of the Pt/C catalyst is significantly reduced, as can be seen by the dramatic drop in performance at the half wave potential (Fig. 6a). Urea was added, because of its relative abundance. It is a common waste product of all mammals.32 Moreover it is taken as representative for nitrogen rich molecules. A large impact on the Pt activity is observed. Even at a very low concentration of only 10−4 M the performance at the half wave potential is halved and at 10−3 M shut down completely, while the effect on our catalyst is minimal (Fig. 6b). Although Vielstich et al. showed the methanol tolerance of this type of catalysts already, it is also included in this study in order to show the generality of the poison resistance, which is the main focus of this publication.33 MeOH was added to 0.1 M NaOH, because for Pt catalysts, the competing methanol oxidation lowers the activity. As known, this is a drawback of Pt catalysts for the use in direct methanol fuel cells, where methanol crossover to the cathode can occur, thus lowering the overall fuel efficiency dramatically.32 It is also detrimental where the oxygen reduction reaction is carried out in the presence of oxidisable organic molecules, such as in waste water treatment or as counter electrode for other electrochemical devices. Additionally to methanol, other alcohols are also oxidized at potentials that interfere with the ORR, which is another potential problem for traditional catalysts.34 No effect of MeOH on the catalyst was observed, while the methanol oxidation completely shuts down oxygen reduction on the Pt catalyst (Fig. 6c). To further show the broad applicability of our catalyst an RDE measurement was also taken in 0.5 M HCl (Fig. 6d), a highly corrosive environment, and it can be seen that the activity of the ODAN catalyst is far superior to the commercial catalyst. Another possible application of this catalyst is in medical implantable fuel cells that run on glucose on the anode side and on oxygen on the cathode side. Such devices have already been described.35 Again the susceptibility of Pt to all kinds of poisons is a limiting factor here. To demonstrate the feasibility of the catalyst under physiological conditions, Ringers solution was chosen as an electrolyte to probe the ORR activity against Pt (Fig. 6e). While ODAN still shows good ORR activity, the activity of Pt is completely shut down. It has to be noted that the thick catalyst layer and therefore higher total surface area compared to Pt/C can introduce some benefits for the non-precious metal catalyst due to the filtering capability of carbon and the respective longer time of contaminants to diffuse through the carbon structure to the non-precious active site. A measurement of the transient of the contamination has been conducted to estimate if the polarisation time was long enough in order to allow the contaminants to reach the active site. The contamination of the Pt based catalyst takes place in less than 1 second (ESI S16†). The carbon surface areas and loading of the catalysts on the RDE tip are compared and give 250 m2 g−1 and 40 μg cm−2 carbon loading for Pt/C versus 614 m2 g−1 and 750 μg cm−2 for the NPMC, respectively. Therefore the total carbon surface area is ∼46 times higher for the non-precious metal catalyst. This means, in the worst case, the contaminants would take 46 times longer or 46 seconds to reach the active sites. The measurements are performed under steady state and a 30-second hold with 30 mV step potential. By the time the measurement reaches the respective half-wave potential (where comparisons are made in Fig. 6), several minutes have passed and access of the contaminant to the active site has been achieved. To further study the activity under real fuel cell operating conditions, a polymer electrolyte membrane (PEM) single cell was prepared and tested. The catalyst was paint brushed onto a Toray carbon paper containing a microporous layer, which was used as cathode and a commercial Pt electrode as anode. The loading of ODAN at the cathode was 4 mg cm−2. It was compared to a state of the art commercial Pt cathode with a loading of 0.4 mgPt cm−2. The anode in both cases was a commercial Pt anode with a loading of 0.4 mgPt cm−2. The high anode Pt loading makes sure that the anode reaction is not the limiting factor. While the performance of the cell with ODAN is lower than the Pt cell, the performance might be significantly improved by understanding mass transport and water management issues in the significantly thicker catalyst layer compared to the commercial electrode (Fig. 7a). We are currently examining variations to our synthesis conditions to improve the microporous structure of the catalyst and hence improve mass transport. Nonetheless, the catalyst already reaches activities that are similar to other high performing non-precious metal catalysts.8,36 The impact of poisons
on the operating fuel cell was studied. Different contaminants were fed into the gas stream and the potential was monitored. When as little as 83 ppm of H2S was fed into the cathode gas stream, the cell utilising Pt cathode catalyst had an almost instantaneous drop in potential, while the ODAN cell (Fig. 7b) was completely unaffected. It can be suspected that this behaviour could be extrapolated to longer chain organic sulphides as well. The same phenomenon was observed with 77 ppm toluene (Fig. 7c) and 163 ppm benzene (Fig. 7d), which can be taken as representatives for volatile organic compounds. The ratio in total carbon surface area within the fuel cell test is ∼60 times higher for the ODAN cell compared to the Pt cell. Indeed in the operating fuel cell, the effect of contamination takes place slower. The whole operation time of the ODAN cell after contamination shall therefore be normalised to the higher surface area ODAN catalyst versus Pt. For instance after contamination the measurement was continued for 2100 seconds in the ODAN cell contaminated with toluene. Therefore 2100 seconds were normalised to the 60 times higher surface area to match 35 seconds in the Pt cell. The potential drop at 35 seconds in the Pt cell is therefore compared to the potential drop in the ODAN cell after 2100 s (post contamination) and likewise in the other experiments. The values are 40 mV versus 14 mV for toluene, 33 mV versus 17 mV for benzene and 40 mV versus 5 mV for H2S for Pt versus ODAN respectively. Even if the contamination time scales linearly with total surface area, ODAN is still less affected than the Pt catalyst. However more complex processes are likely to be determining the contamination and ultimately failure time of the cell. This shows that the resistance to poisons shown in RDE studies can be transferred to device level.
Table 1 Contribution of external and microporous surface area (SA) to the total SA of the respective catalysts, as determined by nitrogen adsorption analysis.
| Catalyst |
External SA [m2 g−1] |
Microporous SA [m2 g−1] |
Total SA [m2 g−1] |
| ODAN |
126 |
488 |
614 |
| Fe-ODAN-1% |
116 |
362 |
478 |
| Fe-ODAN-14% |
203 |
188 |
391 |
| Co-ODAN-16% |
38.5 |
26.5 |
65.0 |
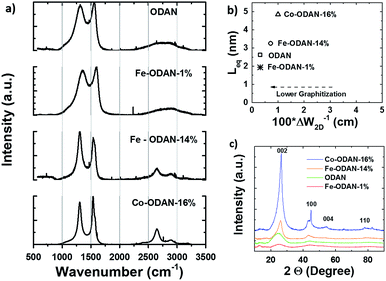 |
| | Fig. 2 (a) Raman spectra of ODAN, Fe-ODAN-1%, Fe-ODAN-14% and Co-ODAN-16%. (b) Plot of the average continuous graphene layer length (Leq) of selected catalysts as a function of the crystalline quality at curvature [(ΔW2D−1)] for a comparative analysis of the degree of graphitization. (c) XRD spectra of ODAN, Fe-ODAN-14%, Fe-ODAN-1% and Co-ODAN-16%. The shape of the peak at ∼26° shows that the degree of graphitization is reduced from Co-ODAN-16% over Fe-ODAN-14% to ODAN, which is also seen for the peak at ∼44°. | |
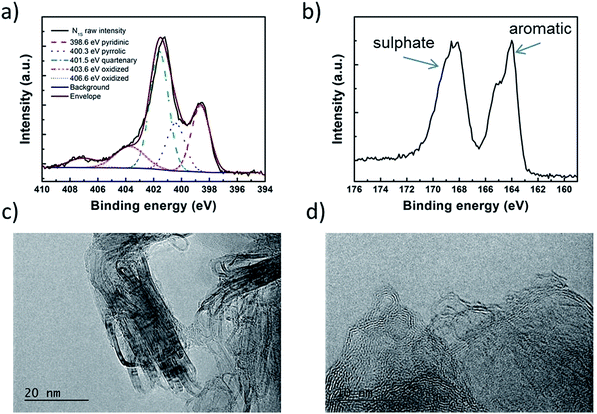 |
| | Fig. 3 (a) High resolution N1s XPS spectrum with the peaks deconvoluted into pyridinic, pyrrolic, quarternary and oxidised nitrogen species. (b) High resolution S2p XPS spectrum showing peaks that can be assigned to aromatic sulphur and sulphate species respectively. (c) and (d) TEM images of ODAN catalyst. | |
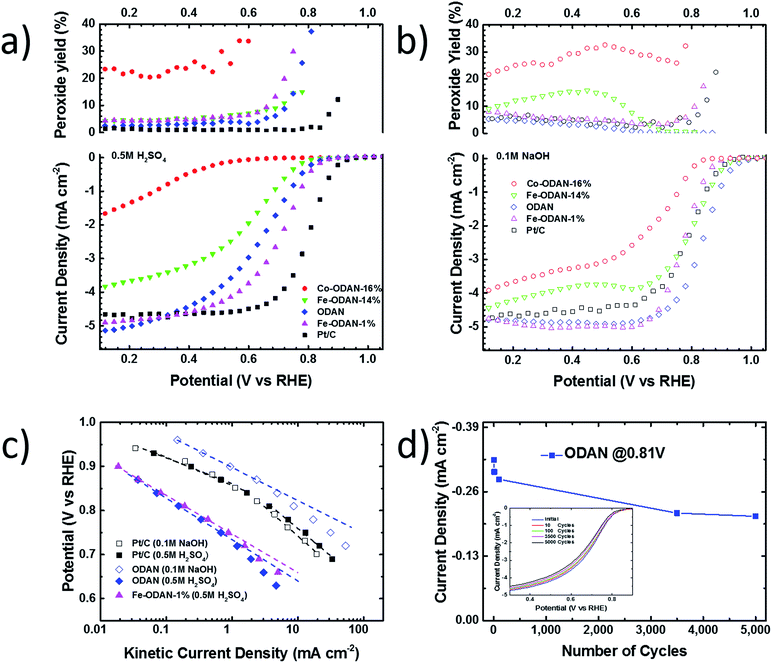 |
| | Fig. 4 (a) Steady-state RRDE measurement in 0.5 M H2SO4, rotating speed: 1600 rpm, 30 s hold, 30 mV step potential, catalyst loading: non-precious metal catalysts: 750 μg cm−2, Pt/C: 60 μgPt cm−2, O2-saturated at 1 atm (bottom) ORR activity (top) peroxide yield (b) in 0.1 M NaOH (c) Tafel plot of selected catalysts in 0.5 M H2SO4 and 0.1 M NaOH (d) long term stability test: current density in O2-saturated 0.5 M H2SO4 at different potentials after cycling between 0.6 and 1 V versus RHE in N2-saturated 0.5 M H2SO4. | |
Table 2 Mass activities and volumetric current densities for the best performing catalysts. Values taken at the respective potential versus RHE in the RDE setup at room temperature and are not mass transport corrected.
| Catalyst |
Electrolyte |
Potential [V vs. RHE] |
Mass activity [A g−1] |
Volumetric currenta [A cm−3] |
|
Assuming a catalyst layer density of 0.4 g cm−3.21
|
| ODAN |
0.5 M H2SO4 |
0.8 |
0.40 |
0.16 |
| Fe-ODAN-1% |
0.5 M H2SO4 |
0.8 |
0.67 |
0.27 |
| Fe-ODAN-14% |
0.5 M H2SO4 |
0.8 |
0.13 |
0.052 |
| ODAN |
0.1 M NaOH |
0.9 |
1.1 |
0.44 |
| Fe-ODAN-1% |
0.1 M NaOH |
0.9 |
0.065 |
0.026 |
| Fe-ODAN-14% |
0.1 M NaOH |
0.9 |
0.67 |
0.27 |
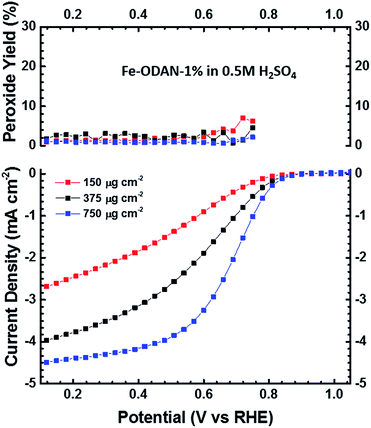 |
| | Fig. 5 Steady-state RRDE measurement in 0.5 M H2SO4 at different catalyst loadings, rotating speed: 1600 rpm, 30 s hold, 30 mV step potential, O2-saturated at 1 atm. | |
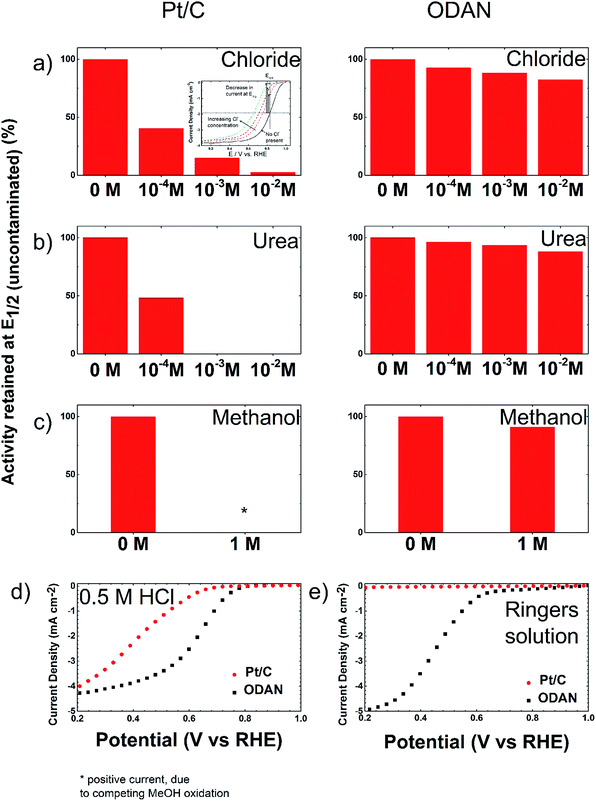 |
| | Fig. 6 Bar plot showing the performance at the respective half wave potential of the RDE measurement, comparing a Pt/C catalyst to ODAN at a rotating speed of 1600 rpm, 30 s hold, 30 mV step potential, catalyst loading: ODAN: 750 μg cm−2, Pt/C: 30 μgPt cm−2, O2-saturated at 1 atm before and after adding (a) Cl− to 0.5 M H2SO4, (b) urea to 0.5 M H2SO4 and (c) methanol to 0.1 M NaOH to obtain the respective concentrations. The complete measurements are shown in the ESI Fig. S13–S15.† (d) 0.5 M HCl and (e) Ringers solution. | |
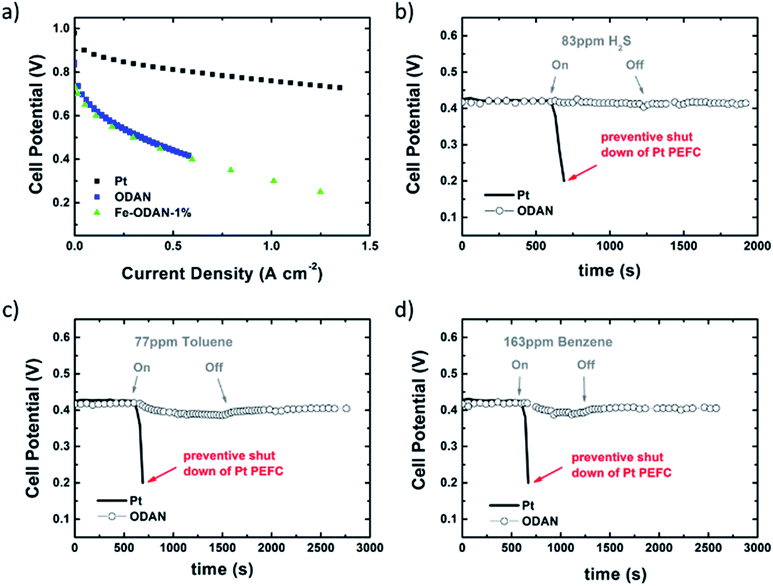 |
| | Fig. 7 (a) H2–O2 polarization plot for MEA comparing cathodes, brush painted with ODAN and Fe-ODAN-1% (4 mg cm−2) to a commercial Pt cathode (0.4 mgPt cm−2). (b) Cell voltage before and after adding (b) 83 ppm H2S (c) 77 ppm toluene and (d) 163 ppm benzene into the cathode gas stream. | |
Conclusions
This methodology to synthesize the catalysts without any support or template provides a straight forward route to active oxygen reduction reaction catalysts. This allows reduction of complexity of the system and possible identification of key features of the active site which are not accessible in other systems. Even a low amount of iron seems to have a negative effect on the catalytic activity in alkaline, while slightly enhancing it under acidic conditions. The catalyst is exceptionally poison-tolerant. While the reference Pt catalyst is always severely affected by a wide variety of substances, our catalyst is mostly resistant, or at worst showing only a minor reduction in performance. The generality of this poison tolerance is curious, and points to a significantly different active site compared to transition metal catalysts or even metalloenzymes. The catalyst operates well in the presence of chloride, urea, methanol, Ringers solution, HCl, H2S, benzene and toluene, these substances exemplify strongly adsorbing ions, amides/amines, alcohols, biological fluids, corrosive electrolytes, sulphur containing compounds and hydrocarbons respectively. The technological applications could be wide ranging and include fuel cells, that have to operate on gas streams in challenging conditions, oxygen sensing in different kinds of biological fluids, counter electrode catalysts, where the ORR is preferred over hydrogen evolution, such as in chlor-alkaline oxygen depolarized electrolysis, metal–air batteries and waste water treatment.
Acknowledgements
Financial support for this study by the Engineering and Physical Sciences Research Council through EP/G030995/1—Supergen Fuel Cell Consortium is greatly appreciated. We thank the artist Ari Bianchi for drawing the cartoon in the graphical abstract. We also thank Dr Mark Beary, manager of the Analytical Chemistry Group, Research Reactor Center, University of Missouri and Dr Nasser Mirzai-Baghini from Imperial College Reactor Center for Neutron Activation Analysis services. A file containing the data used to produce the figures in this paper and in the supplementary materials is available at http://dx.doi.org/10.5281/zenodo.33959.
References
- N. M. Markovic, Nat. Mater., 2013, 12, 101–102 CrossRef CAS PubMed.
- M. K. Debe, Nature, 2012, 486, 43–51 CrossRef CAS PubMed.
- R. Borup, J. Meyers, B. Pivovar, Y. S. Kim, R. Mukundan, N. Garland, D. Myers, M. Wilson, F. Garzon, D. Wood, P. Zelenay, K. More, K. Stroh, T. Zawodzinski, J. Boncella, J. E. McGrath, M. Inaba, K. Miyatake, M. Hori, K. Ota, Z. Ogumi, S. Miyata, A. Nishikata, Z. Siroma, Y. Uchimoto, K. Yasuda, K.-i. Kimijima and N. Iwashita, Chem. Rev., 2007, 107, 3904–3951 CrossRef CAS PubMed.
- F. H. Garzon, T. Lopes, T. Rockward, J. M. Sansinena, B. Kienitz, R. Mukundan and T. Springer, ECS Trans., 2009, 25, 1575–1583 CAS.
- B. K. Kakati and A. R. J. Kucernak, J. Power Sources, 2014, 252, 317–326 CrossRef CAS.
- R. Bashyam and P. Zelenay, Nature, 2006, 443, 63–66 CrossRef CAS PubMed.
- F. Jaouen, E. Proietti, M. Lefèvre, R. Chenitz, J.-P. Dodelet, G. Wu, H. T. Chung, C. M. Johnston and P. Zelenay, Energy Environ. Sci., 2010, 4, 114–130 Search PubMed.
- E. Proietti, F. Jaouen, M. Lefèvre, N. Larouche, J. Tian, J. Herranz and J.-P. Dodelet, Nat. Commun., 2011, 2, 416 CrossRef PubMed.
- J. Y. Cheon, T. Kim, Y. Choi, H. Y. Jeong, M. G. Kim, Y. J. Sa, J. Kim, Z. Lee, T.-H. Yang, K. Kwon, O. Terasaki, G.-G. Park, R. R. Adzic and S. H. Joo, Sci. Rep., 2013, 3, 2715 Search PubMed.
- U. A. Paulus, T. J. Schmidt, H. A. Gasteiger and R. J. Behm, J. Electroanal. Chem., 2001, 495, 134–145 CrossRef CAS.
- V. A. Paganin, E. A. Ticianelli and E. R. Gonzalez, J. Appl. Electrochem., 1996, 26, 297–304 CrossRef CAS.
- B. Marinho, M. Ghislandi, E. Tkalya, C. E. Koning and G. de With, Powder Technol., 2012, 221, 351–358 CrossRef CAS.
- S. Komathi, S. Palaniappan, P. Manisankar, A. I. Gopalan and K.-P. Lee, J. Nanosci. Nanotechnol., 2010, 10, 5302–5306 CrossRef CAS PubMed.
- A. Alıcılar, G. Meriç, F. Akkurt and O. Şendil, J. Int. Environ. Appl. Sci., 2008, 3, 409–414 Search PubMed.
- M. A. Short and P. L. Walker Jr, Carbon, 1963, 1, 3–9 CrossRef CAS.
- B. E. Warren, Phys. Rev., 1941, 59, 693–698 CrossRef CAS.
- N. Larouche and B. L. Stansfield, Carbon, 2010, 48, 620–629 CrossRef CAS.
- A. C. Ferrari and J. Robertson, Phys. Rev. B: Condens. Matter Mater. Phys., 2000, 61, 14095–14107 CrossRef CAS.
- S. R. Kelemen, G. N. George and M. L. Gorbaty, Fuel, 1990, 69, 939–944 CrossRef CAS.
-
J.-P. Dodelet, in Electrocatalysis in Fuel Cells, ed. M. Shao, Springer, London, 2013, pp. 271–338 Search PubMed.
- H. A. Gasteiger, S. S. Kocha, B. Sompalli and F. T. Wagner, Appl. Catal., B, 2005, 56, 9–35 CrossRef CAS.
- F. Jaouen, J. Phys. Chem. C, 2009, 113, 15433–15443 CAS.
- F. Jaouen and J.-P. Dodelet, J. Phys. Chem. C, 2009, 113, 15422–15432 CAS.
- F. Jaouen, J. Herranz, M. Lefèvre, J.-P. Dodelet, U. I. Kramm, I. Herrmann, P. Bogdanoff, J. Maruyama, T. Nagaoka, A. Garsuch, J. R. Dahn, T. Olson, S. Pylypenko, P. Atanassov and E. A. Ustinov, ACS Appl. Mater. Interfaces, 2009, 1, 1623–1639 CAS.
- E. J. Biddinger, D. v. Deak, D. Singh, H. Marsh, B. Tan, D. S. Knapke and U. S. Ozkan, J. Electrochem. Soc., 2011, 158, B402–B409 CrossRef CAS.
- A. Bonakdarpour, M. Lefevre, R. Yang, F. Jaouen, T. Dahn, J.-P. Dodelet and J. R. Dahn, Electrochem. Solid-State Lett., 2008, 11, B105–B108 CrossRef CAS.
- U. Tylus, Q. Jia, K. Strickland, N. Ramaswamy, A. Serov, P. Atanassov and S. Mukerjee, J. Phys. Chem. C, 2014, 118, 8999–9008 CAS.
- A. Muthukrishnan, Y. Nabae, T. Okajima and T. Ohsaka, ACS Catal., 2015, 5, 5194–5202 CrossRef CAS.
- T. Lopes, V. A. Paganin and E. R. Gonzalez, J. Power Sources, 2011, 196, 6256–6263 CrossRef CAS.
-
X. Cheng, Z. Shi, N. Glass, L. Zhang, J. Zhang, D. Song, Z.-S. Liu, H. Wang and J. Shen, IBA-HBC 2006 Selected papers from the International Battery Association & Hawaii Battery Conference 2006 Waikoloa, Hawaii, USA, 9–12 January 2006, 2007, vol. 165, pp. 739–756 Search PubMed.
- T. J. Schmidt, U. A. Paulus, H. A. Gasteiger and R. J. Behm, J. Electroanal. Chem., 2001, 508, 41–47 CrossRef CAS.
- G. W. Brown and P. P. Cohen, J. Biol. Chem., 1959, 234, 1769–1774 CAS.
- R. Holze, I. Vogel and W. Vielstich, J. Electroanal. Chem. Interfacial Electrochem., 1986, 210, 277–286 CrossRef CAS.
- M. E. P. Markiewicz and S. H. Bergens, J. Power Sources, 2008, 185, 222–225 CrossRef CAS.
- B. I. Rapoport, J. T. Kedzierski and R. Sarpeshkar, PLoS One, 2012, 7, e38436 CAS.
-
F. Jaouen, in Non-Noble Metal Fuel Cell Catalysts, ed. Z. Chen, J.-P. Dodelet and J. Z. Dodelet, Wiley-VCH Verlag GmbH & Co. KGaA, 2014, pp. 29–118 Search PubMed.
Footnotes |
| † Electronic supplementary information (ESI) available: Detailed catalyst synthesis, further physical characterisation, further electrochemical characterisation. See DOI: 10.1039/c5ta05794a |
| ‡ Present Address: University of Sao Paulo, 13566-590, Sao-Carlos-SP, Brazil. |
| § Present Address: University of Patras, 265 04, Greece. |
|
| This journal is © The Royal Society of Chemistry 2016 |
Click here to see how this site uses Cookies. View our privacy policy here.  Open Access Article


