 Open Access Article
Creative Commons Attribution 3.0 Unported Licence
Formation of complex self-assembled aggregates in non-ionic chromonics: dimer and trimer columns, layer structures and spontaneous chirality†
Martin
Walker
 * and
Mark R.
Wilson
 *
*
Durham University, Department of Chemistry, Lower Mountjoy, South Road, Durham DH1 3LE, UK. E-mail: mark.wilson@durham.ac.uk; Tel: +44 (0) 191 384 1158
First published on 12th September 2016
Abstract
Dissipative particle dynamics (DPD) simulations are used to model the aqueous self-assembly of three variants of the non-ionic triphenylene-based chromonic mesogen, TP6EO2M. In the variants studied, one to three of the six methoxy poly(ethylene glycol) chains of TP6EO2M are replaced by short hydrophobic–lipophobic chains, causing a remarkable change in the structure of the mesophases formed. In the 100 wt% limit, corresponding to pure thermotropic phases, complex columnar phases arise, in which the underlying hexagonal packing is supplemented by additional order resulting from microphase separation of hydrophobic–lipophobic regions. With addition of water an array of novel chromonic phases are seen. In these phases supramolecular aggregates form in which hydrophobic–lipophobic chains are excluded from water by the joining together of single molecule chromonic stacks into dimers or trimers. These aggregates form chromonic N and M phases and, in the case of a “Janus mesogen” (with three hydrophobic–lipophobic chains on one side of the molecule), form a novel smectic chromonic phase. Spontaneous symmetry breaking is seen in columns composed of trimer stacks with defects. Here achiral molecular aggregates develop a spontaneous twist, inducing the formation of either left-handed or right-handed chiral aggregates. On the long time-scales accessible to DPD simulations, chiral aggregates are seen to be dynamic structures in which chirality inversion can take place over long periods of time.
Introduction
Chromonic liquid crystals are a fascinating field of soft matter chemistry.1–3 Chromonic molecules are unconventional amphiphiles, often containing a rigid aromatic core, functionalised with one or more groups that aid solubility in aqueous solution. Once dispersed in a solvent, chromonic molecules aggregate to form stacks, in which the aromatic cores are shielded from the solvent. Theory and simulation have shown that for many chromonic systems, aggregation occurs in an approximately isodesmic manner, that is, the distribution of aggregates can be modelled with a single binding energy.4,5 As the concentration of the chromonic molecule is increased, the stack sizes typically grow, until the average aggregate length to breadth ratio is sufficiently large to cause an entropically driven phase transition to a nematic (N) phase composed of chromonic aggregates. For some systems, additional mesophases have been reported, including the hexagonally ordered M phase1 and a layered phase.6 Complex chromonic phases with aggregates formed from columns with a multi-molecule cross section have been reported also.7–9A resurgent interest in chromonic systems arises from a range of application areas, including their use as real-time microbial sensors,10,11 uses in the controlled fabrication of thin films12 and controllable side-by-side or end-to-end assembly of gold nanorods.13
While most known chromonic systems contain ionic solubilizing groups, an interesting second class of systems also exist stemming from non-ionic molecules. In these systems, water solubility can be conveyed by the presence of (for example) hydroxyl groups or ethylene glycol chains.14 Here, chromonic phase behaviour is extremely dependent on the hydrophilic/hydrophobic balance within the molecule. Small changes towards the hydrophilic side can destroy aggregation, whereas shifts in the opposite direction can lead to phase separation and insolubility. Recent molecular simulations suggest that chromonic aggregation in non-ionic systems is driven by both enthalpic and entropic contributions to the free energy of association (which are of similar magnitude).15
In non-ionic systems, the relatively large solubilising groups required to provide the right “hydrophobic/hydrophilic” balance, can in principle be used to tune the shape of chromonic aggregates by taking advantage of additional noncovalent interactions or making use of microphase separation. In this paper we show how these ideas can be used to:
• self-assemble novel chromonic aggregates by the joining together of single molecule chromonic stacks into dimers or trimers;
• form chiral chromonic aggregates from achiral molecules;
• form novel smectic chromonic mesophases.
We use the dissipative particle dynamics (DPD) method to directly simulate chromonic self-assembly over long time scales in a number of triphenylene-based non-ionic chromonics. We demonstrate how through careful substitution aggregate shape (and also chirality) can be controlled. On the long time scales accessible through DPD, we show also that fluctuations in local order can propagate, giving rise to spontaneous chirality inversion.
Computational
DPD has been applied previously to successfully simulate a number of soft matter systems. Examples include block co-polymers,16–18 colloidal suspensions,19 lipid bilayers,20,21 nanoparticles22,23 and liquid crystalline phases.24–28 In recent work, chromonic mesophases have been represented by a DPD model.29 Molecular systems are readily coarse-grained to a DPD representation by replacing chemical groups within a molecule with coarse-grained DPD (spherical) interaction sites. Different sites interact through a simple soft repulsive force of magnitude, Fc acting along the intermolecular vector. Here, | (1) |
 | (2) |
Fd = −γω2![[r with combining circumflex]](https://www.rsc.org/images/entities/b_char_0072_0302.gif) ij( ij(![[r with combining circumflex]](https://www.rsc.org/images/entities/b_char_0072_0302.gif) ij·vij). ij·vij). | (3) |
| Ftot = Fc + Fr + Fd | (4) |
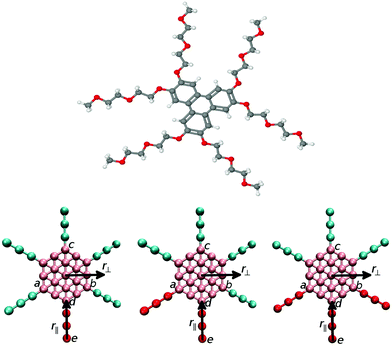
The current study uses a similar methodology as the one adopted in our recent work on the non-ionic chromonic molecule TP6EO2M.29 In TP6EO2M, Fig. 1, the central aromatic triphenylene core is represented within DPD by a group of coarse-grained beads linked together into a semi-rigid disk by harmonic spring bonds, together with six flexible chains. Each short poly(ethylene glygol) chain can be represented by three hydrophilic beads. In the current study we replace either one (model 1), two (model 2) or three (model 3) of these arms by a less hydrophilic moiety, as shown in Fig. 1.
The molecular core is composed of 19 aromatic type beads arranged hexagonally in 2 dimensions. Harmonic springs bind the beads at an ideal distance of 0.0, but with repulsive DPD potentials adding to the repulsive component of the bonding potential. Harmonic angle potentials link any three linear adjacent beads with an ideal angle of 180 degrees. The force constants for these two interactions are both set to 20 in standard DPD reduced units (setting m = ε = σ0 = 1 for reduced units of mass, energy and length). The chains are represented by DPD beads bonded with harmonic potentials. The nonbonded interaction strengths for each pair of bead types, aij, are set to mimic the properties of TP6EO2M and derivatives in water:29aij = 25 for i = j and aij = 45 for i ≠ j with the exception of ethylene oxide bead/water interactions where aij = 25.
For all chromonic systems studied, simulations used 1000 chromonic molecules in water. The correct concentration was achieved by adding an appropriate number of water beads to the simulation box. Here each water bead can be thought of as representing four water molecules in the usual DPD way. In reporting results below, concentrations are given in weight percent (wt%), assuming a uniform mass of DPD beads. Simulations were initialized from randomly placed molecules and water beads in a box that corresponded to a density of 3 beads per unit volume. The velocity-Verlet algorithm was applied to solve the equations of motion. In each case, simulations were started from a reduced temperature T* = kBT = 1. We found that 1![[thin space (1/6-em)]](https://www.rsc.org/images/entities/char_2009.gif) 000
000![[thin space (1/6-em)]](https://www.rsc.org/images/entities/char_2009.gif) 000 steps with a time step of 0.02 reduced time units was sufficient to ensure a well equilibrated phase in all cases.
000 steps with a time step of 0.02 reduced time units was sufficient to ensure a well equilibrated phase in all cases.
Simulations were performed on molecules with arm lengths n = 3 over the range of concentrations 25 wt%, 50 wt%, 75 wt% and 100 wt%, and results are presented for models 1–3 (as described above). To help align nematic phases, a pseudo magnetic field was applied to orient the discs along a single direction. The field was applied to three corners of the disc (defined by atoms a, b, c in Fig. 1) and acted to align the normal vector to these three beads to a defined axis. Here, the interaction potential for the field is given by
| |Emag| = 0.5kfield(ϕ − ϕ0) | (5) |
 | (6) |
Two axes were used to analyse molecular order in the systems studied. Two “in-plane” molecular vectors, r‖ and r⊥ were defined as vectors projected onto the plane containing the points a, b and c. r⊥ vector is defined as ![[r with combining circumflex]](https://www.rsc.org/images/entities/b_char_0072_0302.gif) ⊥ = (
⊥ = (![[r with combining circumflex]](https://www.rsc.org/images/entities/b_char_0072_0302.gif) ab ×
ab × ![[r with combining circumflex]](https://www.rsc.org/images/entities/b_char_0072_0302.gif) bc) ×
bc) × ![[r with combining circumflex]](https://www.rsc.org/images/entities/b_char_0072_0302.gif) de and r‖ is defined as
de and r‖ is defined as ![[r with combining circumflex]](https://www.rsc.org/images/entities/b_char_0072_0302.gif) ‖ = (
‖ = (![[r with combining circumflex]](https://www.rsc.org/images/entities/b_char_0072_0302.gif) ab ×
ab × ![[r with combining circumflex]](https://www.rsc.org/images/entities/b_char_0072_0302.gif) bc) ×
bc) × ![[r with combining circumflex]](https://www.rsc.org/images/entities/b_char_0072_0302.gif) ⊥. Where a, b, c, d and e are shown in Fig. 1. Two, 2-dimensional pair distribution functions were calculated for distances r⊥ and r‖ measured from, the centre of the molecular core (g(r‖,r⊥)); and from the end bead of a modified arm (bead e), h(r‖,r⊥).
⊥. Where a, b, c, d and e are shown in Fig. 1. Two, 2-dimensional pair distribution functions were calculated for distances r⊥ and r‖ measured from, the centre of the molecular core (g(r‖,r⊥)); and from the end bead of a modified arm (bead e), h(r‖,r⊥).
Results and discussion
Model 1
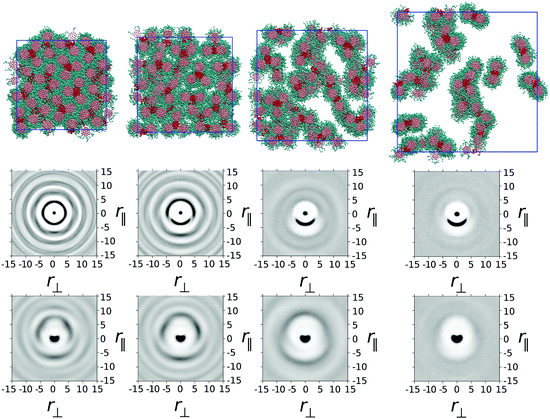
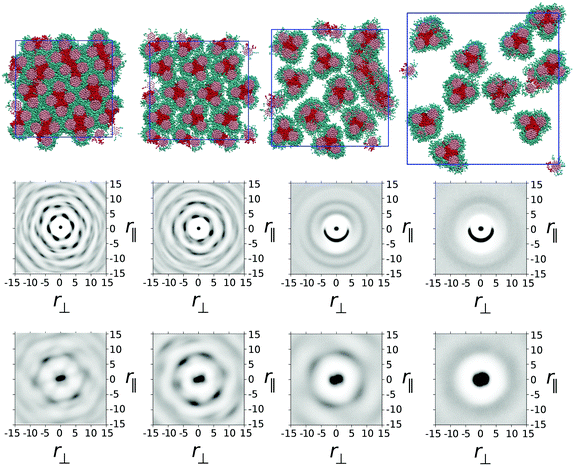
In model 1, one ethylene oxide arm from TP6EO2M was replaced with an alternative, equal length arm with parameters aij = 25 for i = j and aij = 45 for i ≠ j. These parameters mimic the introduction of a fluorinated or siloxane arm, which is both lipophobic and hydrophobic, i.e. does not mix well with either the polyaromatic molecular core or water.In Fig. 2 snapshots are shown from simulations of one thousand mesogens at T* = 1 carried out at four different concentrations: 100 wt%, 75 wt%, 50 wt% and 25 wt%. In the 100 wt% (i.e. purely thermotropic) solvent-less system, the molecules would be expected to form a hexagonal columnar mesophase, as seen in the earlier DPD model of TP6EO2M.29 However, the presence of the modified arm causes an interesting demixing effect in the plane orthogonal to the columnar director. Hydrophobic–lipophobic arms from three adjacent columns undergo microphase separation to minimise contact between these arms and ethylene oxide chains.
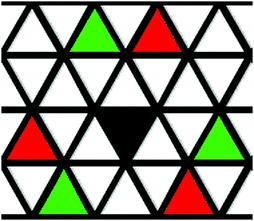
In Fig. 2 the snapshot shows the tiling of hydrophobic–lipophobic regions viewed in cross-section through a plane perpendicular to the director. This is seen to be partially disordered, as confirmed by g(r‖,r⊥) plotted for arm–arm correlations. Here, the distribution of hydrophobic–lipophobic regions (“tiles”) is influenced by two energetically equivalent locations for adjacent tiles, as shown schematically in Fig. 3. As a result, spontaneous nucleation of individual hydrophobic–lipophobic domains during equilibration leads to an eventual partially disordered arrangement for these regions within the mesophase.
On addition of water to give a 75 wt% solution, the columnar phase swells to form a chromonic M phase in which the microphase separated hydrophilic–lipophilic regions are maintained. The addition of water leads to an average increase in spacing between columns, as seen in a plot of g(r‖,r⊥) for the molecular cores. However, the increase in spacing occurs between trimers of columns, in contrast to TP6EO2M, where uniform swelling of the columnar phase occurs.
With further addition of water (giving a 50 wt% solution) the expected nematic N phase is seen. In TP6EO2M the N phase is formed from chromonic aggregates of varying length, with each column having a cross-section corresponding to a single molecule.5,29,31 However, in model 1 the presence of a modified arm leads to strong aggregation between stacks, resulting in aggregates that are “dimers” or “trimers” of columns, where the columns are linked together by hydrophobic–lipophobic domains. In some cases individual chromonic aggregates switch from being trimers to dimers, or vice versa, in traversing the length of a column.
Nematic ordering of columns is retained at 25 wt% of mesogens. However, it appears that this concentration corresponds to a two phase region of the phase diagram in which there are column-rich and water-rich regions of the simulation box. At 25 wt% there is a predominance of dimer columns over trimer columns.
The intense peak in g(r‖,r⊥) centred at r‖ = 3.54 corresponds to a superposition of dimers (centred at r⊥ = 0), and trimers (centred at r⊥= ±1.77 = ±cos(π/6)r, where r is the inter-core spacing). However, given the liquid nature of the system these two distributions cannot be visually deconvoluted. To quantify the relative populations of the dimer and trimer columns, g(r⊥) was calculated over the range 3.0 < r < 5.0, r‖ < 0 and −3.5< r⊥ < 3.5. Fitting this function to a sum of three Gaussians centered at the ideal locations for dimer and trimer columns, allows for the relative population of both column types to be obtained. To do this we plot
 | (7) |
![[thin space (1/6-em)]](https://www.rsc.org/images/entities/char_2009.gif) :
:![[thin space (1/6-em)]](https://www.rsc.org/images/entities/char_2009.gif) trimer ratio is 3
trimer ratio is 3![[thin space (1/6-em)]](https://www.rsc.org/images/entities/char_2009.gif) :
:![[thin space (1/6-em)]](https://www.rsc.org/images/entities/char_2009.gif) 2, whereas at 50 wt% the ratio is 1
2, whereas at 50 wt% the ratio is 1![[thin space (1/6-em)]](https://www.rsc.org/images/entities/char_2009.gif) :
:![[thin space (1/6-em)]](https://www.rsc.org/images/entities/char_2009.gif) 78, i.e. almost exclusively trimers. Hence, the dimer trimer ratio can be tuned by varying concentration.
78, i.e. almost exclusively trimers. Hence, the dimer trimer ratio can be tuned by varying concentration.
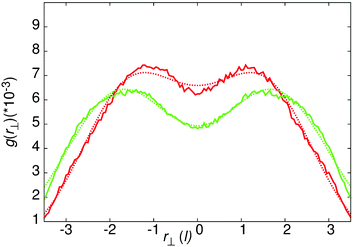 | ||
| Fig. 4 g(r⊥) for the intense local peak centred at r‖ = 3.54 for core–core distances of separation. Green line – 50 wt% results, red line – 25 wt% results. The gaussian fits use the form of eqn (7), with the parameters a1 = 3.96373 × 10⁻⁴, c1 = 1.0, a2 = 4.92693 × 10⁻⁴, c2 = 2.5 (25 wt%) and a1 = 6.26241 × 10⁻⁴, c1 = 1.5, a2 = 3.16987 × 10⁻⁵, c2 = 0.749 (50 wt%). | ||
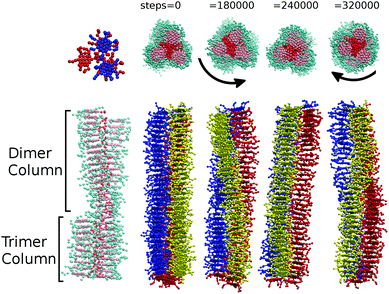
Additionally, at 25 and 50 wt% concentrations, sections of single columns can break away from a trimer configuration. The resulting aggregate is left partially composed of lengths of trimer and lengths of dimer. Where dimer and trimer sections of the column join, a defect is formed, which imparts a twist on the column that can propagate through the entire aggregate (see Fig. 5). Hence we obtain chiral columns, which have either a left-handed or right-handed twist. Careful observation of individual columns shows that over a period of time, the column is able to spontaneously rearrange through unwinding to produce a column with the opposite handedness. This remarkable dynamic chirality inversion occurs spontaneously during the course of a DPD run of ∼1![[thin space (1/6-em)]](https://www.rsc.org/images/entities/char_2009.gif) 000
000![[thin space (1/6-em)]](https://www.rsc.org/images/entities/char_2009.gif) 000 steps.
000 steps.
We note that a number of previous computational studies have suggested spontaneous symmetry breaking can give rise to chiral soft matter systems. Chakrabarti and Wales32 demonstrate that a columnar phase that is tilted and helical can be formed from achiral disc-like ellipsoidal particles. Here the local minima of the potential energy surface support irregular helical arrangements of particles. Yan et al.33 show that rigid achiral bent-core molecules composed of linked spheres can give rise to micelles and columns composed of chiral clusters. Here, the driving force for twist is again provided by the potential energy surface. In the chiral columns seen in the current study, the driving force for chirality is more subtle, arising from a desire to shield the hydrophobic–lipophobic parts of a column from water (enthalpically and entropically driven) in a system which is dynamically fluctuating; and is therefore neither perfectly packed nor at a minimum in the potential energy.
At lower concentration ∼10% we see the formation of an isotropic phase of aggregates, again formed predominantly from dimers. We note that in conventional isotropic solutions of chromonics, a wide range of aggregation numbers corresponding to different stack lengths is expected.34 Here we see two different and competing self-assembly mechanisms leading to columnar stacks of different length and column assemblies of either dimers or trimers.
Model 2
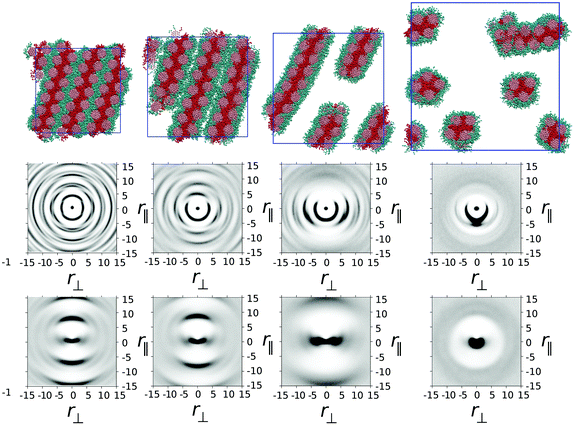
In the thermotropic melt (100 wt%) model 2 forms a hexagonal arrangement of rigid core units, similar to that seen in model 1. However, for model 2, the hydrophobic–lipophobic arms demix into regions surrounded by four columns of disks (Fig. 6). The resulting phase exhibits hexagonal symmetry with respect to core–core correlations, and a double spaced hexagonal symmetry with respect to arm–arm correlations. This is seen very clearly in the g(r‖,r⊥) and h(r‖,r⊥) plots in Fig. 6, where high intensity spots pick out the hexagonal symmetry in both the core and arm ordering.On addition of water (75 wt% mesogens), the hexagonal columnar phase breaks up into a chromonic M phase, where chromonic aggregates are composed of groups of three columns, in which each column contributes two modified arms to a central hydrophobic–lipophobic region. Here the water is completely taken up into the region occupied by ethylene oxide chains. The presence of a small number of dimer defects within the columns of model 1, means that hexagonal ordering is weaker in model 1 (Fig. 2) than is seen in Fig. 6 for model 2. Further addition of water leads to a nematic N phase at 50 wt% and a 2-phase region of N-phase/water at 25 wt%.
g(r‖,r⊥) and h(r‖,r⊥) plots demonstrate the hexagonal symmetry at 100 wt% and 75 wt%, but this is lost in the N phase at 50 wt%. At the two lower concentrations (25 and 50 wt%), a similar g(r⊥,r‖) to that seen for model 1 is observable. However, the initial intense peak at around r = 3.74 covers a full 180 degrees, reflecting the wide full range of orientations possible for r‖ within a trimer. These in turn correspond to trimers, which can locally have cross-sections ranging from perfect 3-fold symmetry to distorted triangles.
Unlike model 1, dimer segments are not clearly identifiable within columns of trimers. However, transient helical columns are still observable at 50 wt% and 25 wt% (as shown in Fig. 5). The presence of chirality in the aggregates is attributed to individual trimers of three molecules distorting from perfect 3-fold symmetry. This low energy distortion is enough to induce a local twist, which propagates to produce chiral columns. As with model 1, both left-handed and right-handed columns are possible. As with model 1, dynamic chirality inversion takes place over time. In Fig. 5 we plot a time sequence showing chirality inversion over a 320![[thin space (1/6-em)]](https://www.rsc.org/images/entities/char_2009.gif) 000 time step sequence.‡
000 time step sequence.‡
Model 3
Model 3 represents a “Janus mesogen” where there are two distinct sides to the molecule: a hydrophilic–lipophobic part and a hydrophobic–lipophobic part, which would each like to occupy similar volumes. In A–B block co-polymer systems, 50![[thin space (1/6-em)]](https://www.rsc.org/images/entities/char_2009.gif) :
:![[thin space (1/6-em)]](https://www.rsc.org/images/entities/char_2009.gif) 50 amounts of distinct A and B blocks, leads to strong lamellar ordering.17,18,35 For our Janus mesogens we similarly are able to generate lamellar ordered structures via microphase separation. In the thermotropic phase this occurs as shown in Fig. 7 with the columnar ordering of TP6EO2M lost completely by allowing layers of mesogens to form. Hydrophobic–lipophobic groups act as the filling between adjacent layers of aromatic cores, with the hydrophilic chains acting as the spacer between separate layers.
50 amounts of distinct A and B blocks, leads to strong lamellar ordering.17,18,35 For our Janus mesogens we similarly are able to generate lamellar ordered structures via microphase separation. In the thermotropic phase this occurs as shown in Fig. 7 with the columnar ordering of TP6EO2M lost completely by allowing layers of mesogens to form. Hydrophobic–lipophobic groups act as the filling between adjacent layers of aromatic cores, with the hydrophilic chains acting as the spacer between separate layers.
g(r‖,r⊥) and h(r‖,r⊥) plots confirm the long range order of the phase with the cores partitioned into strongly ordered columns, and the chain ends exhibiting confinement in layers but with the absence of sharp peaks in h(r‖,r⊥) showing that chain ends are in a fluid environment. This provides a fascinating structure in which columns can be arranged in patterns within chemically distinct layers within a self-ordered (i.e. self-healing) mesophase. Such structures clearly have potential applications in molecular electronics, depending on the electronic properties of the microphase segregated regions.
Addition of 25 wt% water leads to formation of a chromonic smectic mesophase. Here the individual layers of the bulk thermotropic remain but become separated by water. Smectic chromonics are comparatively rare, though layered structures have been reported by Tiddy and co-workers in a number of cyanine dye systems.36 At 50 wt% a two-phase smectic–isotropic phase system is seen, which breaks up to give a range of aggregates within the isotopic phase at lower concentrations.
Conclusions
DPD models have been presented for 3 variants of the chromonic molecule, TP6EO2M with one, two or three hydrophobic–lipophobic arm(s). The one and two-arm models show thermotropic columnar phases for the pure mesogenic system, together with chromonic M and N phases in water. The columnar phases contain microphase segregated hydrophobic–lipophobic domains, which run parallel with the columnar columns. Complex aggregates are found in the chromonic phases, corresponding to dimer and trimer stacks for the one-arm system, and predominantly trimer stacks for the two arm system. Both systems show chiral chromonic aggregates that form despite the fact that individual molecules are strictly achiral.The three-arm “Janus mesogen” forms a layered structure in the bulk thermotropic mesophase, with hydrophobic–lipophobic arms acting as the filling between adjacent layers of aromatic cores, with the hydrophilic chains acting as the spacer between separate layers. This structure breaks up in water to give a novel smectic chromonic mesophase in which layers are made up from linked columns of mesogens.
The work seen here, points to the power of DPD as a simulation technique in scanning phase diagrams, and exploring how changes in molecular structure can lead to dramatic changes in phase behaviour.
Finally, it is worth noting that that the large system sizes and the long time scales accessible via DPD, point to the usefulness of this methodology in the future design and engineering of new generations of functional soft matter systems.
Acknowledgements
The authors would like to acknowledge the support of the Engineering and Physical Sciences Research Council (EPSRC) in the UK through grant EP/J004413/1. The authors are grateful to their experimental and theoretical collaborators on this grant for valuable discussions: Prof. G. Tiddy, Prof. A Masters, Dr P. Carbone (University of Manchester), Prof. G. Mehl (University of Hull).Notes and references
- J. Lydon, J. Mater. Chem., 2010, 20, 10071–10099 RSC.
- J. Lydon, Curr. Opin. Colloid Interface Sci., 2004, 8, 480–490 CrossRef CAS.
- J. Lydon, Curr. Opin. Colloid Interface Sci., 1998, 3, 458–466 CrossRef CAS.
- F. Chami and M. R. Wilson, J. Am. Chem. Soc., 2010, 132, 7794–7802 CrossRef CAS PubMed.
- R. G. Edwards, J. R. Henderson and R. L. Pinning, Mol. Phys., 1995, 86, 567–598 CrossRef CAS.
- T. L. Crowley, C. Bottrill, D. Mateer, W. J. Harrison and G. J. T. Tiddy, Colloids Surf., A, 1997, 129–130, 95–115 CrossRef.
- G. J. T. Tiddy, D. L. Mateer, A. P. Ormerod, W. J. Harrison and D. J. Edwards, Langmuir, 1995, 11, 390–393 CrossRef CAS.
- W. J. Harrison, D. L. Mateer and G. J. T. Tiddy, J. Phys. Chem., 1996, 100, 2310–2321 CrossRef CAS.
- M. R. Tomasik and P. J. Collings, J. Phys. Chem. B, 2008, 112, 9883–9889 CrossRef CAS PubMed.
- S. V. Shiyanovskii, O. D. Lavrentovich, T. Schneider, T. Ishikawa, I. I. Smalyukh, C. J. Woolverton, G. D. Niehaus and K. J. Doane, Mol. Cryst. Liq. Cryst., 2005, 434, 587–598 CAS.
- S. V. Shiyanovskii, T. Schneider, I. I. Smalyukh, T. Ishikawa, G. D. Niehaus, K. J. Doane, C. J. Woolverton and O. D. Lavrentovich, Phys. Rev. E: Stat., Nonlinear, Soft Matter Phys., 2005, 71, 20702 CrossRef CAS PubMed.
- K. V. Kaznatcheev, P. Dudin, O. D. Lavrentovich and A. P. Hitchcock, Phys. Rev. E: Stat., Nonlinear, Soft Matter Phys., 2007, 76, 61703 CrossRef CAS PubMed.
- H. S. Park, A. Agarwal, N. A. Kotov and O. D. Lavrentovich, Langmuir, 2008, 24, 13833–13837 CrossRef CAS PubMed.
- N. Boden, R. J. Bushby, M. V. Jesudason and B. Sheldrick, J. Chem. Soc., Chem. Commun., 1988, 1342–1343 RSC.
- A. Akinshina, M. Walker, M. R. Wilson, G. J. T. Tiddy, A. J. Masters and P. Carbone, Soft Matter, 2015, 11, 680–691 RSC.
- V. Ortiz, S. O. Nielsen, M. L. Klein and D. E. Discher, J. Polym. Sci., Part B: Polym. Phys., 2006, 44, 1907–1918 CrossRef CAS.
- R. D. Groot and T. J. Madden, J. Chem. Phys., 1998, 108, 8713–8724 CrossRef CAS.
- A. A. Gavrilov, Y. V. Kudryavtsev and A. V. Chertovich, J. Chem. Phys., 2013, 139, 224901 CrossRef PubMed.
- E. S. Boek, P. V. Coveney, H. N. W. Lekkerkerker and P. van der Schoot, Phys. Rev. E: Stat. Phys., Plasmas, Fluids, Relat. Interdiscip. Top., 1997, 55, 3124–3133 CrossRef CAS.
- S. Yamamoto, Y. Maruyama and S. Hyodo, J. Chem. Phys., 2002, 116, 5842–5849 CrossRef CAS.
- J. C. Shillcock and R. Lipowsky, J. Chem. Phys., 2002, 117, 5048–5061 CrossRef CAS.
- H. Xu, Q. Zhang, H. Zhang, B. Zhang and C. Yin, J. Theor. Comput. Chem., 2013, 12, 1250111 CrossRef.
- X. Chen, F. Tian, X. Zhang and W. Wang, Soft Matter, 2013, 9, 7592–7600 RSC.
- A. AlSunaidi, W. K. Den Otter and J. H. R. Clarke, Philos. Trans. R. Soc., A, 2004, 362, 1773–1781 CrossRef CAS PubMed.
- M. A. Bates and M. Walker, Mol. Cryst. Liq. Cryst., 2010, 525, 204–211 CrossRef CAS.
- M. Bates and M. Walker, Soft Matter, 2009, 5, 346–353 RSC.
- M. A. Bates and M. Walker, Phys. Chem. Chem. Phys., 2009, 11, 1893–1900 RSC.
- M. A. Bates and M. Walker, Mol. Cryst. Liq. Cryst., 2010, 525, 204–211 CrossRef CAS.
- M. Walker, A. J. Masters and M. R. Wilson, Phys. Chem. Chem. Phys., 2014, 16, 23074–23081 RSC.
- R. D. Groot and P. B. Warren, J. Chem. Phys., 1997, 107, 4423–4435 CrossRef CAS.
- N. Boden, R. J. Bushby, L. Ferris, C. Hardy and F. Sixl, Liq. Cryst., 1986, 1, 109–125 CrossRef CAS.
- D. Chakrabarti and D. J. Wales, Phys. Rev. Lett., 2008, 100, 127801 CrossRef PubMed.
- F. Yan, C. A. Hixson and D. J. Earl, Phys. Rev. Lett., 2008, 101, 157801 CrossRef PubMed.
- D. J. Edwards, J. W. Jones, O. Lozman, A. P. Ormerod, M. Sintyureva and G. J. T. Tiddy, J. Phys. Chem. B, 2008, 112, 14628–14636 CrossRef CAS PubMed.
- M. W. Matsen and F. S. Bates, Macromolecules, 1996, 29, 7641–7644 CrossRef CAS.
- W. J. Harrison, D. L. Mateer and G. J. T. Tiddy, Faraday Discuss., 1996, 104, 139 RSC.
Footnotes |
| † Electronic supplementary information (ESI) available: Snapshot showing side views of the N phase for model 1. A movie showing dynamic chirality inversion for model 2 at 25 wt%. See DOI: 10.1039/c6sm01669c |
‡ The ESI† shows a short movie of a single column of model 2, over a sequence of 32![[thin space (1/6-em)]](https://www.rsc.org/images/entities/char_2009.gif) 000 time steps, showing the process of chirality inversion. 000 time steps, showing the process of chirality inversion. |
| This journal is © The Royal Society of Chemistry 2016 |

