 Open Access Article
Flow of wormlike micellar solutions around confined microfluidic cylinders†
Ya
Zhao
a,
Amy Q.
Shen
ab and
Simon J.
Haward
 *b
*b
aDepartment of Mechanical Engineering, University of Washington, WA 98195, USA
bMicro/Bio/Nanofluidics Unit, Okinawa Institute of Science and Technology, Onna, Okinawa 904-0495, Japan. E-mail: simon.haward@oist.jp; Tel: +81(0)98 966 8289
First published on 16th September 2016
Abstract
Wormlike micellar (WLM) solutions are frequently used in enhanced oil and gas recovery applications in porous rock beds where complex microscopic geometries result in mixed flow kinematics with strong shear and extensional components. Experiments with WLM solutions through model microfluidic porous media have revealed a variety of complex flow phenomena, including the formation of stable gel-like structures known as a Flow-Induced Structured Phase (FISP), which undoubtedly play an important role in applications of WLM fluids, but are still poorly understood. A first step in understanding flows of WLM fluids through porous media can be made by examining the flow around a single micro-scale cylinder aligned on the flow axis. Here we study flow behavior of an aqueous WLM solution consisting of cationic surfactant cetyltrimethylammonium bromide (CTAB) and a stable hydrotropic salt 3-hydroxy naphthalene-2-carboxylate (SHNC) in microfluidic devices with three different cylinder blockage ratios, β. We observe a rich sequence of flow instabilities depending on β as the Weissenberg number (Wi) is increased to large values while the Reynolds number (Re) remains low. Instabilities upstream of the cylinder are associated with high stresses in fluid that accelerates into the narrow gap between the cylinder and the channel wall; vortex growth upstream is reminiscent of that seen in microfluidic contraction geometries. Instability downstream of the cylinder is associated with stresses generated at the trailing stagnation point and the resulting flow modification in the wake, coupled with the onset of time-dependent flow upstream and the asymmetric division of flow around the cylinder.
1 Introduction
Surfactants are amphiphilic molecules that consist of a hydrophobic tail and a hydrophilic head group that can be neutrally, positively, or negatively charged. When the surfactant concentration is increased above a critical micelle concentration (CMC), surfactant monomers will spontaneously self-assemble into large aggregates known as micelles (in aqueous solutions) to shield the hydrophobic tails from water,1 see Fig. 1. The morphological variations of these micelles are dependent on the temperature, pH, concentration, salinity, surfactant packing parameter and flow conditions. For solutions of ionic surfactants, the addition of inorganic salts, such as sodium chloride (NaCl) and sodium nitrate (NaNO3), or strongly binding counterions such as the organic salt sodium salicylate (NaSal), have been shown to screen electrostatic repulsion of neighboring charged hydrophilic headgroups and considerably reduce the CMC, leading to a transition from spherical to wormlike micelles.2–4 Wormlike micelles (WLMs) are characterized as cylindrically elongated and semi-flexible aggregates, the morphology of which bear striking similarities to polymer chains but with larger diameters (1–10 nm) and longer persistence lengths (10–100 nm).5–7 In addition, the surfactant constituents of WLMs are weakly bound together by non-covalent bonds that exist in a dynamic equilibrium and constantly undergo scission and recombination. For this reason, WLMs are often referred to as “living polymers”.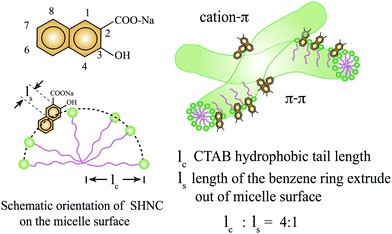 | ||
| Fig. 1 Chemical structures and schematic representation of the orientation of SHNC and SHNC/CTAB micelles.8 The numbers represent positions around the naphthalene ring where carboxyl and hydroxyl can be substituted. The green dots represent hydrophilic headgroups of CTAB while purple lines represent its hydrophobic tails. The green threadlike entities represent wormlike micelles in solution. In SHNC/CTAB micelles, extra intramolecular forces are introduced by π–π and cation–π interactions. | ||
Wormlike micelles are widely used as rheology modifying additives in household consumer products such as shampoos and detergents, as drag reduction agents, as proppant-carrying fracture fluids in enhanced oil and gas recovery and also in a variety of other oilfield operations.2–4,9–16 In oilfield applications, wormlike micellar solutions are pumped under high pressures through porous rock and gravel beds, which subjects the fluid to a complex mix of strong shearing and elongational kinematics over a range of length scales. Rojas et al.17,18 investigated porous media flow of WLM solutions formed by a mixture of two oppositely charged surfactants: cationic cetyl trimethylammonium p-toluene sulfonate (CTAT) and anionic sodium dodecyl sulfate (SDS). They observed a significant increase of viscosity after the flow and pointed out that besides shear, the extensional component in the local pore spaces promoted the entanglement of wormlike micelles, which could yield stronger structures and lead to enhanced viscoelasticity in the solution. Müller et al.19 proposed that the magnification of shear thickening in porous media flow was a synergistic effect arising from both shear and elongation impacting on the microstructure of WLMs.
Strong viscoelastic effects can be further enhanced as the characteristic length scale of the geometry is reduced to the microfluidic scale.20–23 Small characteristic lengths l of fluidic devices result in short time scales T (which scale with ∼l) and high deformation rates ![[small gamma, Greek, dot above]](https://www.rsc.org/images/entities/i_char_e0a2.gif) (which scale as ∼1/l). Therefore in microfluidic devices elastic effects as characterized by the magnitudes of either the Weissenberg number Wi = λ
(which scale as ∼1/l). Therefore in microfluidic devices elastic effects as characterized by the magnitudes of either the Weissenberg number Wi = λ![[small gamma, Greek, dot above]](https://www.rsc.org/images/entities/i_char_e0a2.gif) , or the Deborah number De = λ/T (where λ is the characteristic fluid relaxation time) can become high. In contrast, inertial effects in microfluidic devices, which can be characterized using a Reynolds number Re (which scales as ∼l) can become negligibly small. Several recent studies utilized microfluidic devices (with length scales of tens to hundreds of microns) to study elastic and inertio–elastic instabilities and three dimensional effects in viscoelastic fluids including polymer and wormlike micellar solutions.24–42
, or the Deborah number De = λ/T (where λ is the characteristic fluid relaxation time) can become high. In contrast, inertial effects in microfluidic devices, which can be characterized using a Reynolds number Re (which scales as ∼l) can become negligibly small. Several recent studies utilized microfluidic devices (with length scales of tens to hundreds of microns) to study elastic and inertio–elastic instabilities and three dimensional effects in viscoelastic fluids including polymer and wormlike micellar solutions.24–42
Vasudevan et al.36 studied a series of semi-dilute WLM solutions composed of mixtures of cetyltrimethyl ammonium bromide (CTAB) with NaSal flowing through a microfluidic tapered channel packed with glass beads (20–100 μm in diameter). The packed glass beads simulated porous media flow capable of achieving a total fluid strain of ∼O(104) with a combination of shear and elongation deformation rates of ∼O(104 s−1). They reported the formation of long-lived gel-like structures emerging from the porous bed, which they named a Flow-Induced Structured Phase (FISP). Similar FISP formation has since been observed for the flow of WLM solutions through simpler two-dimensional (2D) microfluidic model porous arrays of cylinders37,43,44 and also with WLM solutions formed from non-ionic surfactant.45 It has been shown by high-resolution SEM and cryo-EM imaging of captured gels that the FISP structure is stabilized by the formation of intermicellar branches and connections.44 However, the exact cause of this microstructural transition and the reason for its irreversibility remains largely unknown. The formation of such gel-like FISP in porous media flows of WLMs is likely to be of significant relevance to the application of WLMs in oilfield flooding and therefore demands to be better understood. Gel formation has also been reported for flow of aqueous poly(acrylamide) solutions through porous beds of sand or ballotini if extremely high deformation rates are applied and pore spaces are smaller than ∼O(10 μm).46
A first step towards understanding flows through a porous packed bed of particles comes from looking at the flow around a single particle such as a sphere, or its 2D equivalent, a cylinder. Even the flow field around a single cylinder confined between two walls is quite complex with a mixture of shearing and extensional kinematics. Upstream of the cylinder there is a compressional flow resulting in diverging streamlines as fluid approaches the leading axial stagnation point, and also regions of transient elongational flow as fluid is accelerated into the spaces around the sides of the cylinder. Around the sides of the cylinder the fluid is subjected to high shear rates relative to the bulk flow. Finally, in the downstream wake of the cylinder, high extensional rates and residence times are experienced by fluid elements that approach the trailing axial stagnation point.47–49 Flow around a cylinder has long been considered as a benchmark fluid mechanics problem.17,18,50–57 Flow around both cylinders and spheres have been studied as good models for many industrial processes that are relevant to applications such as flow separation, flow though porous media, particle suspension or sedimentation, etc.58–64 There are several previous experimental studies of wormlike micellar solutions flowing around macro-scale cylinders.65–67 In concentrated CTAB/NaSal solutions, Gladden and Belmonte65 reported solid-like tearing and cracking of the fluid in the wake of the cylinder along with an unsteady leading crack ahead of the cylinder. Since wormlike micelles can break and recombine after scission, the fracture was observed to “self-heal” after a few hours. Moss and Rothstein66,67 studied the flow around a cylinder with two different wormlike micellar solutions (50 mM CTAB mixed with 50 mM NaSal and 100 mM cetylpyridinium chloride (CPyCl) mixed with 50 mM NaSal) and observed elastic instability of CTAB/NaSal solution for flow rates beyond which a critical De was exceeded. Here, the Deborah number is defined by De = λ![[U with combining overline]](https://www.rsc.org/images/entities/i_char_0055_0305.gif) /R, where
/R, where ![[U with combining overline]](https://www.rsc.org/images/entities/i_char_0055_0305.gif) is the average velocity of the fluid in the channel, and R is the radius of the cylinder. They illustrated that the flow remained symmetric for both fluids at low De. As the De was increased, shear thinning effects dominated and a significant reduction in the normalized pressure drop across the cylinder was observed. For further increases in De, extensional rheology began to play an important role resulting in the onset of elastic instability, in particular for the CTAB/NaSal solution, which showed strong strain hardening behavior under extensional flow.
is the average velocity of the fluid in the channel, and R is the radius of the cylinder. They illustrated that the flow remained symmetric for both fluids at low De. As the De was increased, shear thinning effects dominated and a significant reduction in the normalized pressure drop across the cylinder was observed. For further increases in De, extensional rheology began to play an important role resulting in the onset of elastic instability, in particular for the CTAB/NaSal solution, which showed strong strain hardening behavior under extensional flow.
In a microscale fluidic device, Kenney et al.40 studied aqueous polyethylene oxide (PEO) solutions flowing around a cylinder. They used a single confined cylinder of diameter D = 65 μm in a channel of width W = 100 μm, providing a blockage ratio of β = D/W = 0.65. The Deborah number was varied between 0.01 < De < 1672 and the Reynolds number between 0.1 < Re < 20. Flow instability in the downstream wake was characterized by disordered and temporally varying streamlines, and was observed within the range 1 < De < 100 and 0.1 < Re < 10. This was a precursor to an instability upstream of the cylinder, which occurred for Re > 10 and De > 10, with unsteady vortices formed at the upstream surface of the cylinder. They concluded that the instability was fundamentally elastic in origin, though was affected by the moderate inertia in their experiment. Kenney et al.40 discussed their results in terms of a well-known criterion that describes the onset of purely elastic flow instabilities in terms of a build up of elastic tensile stresses along curved streamlines.68–71 However, in subsequent experiments using a wider variety of viscoelastic fluids and geometries with a range of characteristic dimensions, the same group of authors concluded that the onset of instability was due to the disruption of the base flow by the traveling elastic wave as the viscoelastic Mach number exceeded Ma > 1.72 With non-shear-thinning poly(acrylamide) in glycerol solutions, Galindo-Rosales et al.73 found that besides the blockage ratio, the aspect ratio of the microchannel (α = H/W, where H is the channel height) can also have a significant effect on the onset of instability. For given values of β and Wi, the instability was reported to become more intense for lower values of the aspect ratio, α.73
Recently Sun and Huang74 used full-field time-resolved flow-induced birefringence (FIB) imaging to study the behavior of CTAB/NaSal and CPyCl/NaSal WLM solutions in straight microchannels containing cylinders on their central axes. Three flow cells were examined: two of the devices contained a single cylinder with blockage ratios β = 0.25 and β = 0.5, the third device consisted of a linear array of seven aligned cylinders with β = 0.5. Sun and Huang demonstrated that both extensional and shear strain rates contributed to the flow induced birefringence and that the retardation measurement provides a quantitative and non-invasive representation of the fluid deformation and stress in microfluidics.
Motivated by this work, we examine the flow of a WLM solution through three microchannels each containing a single cylinder with a different cylinder to channel width ratio β. We use a combination of quantitative full-field FIB imaging and micro particle image velocimetry (μPIV) to study the effect of the localized micelle deformation on the macroscopic flow field over a wide range of imposed Weissenberg numbers but for low fluid inertia. We also use fluorescent streak images to qualitatively compare the flow patterns observed between wormlike micellar solutions with those seen for the flow of Newtonian fluid. We observe a complex sequence of non-Newtonian flow effects and viscoelastic flow instabilities upstream and downstream of the cylinders as Wi is incremented. Flow instabilities in wormlike micellar solutions have been quite well reported in microfluidic geometries providing approximations to either simple shear26–29 or purely elongational kinematics,24,25,31,95 but less so in more industrially relevant benchmark microfluidic flows characterized by mixed kinematics.74,94 Our results yield insight into the behavior of self-assembling surfactant systems under conditions of high spatial confinement within microfluidic flow geometries that provide a complex mixture of strong shear and elongational components. Our comprehensive data set clearly shows how the growth of viscoelastic stresses at high shear and extensional rates leads to modification of the flow field around the cylinder resulting in nonlinear flow dynamics and the onset of time-dependent flow instabilities. The results will be of relevance to the use of WLM fluids in enhanced oil recovery and microfluidic applications, and will also be of interest to those in the wider soft matter community concerned with the onset of viscoelastic flow instabilities in self-assembling micellar systems.
2 Experiments and methods
2.1 Materials
The wormlike micellar solution is an aqueous mixture of a cationic surfactant CTAB (Sigma-Aldrich, Saint Louis, MO) and 3-hydroxy naphthalene-2-carboxylate (SHNC), a strongly-binding organic hydrotropic salt (TCI America, Portland, OR), used as received. The solution was prepared by adding [CTAB] = 60 mM and SHNC with molar ratio R = [SHNC]/[CTAB] = 0.32 to deionized (DI) water and mixing for a minimum of 24 hours under room temperature 25 °C, and allowing the solution to equilibrate for one week. This salt/surfactant concentration ratio falls within the semi-dilute regime containing entangled WLMs.75 The strong hydrophobicity and naphthalene structure present in the SHNC enable strong non-covalent bonds (cation–π and π–π) between adjacent micelles, see schematics in Fig. 1. As a result, micelles in this particular CTAB/SHNC system have shown persistent birefringence after the cessation of flow,8,76 with stronger viscoelasticity when compared to other cationic surfactant–salt systems.75To highlight the hydrodynamic and structural instability in wormlike micellar solutions, we also prepared a Newtonian fluid that consists of 92 wt% glycerol mixed with DI water, with a constant viscosity of 0.15 Pa s at 25 °C. We chose proper flow rates for control experiments with the Newtonian solution in the microdevices to cover the same Re range as those resulting in subsequent experiments with the WLM solution. By comparing the flow patterns and velocity profiles between the Newtonian fluid and wormlike micellar solution, we then explored how the flow instabilities originating from the elasticity of the WLM solution depend on the various imposed conditions of geometric confinement.
2.2 Rheological characterizations
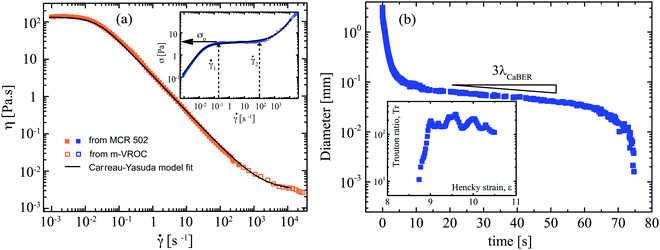
The viscoelastic properties of the wormlike micellar solution were measured at 25 °C using a stress controlled rheometer (MCR 502, Anton-Paar), with a stainless steel cone and plate geometry (50 mm diameter and angle 1°, with a truncation gap of 59 μm). An environmental chamber was used to prevent sample evaporation. The imposed shear rate was increased in the range 0.001 <![[small gamma, Greek, dot above]](https://www.rsc.org/images/entities/i_char_e0a2.gif) < 300 s−1, see solid symbols in Fig. 2a and its inset plot. Shear rates of
< 300 s−1, see solid symbols in Fig. 2a and its inset plot. Shear rates of ![[small gamma, Greek, dot above]](https://www.rsc.org/images/entities/i_char_e0a2.gif) < 300 s−1 resulted in flow instability and sample ejection from the rheometer. All measurements were repeated three times to ensure reproducibility.
< 300 s−1 resulted in flow instability and sample ejection from the rheometer. All measurements were repeated three times to ensure reproducibility.
Since the shear rate value reaches as high as ∼O(103 s−1) in the flow experiments involving the microfluidic cylinder geometries, we also measured the steady shear viscosity at higher shear rates using a high aspect ratio, rectangular microfluidic slit rheometer (m-VROC, RheoSense Inc.).32 The channel width, height and length are W = 3.308 mm, H = 50 μm and L = 8.8 mm, respectively, and four 800 × 800 μm2 MEMS-based pressure transducers are fitted along the centerline in order to measure the pressure gradient as a function of the imposed flow rate for the calculation of the wall shear stress.32 A thermal jacket maintained the temperature of the sample and the microfluidic chip at 25 °C. The Weissenberg–Rabinowitsch–Mooney correction was applied in order to determine the true wall shear rate, enabling the computation of the shear-rate-dependent viscosity up to shear rates of ![[small gamma, Greek, dot above]](https://www.rsc.org/images/entities/i_char_e0a2.gif) = 3 × 10⁴ s−1. This allowed us to characterize the high shear rate branch for the shear banding solution of CTAB/SHNC, see hollow symbols in Fig. 2a and its inset plot.
= 3 × 10⁴ s−1. This allowed us to characterize the high shear rate branch for the shear banding solution of CTAB/SHNC, see hollow symbols in Fig. 2a and its inset plot.
The wormlike micellar solution (60 mM CTAB/SHNC) exhibits strong shear-thinning behavior with a zero shear viscosity around 130 Pa s, see Fig. 2a. The WLM solution reaches a constant stress plateau (around 4 Pa) at ![[small gamma, Greek, dot above]](https://www.rsc.org/images/entities/i_char_e0a2.gif) ≈ 0.2 s−1 that extends almost three decades in shear rate, see inset to Fig. 2a. The occurrence of such stress plateaus in micellar solutions is generally attributed to the phenomenon of shear banding. In the shear banding regime, above a critical shear rate the homogeneous flow of wormlike micellar solutions can become unstable and separate into coexisting shear bands with different local viscosities and internal structures.6,77,78 The η(
≈ 0.2 s−1 that extends almost three decades in shear rate, see inset to Fig. 2a. The occurrence of such stress plateaus in micellar solutions is generally attributed to the phenomenon of shear banding. In the shear banding regime, above a critical shear rate the homogeneous flow of wormlike micellar solutions can become unstable and separate into coexisting shear bands with different local viscosities and internal structures.6,77,78 The η(![[small gamma, Greek, dot above]](https://www.rsc.org/images/entities/i_char_e0a2.gif) ) and σ(
) and σ(![[small gamma, Greek, dot above]](https://www.rsc.org/images/entities/i_char_e0a2.gif) ) curves are fitted using a Carreau–Yasuda model η
) curves are fitted using a Carreau–Yasuda model η![[small gamma, Greek, dot above]](https://www.rsc.org/images/entities/i_char_e0a2.gif) = η∞ + (η0 − η∞)/[1 + (
= η∞ + (η0 − η∞)/[1 + (![[small gamma, Greek, dot above]](https://www.rsc.org/images/entities/i_char_e0a2.gif) /
/![[small gamma, Greek, dot above]](https://www.rsc.org/images/entities/i_char_e0a2.gif) *)a](1−n)/a, which yields the zero shear rate viscosity η0 = 130 Pa s, the infinite shear rate viscosity η∞ = 3 mPa s, characteristic shear rate for onset of shear thinning
*)a](1−n)/a, which yields the zero shear rate viscosity η0 = 130 Pa s, the infinite shear rate viscosity η∞ = 3 mPa s, characteristic shear rate for onset of shear thinning ![[small gamma, Greek, dot above]](https://www.rsc.org/images/entities/i_char_e0a2.gif) * = 0.022 s−1, transient control factor a = 1.5 and power law index in the shear thinning region n = 0.05, see Table 1. As shown in a previous publication,75 the crossover frequency for G′ and G′′ obtained from a small amplitude oscillatory shear sweep gives a longest relaxation time of λr = 50.3 s, which is reasonably consistent with the value of 1/
* = 0.022 s−1, transient control factor a = 1.5 and power law index in the shear thinning region n = 0.05, see Table 1. As shown in a previous publication,75 the crossover frequency for G′ and G′′ obtained from a small amplitude oscillatory shear sweep gives a longest relaxation time of λr = 50.3 s, which is reasonably consistent with the value of 1/![[small gamma, Greek, dot above]](https://www.rsc.org/images/entities/i_char_e0a2.gif) * = 45.5 s.
* = 45.5 s.
| Solution | η 0 (Pa s) | η ∞ (Pa s) |
![[small gamma, Greek, dot above]](https://www.rsc.org/images/entities/i_char_e0a2.gif) * (s−1) * (s−1) |
n | a | λ CaBER (s) | Trmax |
|---|---|---|---|---|---|---|---|
| 60 mM CTAB/SHNC | 130 ± 1.3 | 0.003 ± 0.0001 | 0.022 | 0.05 | 1.5 | 45.4 ± 0.1 | ≈200 |
The extensional properties of the wormlike micellar solution were characterized at 25 °C using a Capillary Breakup Extensional Rheometer (Haake CaBER1, Thermo Scientific), equipped with circular end-plates (d0 = 6 mm in diameter) and a gap l0 = 2 mm between the top and bottom plates for initial loading of the WLM fluid sample. The plates were separated by a linear displacement over a 50 ms time period to reach a final separation of lf = 8 mm, and the time evolution of the diameter of the resulting fluid filament (d(t)) was measured until the eventual breakup of the fluid thread using a laser micrometer positioned at the midpoint between the two end-plates. The measurement was repeated six times in order to ensure reproducibility and a representative set of transient extensional rheology data is shown in Fig. 2b. As Fig. 2b shows, the filament diameter decayed with time to an eventual breakup at time tc ≈ 75 s. The diameter versus time curve displays an extended elasto-capillary regime between times 15 ≲ t ≲ 60 s, where the diameter of the fluid thread decays exponentially with time.79–81 This region can be fitted with an equation of the form d(t) = A![[thin space (1/6-em)]](https://www.rsc.org/images/entities/i_char_2009.gif) exp(−t/3λCaBER) in order to extract a characteristic relaxation time for the fluid of λCaBER = 45.4 ± 0.5 s, which is in fair agreement with the relaxation times obtained from both the Carreau–Yasuda model fit to the steady flow curve and from the crossover observed in small amplitude oscillatory shear measurements.75
exp(−t/3λCaBER) in order to extract a characteristic relaxation time for the fluid of λCaBER = 45.4 ± 0.5 s, which is in fair agreement with the relaxation times obtained from both the Carreau–Yasuda model fit to the steady flow curve and from the crossover observed in small amplitude oscillatory shear measurements.75
The transient extension rate ![[small epsi, Greek, dot above]](https://www.rsc.org/images/entities/i_char_e0a1.gif) (t) can be computed from the filament diameter using the expression
(t) can be computed from the filament diameter using the expression ![[small epsi, Greek, dot above]](https://www.rsc.org/images/entities/i_char_e0a1.gif) (t) = −2ḋ(t)/d(t), which can be integrated over time to give the total accumulated Hencky strain εH(t) = 2
(t) = −2ḋ(t)/d(t), which can be integrated over time to give the total accumulated Hencky strain εH(t) = 2![[thin space (1/6-em)]](https://www.rsc.org/images/entities/char_2009.gif) ln[d0/d(t)].79,81 Within the elasto-capillary thinning regime, assuming a balance between surface tension and elastic forces, the transient elongational viscosity of the fluid can be computed according to ηE = −σ/ḋ(t), where σ is the surface tension. The surface tension of the 60 mM CTAB/SHNC wormlike micellar solution was measured to be σ = 17.75 mN m−1 using a pendant drop tensiometer (Attension Theta, Biolin Scientific). The transient dimensionless Trouton ratio of the fluid is given by Tr(t) = ηE(t)/η0 and is plotted as a function of accumulated Hencky strain shown in the inset of Fig. 2b. The extensional viscosity ηE and Trouton ratio Tr increase monotonically with increasing Hencky strain εH, demonstrating a significant strain hardening: the WLM solution achieved a maximum extensional viscosity at a strain of εH = 9 where the Trouton ratio reached a maximum value of Trmax ≈ 200.
ln[d0/d(t)].79,81 Within the elasto-capillary thinning regime, assuming a balance between surface tension and elastic forces, the transient elongational viscosity of the fluid can be computed according to ηE = −σ/ḋ(t), where σ is the surface tension. The surface tension of the 60 mM CTAB/SHNC wormlike micellar solution was measured to be σ = 17.75 mN m−1 using a pendant drop tensiometer (Attension Theta, Biolin Scientific). The transient dimensionless Trouton ratio of the fluid is given by Tr(t) = ηE(t)/η0 and is plotted as a function of accumulated Hencky strain shown in the inset of Fig. 2b. The extensional viscosity ηE and Trouton ratio Tr increase monotonically with increasing Hencky strain εH, demonstrating a significant strain hardening: the WLM solution achieved a maximum extensional viscosity at a strain of εH = 9 where the Trouton ratio reached a maximum value of Trmax ≈ 200.
2.3 Microchannel design and fabrication
To investigate the elastic instabilities in the WLM solution in complex kinematics under large shear and extension rates, we fabricated three microdevices with a single cylinder in the middle of a straight microchannel, see Fig. 3. The three devices all have the same width W = 600 μm and the same height H = 100 μm (i.e. aspect ratio α = H/W = 0.167) but differ only by the diameter D of the cylinder, which is varied in order to manipulate the blockage ratio β = D/W. The blockage ratio in Device 1 was chosen to have the bench mark value β = 0.50 based on previous literature.82 The blockage ratio was increased to β = 0.67 in Device 2, and β = 0.83 in Device 3 in order to probe the effects of increasing spatial confinement on the behavior of WLM solution at low fluid inertia. The details of the three microfluidic channels are summarized in Table 2.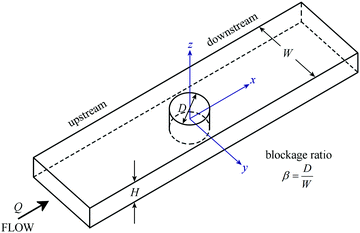 | ||
| Fig. 3 Microfluidic geometries contain a single cylinder in a straight microchannel with the blockage ratio β = W/D varied through 0.50, 0.67, and 0.83, by fixing the width of the microchannel W = 600 μm and adjusting the diameter of the cylinder D accordingly (see details in Table 2). | ||
| Geometry | Channel width, W (μm) | Cylinder diameter, D (μm) | Blockage, (β = D/W) | Height, H (μm) |
|---|---|---|---|---|
| Device 1 | 600 | 300 | 0.50 | 100 |
| Device 2 | 600 | 400 | 0.67 | 100 |
| Device 3 | 600 | 500 | 0.83 | 100 |
2.4 Dimensionless numbers
To study the effect of the localized micelle deformation on the macroscopic flow field in the microscale flow, we define the key dimensionless numbers, the Reynolds number (Re) and the Weissenberg number (Wi) based on conditions encountered within the narrow gap region between the cylinder and the channel walls: | (1) |
 | (2) |
![[u with combining overline]](https://www.rsc.org/images/entities/i_char_0075_0305.gif) =
= ![[U with combining overline]](https://www.rsc.org/images/entities/i_char_0055_0305.gif) /(1 − β), where
/(1 − β), where ![[U with combining overline]](https://www.rsc.org/images/entities/i_char_0055_0305.gif) = Q/WD is the average flow rate in the main channel and Q is the imposed volume flow rate. The hydraulic diameter in the narrow contraction is
= Q/WD is the average flow rate in the main channel and Q is the imposed volume flow rate. The hydraulic diameter in the narrow contraction is  . The shear viscosity η(
![[small gamma, Greek, dot above]](https://www.rsc.org/images/entities/i_char_e0a2.gif) ) used in the calculation of Re is found by evaluating the Carreau–Yasuda fit to the steady flow curve at a characteristic shear rate of
) used in the calculation of Re is found by evaluating the Carreau–Yasuda fit to the steady flow curve at a characteristic shear rate of  in the narrow gap. The elasticity number can be used to quantify the relative importance of elastic to inertial effects in the flow and is defined by El = Wi/Re.
2.5 Flow visualizations
Streak images were recorded with frame rates ranging from 0.3 to 10 frames per second (fps) for the steady two-dimensional flow, depending on the flow rate. For unsteady flows, single streak images were not sufficient to describe the flow behavior. Thus we recorded streak imaging videos over time periods of several seconds in order to observe the time-dependent nature of flow field in such cases.
The center plane of the channel was identified by first focusing on the top and bottom surfaces of the channel and then averaging the distance between the two. A fairly low magnification 4 × (NA = 0.13) Nikon PlanFluor objective lens was used for the imaging in order to capture the full width of the flow cell and a reasonable length both upstream and downstream of the cylinder. The fluid was illuminated using laser light emitted from a double-pulsed 527 nm Nd:YLF laser and image pairs were captured using a high speed CMOS camera (Phantom Miro) operating in frame-straddling mode and synchronized with the laser pulses. The delay between laser pulses was chosen within the range of 80 μs < δt < 800 μs (according to the imposed flow rate) such that the typical particle displacement between images in each pair was around 4 pixels, which is optimal for subsequent PIV analysis. The calculated measurement depth for this system is ≈140 μm.86 This is actually greater than the full depth of the flow cell (H = 100 μm) so we must be aware of the possibility of substantial averaging in our velocimetry data. Sequences of images were recorded and subsequently processed by a conventional cross-correlation PIV algorithm.87,88 For steady state flows, 100 image pairs were ensemble-averaged to obtain a single velocity field. For unsteady flows, individual image pairs were analyzed. Post-processing techniques to remove spurious vectors and interpolate for missing vectors were only used for unsteady flows.
3 Results and discussions
In this section we investigate the effects of localized micelle deformation and increasing spatial confinement in the microchannel upon the macroscopic flow field of the wormlike micellar solution over a wide range of Weissenberg numbers but for low Reynolds numbers. By using a combination of quantitative full-field FIB imaging, μPIV, and fluorescent streak imaging, we are able to qualitatively and quantitatively compare the flow patterns from the WLM solution with those from the Newtonian fluid over a similar Re range.3.1 Newtonian flow around microfluidic cylinders
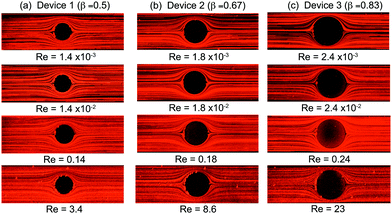
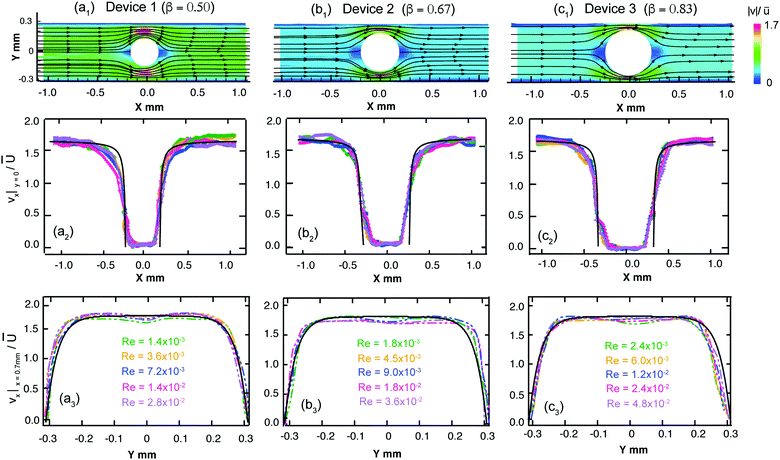
We first examine the flow of the Newtonian fluid around the confined microfluidic cylinders, in order to validate our measurement techniques and to provide standard flow patterns for later comparison with flows of the wormlike micellar solution. Streak images of Newtonian fluid flow around the three confined geometries are shown in Fig. 4, for a range of Reynolds numbers spanning 1.4 × 10⁻³ < Re < 23. Fore-aft and lateral symmetry with smooth streamlines around the cylinder is observed in all three devices over the entire range of Re (see Fig. 4).We also conducted μPIV experiments in order to quantitatively map the flow field of the Newtonian fluid in all three channels as a function of increasing flow rates, or Re, see Fig. 5. Here, the two-dimensional (2D) maps of the velocity magnitude shown with superimposed streamlines (top panel, Fig. 5a1, b1 and c1) have been normalized using the average velocity in the constriction regions, ![[u with combining overline]](https://www.rsc.org/images/entities/i_char_0075_0305.gif) =
= ![[U with combining overline]](https://www.rsc.org/images/entities/i_char_0055_0305.gif) /(1 − β). The streamwise velocity profiles of vx along the centerline (y = 0, middle panel, Fig. 5a2, b2 and c2) and across the channels at x = 0.7 mm (bottom panel, Fig. 5a3, b3 and c3) for all three devices have been normalized by the average flow velocity in the main channel,
/(1 − β). The streamwise velocity profiles of vx along the centerline (y = 0, middle panel, Fig. 5a2, b2 and c2) and across the channels at x = 0.7 mm (bottom panel, Fig. 5a3, b3 and c3) for all three devices have been normalized by the average flow velocity in the main channel, ![[U with combining overline]](https://www.rsc.org/images/entities/i_char_0055_0305.gif) = Q/WH. Curves with different colors in the middle and bottom panels correspond to different flow rates (hence Re numbers). These normalized velocity profiles nearly collapse onto master curves, as expected for low Re flow of a Newtonian fluid. The black curves shown in Fig. 5a2, b2 and c2 are based on the theoretical prediction of the velocity profile for potential flow around a cylinder, with v(x) = 1.68
= Q/WH. Curves with different colors in the middle and bottom panels correspond to different flow rates (hence Re numbers). These normalized velocity profiles nearly collapse onto master curves, as expected for low Re flow of a Newtonian fluid. The black curves shown in Fig. 5a2, b2 and c2 are based on the theoretical prediction of the velocity profile for potential flow around a cylinder, with v(x) = 1.68![[U with combining overline]](https://www.rsc.org/images/entities/i_char_0055_0305.gif) (1 − D/2x). Downstream of the cylinder at a distance of x = 0.7 mm, profiles of the streamwise flow velocity taken across the channel compare well with a numerical prediction of the fully-developed velocity profile for creeping Newtonian flow in a 600 × 100 μm rectangular channel, see black lines in Fig. 5a3, b3 and c3. This prediction gives the maximum streamwise velocity along the channel axis of vx,max = 1.68
(1 − D/2x). Downstream of the cylinder at a distance of x = 0.7 mm, profiles of the streamwise flow velocity taken across the channel compare well with a numerical prediction of the fully-developed velocity profile for creeping Newtonian flow in a 600 × 100 μm rectangular channel, see black lines in Fig. 5a3, b3 and c3. This prediction gives the maximum streamwise velocity along the channel axis of vx,max = 1.68![[U with combining overline]](https://www.rsc.org/images/entities/i_char_0055_0305.gif) . The close agreement between our experimental velocimetry data and theoretical expectations validates our PIV setup and image processing algorithms and allays any concerns regarding excessive averaging due to the large measurement depth of our imaging system.89–91
. The close agreement between our experimental velocimetry data and theoretical expectations validates our PIV setup and image processing algorithms and allays any concerns regarding excessive averaging due to the large measurement depth of our imaging system.89–91
3.2 WLM flow around microfluidic cylinders
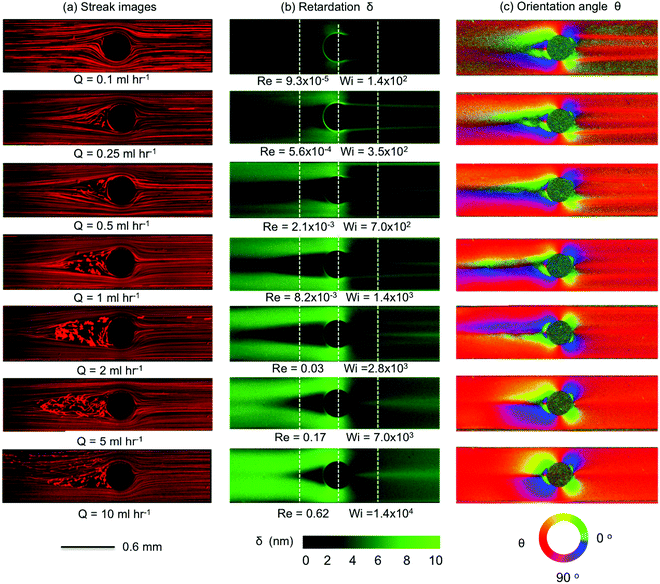
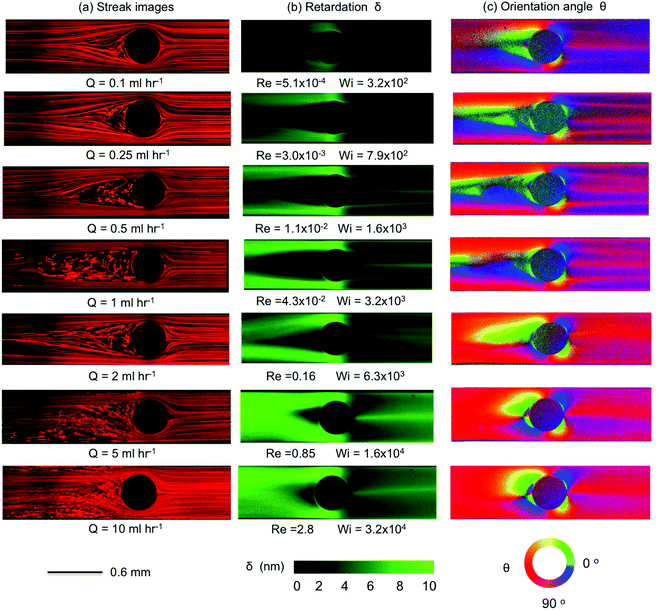
Here we present the results of streak imaging experiments and FIB measurements for the flow of the wormlike micellar CTAB/SHNC solution through the three confined microfluidic cylinder geometries. We illustrate the transition from steady through to time-dependent flows at volumetric flow rates spanning 0.1 < Q < 10 mL h−1, which correspond to a wide range of Weissenberg numbers 1 ≲ Wi ≲ 105, but extremely low to moderate Reynolds numbers 10−7 ≲ Re ≲ 10.In Fig. 6 we present the results obtained from Device 1 (β = 0.5). We observed that the flow remained steady, symmetric and Newtonian-like for Wi ≲ 50 (Q < 0.05 mL h−1, data not shown). However, as the flow rate is increased, the flow patterns observed with CTAB/SHNC solution diverge in comparison to those of the Newtonian flow. For Q = 0.1 mL h−1 (Wi = 140), bending streamlines are observed upstream of the cylinder, see Fig. 6a. As the Weissenberg number is increased to Wi = 350 (Q = 0.25 mL h−1) a recirculating vortex region develops at the upstream surface of the cylinder, which extends progressively further upstream with increasing flow rates. Interestingly, with this WLM solution we do not observe the “pinching” of streamlines immediately upstream of the recirculation region, which seems to be a typical feature of flows of viscoelastic polymer solutions around cylinders.40,72,73 Here we observe more smooth and continuous divergence of the streamlines towards the sides of the cylinder. For Wi ≳ 1400 (Q ≳ 1 mL h−1), bending streamlines and lateral asymmetries about the y = 0 axis become apparent towards the downstream wake of the cylinder. Crossing streamlines also indicate the onset of three-dimensional (3D) flow effects. When the flow rate reaches Q = 10 mL h−1 (Wi = 1.4 × 10⁴), the flow upstream of the cylinder undergoes a large scale loss of stability, the recirculating vortex region collapses and reforms in an apparently quasi-periodic fashion, leading to an unsteady 3D flow field. For more details please refer to the video “Device 1”, contained in the ESI.†
The streak images in Fig. 6a (left column) are consistent with the birefringent patterns shown in the middle and right columns in Fig. 6b and c. As in the streak images, we observe distinctly different growth of the birefringence patterns upstream and downstream of the cylinder. In the upstream region, the birefringence intensity increases the most where fluid is squeezed into the narrow gaps between the sides of the cylinder and the channel walls. The result is reminiscent of the flow into a contraction, in which the stress increases progressively as polymers or WLMs approach the contraction and recirculating regions develop and grow at the salient corners, effectively displacing the contraction plane towards the upstream as the Weissenberg number is increased.91–94 Here, the upstream surface of the cylinder behaves as the salient corner located between two “half-contractions”. As Wi increases, the growth of the upstream recirculation causes the streamlines to divide, and stress to grow, from a location progressively further back upstream. The patterns of retardation upstream of the cylinder shown in Fig. 6b bear similarity to those reported by Sun and Huang74 for flows of wormlike micellar CTAB/NaSal solutions around confined microfluidic cylinders with β = 0.5. However, they are quite distinct from the images of birefringence captured by Moss and Rothstein67 for the flow of CTAB/NaSal solutions upstream of macroscopic cylinders with relatively low blockage ratios β = 0.1 and 0.2. They reported that micelles deformed strongly upstream of the cylinder and that the retardation intensity increased approaching the leading edge (or upstream stagnation point) of the cylinder; in contrast, our birefringent patterns show a dark area with lower birefringence intensity in the area upstream of the cylinder corresponding to the location of the recirculation seen in Fig. 6a. This discrepancy between our observations and those of Moss and Rothstein67 is probably due to increased confinement effects between the microchannel wall and the sides of the cylinder, which gives rise to extra viscoelastic stresses, resulting in pressure buildup and secondary flows upstream.
Downstream of the cylinder, the buildup of stress birefringence due to the contraction in flow cross section at the sides of the cylinder is suddenly relieved as the flow expands into the downstream wake, see Fig. 6b. Here, we observe the formation and intensification of narrow birefringent strands that originate from the trailing edge of the cylinder. Initially, at Wi = 140, three such strands are clearly evident: two strands are located symmetrically on either side of the y = 0 axis and appear to originate from shear-induced birefringence that becomes detached from the surface of the cylinder. The third birefringent strand is centrally located and originates from the axial trailing stagnation point. At such locations residence times are long and elongational rates can be high, while shear and vorticity is minimal.48 These conditions provide the possibility of achieving high elongation of WLMs.24,31,67,74 As the Weissenberg number increases beyond Wi = 700, the relative intensity of the central birefringent strand grows as the two off-axis strands diminish. Eventually, for Wi ≥ 7000, only the single centrally-located strand originating from the stagnation point remains. The formation of birefringent strands in the strong extensional flow of WLM solutions in the vicinity of stagnation points has been reported in a number of publications.24,25,31,66,67,95 Similar patterns of birefringent strands were observed previously by Moss and Rothstein67 for the flow of CTAB/NaSal solutions downstream of macroscopic cylinders with low blockage ratios. The pattern of three birefringent strands seen here is also similar to that reported by Cressely and Hocquart47 for the flow of a poly(ethylene oxide) solution in the wake of a cylinder and is reminiscent of the birefringence patterns reported by Haward and Odell63 for the flow of dilute poly(styrene) solutions in the wake of a sphere.
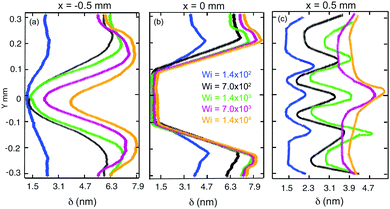
We quantitatively characterize the birefringence growth with Wi in Device 1 by plotting the retardation δ measured across the microchannel at three specific locations: at the upstream position x = −0.5 mm (Fig. 7a); at the centerline of the cylinder x = 0 mm (Fig. 7b); and at the downstream position x = 0.5 mm (Fig. 7c), as indicated by the locations of the three vertical dashed white lines shown in Fig. 6b. For each x position, the birefringence intensity measured transverse to the flow direction changes significantly as the flow rate is increased in the range 0.1 < Q < 10 mL h−1, equivalent to 1.4 × 10² < Wi < 1.4 × 10⁴.
When the Weissenberg number increases from Wi = 140 (blue curves) to Wi = 700 (black curves), the retardance near the channel walls upstream of and to the sides of the cylinder increases significantly, before tending towards a saturation value of around 8 nm as Wi is increased towards Wi = 1.4 × 10⁴, see Fig. 7a and b. For downstream flows at Wi ≤ 1400, three birefringent strands are evident at x = 0.5 mm, which exhibit intensity peaks at y ≈ −0.15 mm, y ≈ 0 mm and y ≈ 0.15 mm, see Fig. 7c. For higher Wi ≥ 7000, the pair of strands located at y = ±0.15 mm are lost, while the central strand continues to intensify with increasing Wi.
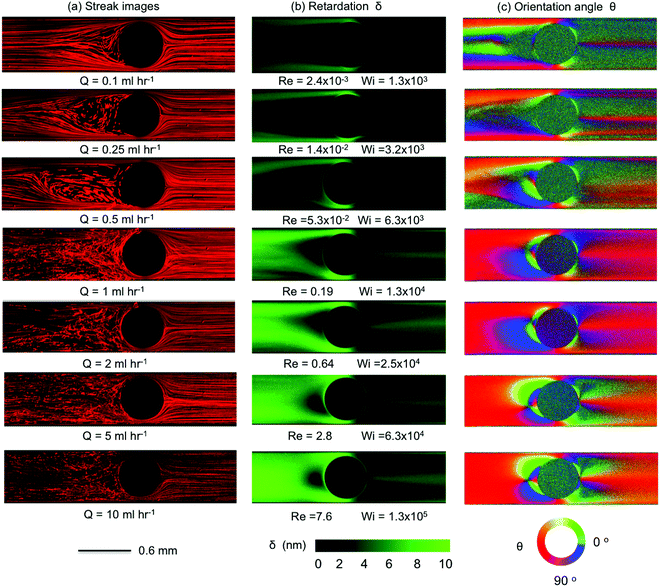
As the blockage ratio of the cylinder is increased in Device 2 (with β = 0.67), the onset of disordered streak images emerges at lower flow rates (Q = 0.1 mL h−1, Wi = 320) than in Device 1, with a larger unstable triangle-like vortex growth region formed upstream as the Weissenberg number is increased, see Fig. 8. As Wi is increased further, the divergent streamlines become progressively more pronounced and a transition to elastic instability occurs upstream when the flow rate reaches Q = 5 mL h−1 (Wi = 1.6 × 10⁴). Both the streak images and the birefringence patterns are very similar to those produced by Device 1, although the transitions between flow states are shifted to lower flow rates (but broadly similar Wi). For Q = 2 mL h−1 (Wi = 6300), we observe time-dependent quasi-periodic oscillations in the upstream flow patterns. This upstream instability intensifies with increasing flow rates ultimately resulting in a chaotic-appearing 3D flow field for Q = 10 mL h−1 (Wi = 3.2 × 10⁴), see video “Device 2” provided in the ESI.†
With the largest blockage ratio of β = 0.83 (Device 3, Fig. 9), the flow streamline and birefringence patterns are again broadly similar to those observed at lower blockage ratios (Fig. 6 and 8), although transitions between flow regimes are again shifted to lower flow rates. Significant spatiotemporal fluctuations and 3D flow is now clearly evident at a flow rate of only Q = 1 mL h−1 (Wi = 1.3 × 10⁴). For Q ≥ 2 mL h−1 (Wi ≥ 2.5 × 10⁴) flow upstream of the cylinder in Device 3 appears chaotic, while disordered and temporally varying streamlines become evident downstream of the cylinder. Please see video “Device 3” contained in the ESI† to view time resolved streak imaging of these phenomena. We note that the sequence of instabilities we observe here contrasts with reports involving viscoelastic polymer solutions, in which instability first arose downstream of the cylinder and was considered to drive the onset of instability in the upstream region.40,72 In the case of our WLM solution, instability in the form of bending and distorted streamlines is first apparent upstream of the cylinder.
3.3 Flow kinematics
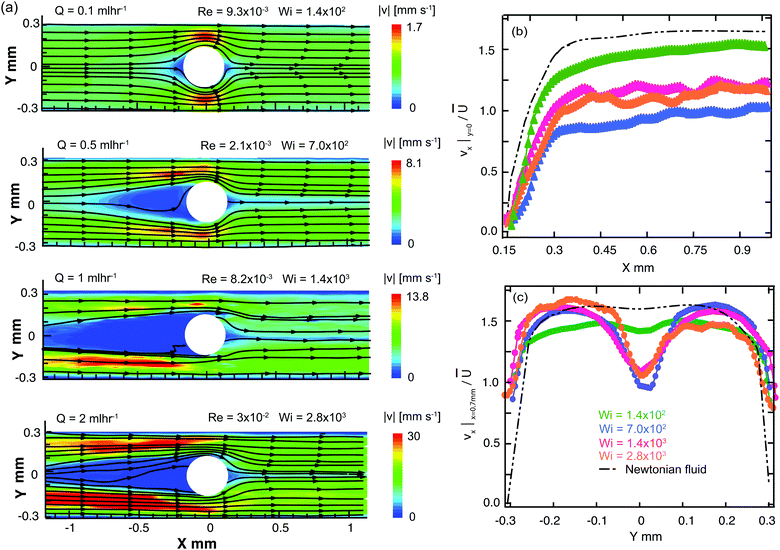
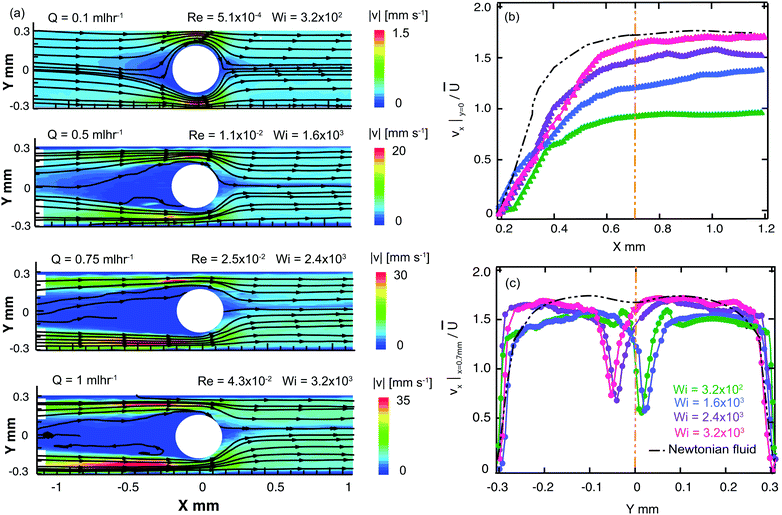
In this section we make use of quantitative μPIV measurements for the Newtonian fluid and the WLM test solution, in order to analyze and compare the flow velocity profiles downstream of the cylinder. Here we focus on Device 1 and Device 2 only because Device 3 exhibits unsteadiness in the downstream section of channel at rather low flow rates, so very limited data is available for analysis in this case.In Fig. 10a we present velocity magnitude maps with superimposed streamlines for the flow of the wormlike micellar CTAB/SHNC solution over a range of flow rates and Wi. At Wi = 140 the flow is approximately fore-aft and laterally symmetric. However, at Wi = 700 there appears a large almost stagnant region upstream of the cylinder in the area corresponding to the recirculation zone apparent in Fig. 6a. In the trailing wake of the cylinder a region of low flow velocity becomes apparent along the y = 0 axis, extending downstream from the trailing stagnation point and corresponding to the location of the central downstream birefringent strand observed in Fig. 6b. As the Weissenberg number is increased further, the stagnant region upstream of the cylinder grows upstream (as does the recirculating region shown in Fig. 6a), while the low flow velocity region on the y = 0 axis downstream of the cylinder is maintained. Downstream of the cylinder, we make measurements of the streamwise velocity along the y = 0 axis (Fig. 10b) as well as across the channel at a location x = 0.7 mm (Fig. 10c). These velocity profiles have been normalized by the average flow velocity in the channel, ![[U with combining overline]](https://www.rsc.org/images/entities/i_char_0055_0305.gif) = Q/WH and are compared with equivalent profiles obtained with the Newtonian fluid. In Fig. 10b, it is clear that as the Wi is increased from 140 to 700 in Device 1 the flow velocity along the centerline of the channel downstream of the cylinder becomes very significantly reduced compared to the velocity measured in the Newtonian fluid. As Wi is increased further to 1400 and subsequently to 2800, the centerline velocity increases again slightly. In Fig. 10c, the profiles of the streamwise velocity taken across the channel in the downstream reveal the development of a significant dip in the velocity on the centerline, that appears as the Wi is incremented, resulting in a non-monotonic velocity profile. The location of the dip in the streamwise flow velocity corresponds to the location of the central birefringent strand observed in Fig. 6b and 7c. Such non-monotonic flow profiles have been observed in the vicinity of birefringent strands in polymer solution flows near stagnation points and are generally considered to be a consequence of a localized increase in the extensional viscosity of the fluid due to the high strains and elongation rates experienced at the stagnation point.49,96–99 We are not aware of any explicit report of such non-monotonic flow profiles obtained from flow velocimetry performed on wormlike micellar solutions flowing near stagnation points. It is interesting to point out that the two additional birefringent strands visible in Fig. 6b and 7c, located at y ≈ ±0.15 mm, do not cause a dip in the velocity profiles shown in Fig. 10c. This is despite the fact that the intensity of the retardance (hence presumably the stress) in those strands is at least equal to, or even greater than, the retardance measured in the central strand originating from the stagnation point.
= Q/WH and are compared with equivalent profiles obtained with the Newtonian fluid. In Fig. 10b, it is clear that as the Wi is increased from 140 to 700 in Device 1 the flow velocity along the centerline of the channel downstream of the cylinder becomes very significantly reduced compared to the velocity measured in the Newtonian fluid. As Wi is increased further to 1400 and subsequently to 2800, the centerline velocity increases again slightly. In Fig. 10c, the profiles of the streamwise velocity taken across the channel in the downstream reveal the development of a significant dip in the velocity on the centerline, that appears as the Wi is incremented, resulting in a non-monotonic velocity profile. The location of the dip in the streamwise flow velocity corresponds to the location of the central birefringent strand observed in Fig. 6b and 7c. Such non-monotonic flow profiles have been observed in the vicinity of birefringent strands in polymer solution flows near stagnation points and are generally considered to be a consequence of a localized increase in the extensional viscosity of the fluid due to the high strains and elongation rates experienced at the stagnation point.49,96–99 We are not aware of any explicit report of such non-monotonic flow profiles obtained from flow velocimetry performed on wormlike micellar solutions flowing near stagnation points. It is interesting to point out that the two additional birefringent strands visible in Fig. 6b and 7c, located at y ≈ ±0.15 mm, do not cause a dip in the velocity profiles shown in Fig. 10c. This is despite the fact that the intensity of the retardance (hence presumably the stress) in those strands is at least equal to, or even greater than, the retardance measured in the central strand originating from the stagnation point.
Similar trends are observed for the 60 mM CTAB/SHNC WLM solution flowing in Device 2 (β = 0.67), see Fig. 11. Here, very significant and sharp dips are apparent in the velocity profiles taken across the channel downstream of the cylinder, Fig. 11c, where the minimum normalized flow velocity can be as little as 30% of the value measured in the Newtonian fluid. In the case of Device 2, the location of the local minimum in streamwise velocity has an increased tendency to deviate from the flow axis (y = 0) as compared with Device 1 (see Fig. 10c). This deviation from the flow axis appears to be connected with the asymmetric division of the flow either side of the cylinder, so is most likely a result of coupling with the time-dependent flow instability upstream of the cylinder.
3.4 Upstream vortex growth with Wi
Here we examine the growth of the recirculating vortices observed upstream of the cylinders in all 3 devices as the Weissenberg number is increased. We quantify the vortex length L by measuring the distance along x between the leading edge of the cylinder and the location upstream of the cylinder where streamlines diverge. The length of the vortex L at each flow rate is averaged from a sequence of 5 streak images and is normalized by the cylinder diameter D to obtain the dimensionless vortex length χ = L/D, which is plotted as a function of Wi in Fig. 12. Error bars on the data points in Fig. 12 represent the standard deviation of each sample of 5 measurements. The dimensionless vortex length χ increases gradually with increasing Wi, following a similar trend for all three devices and tending to a plateau value of χ ≈ 3 (L ≈ 3D) for Wi ≳ 3 × 10³, before the flow upstream of the cylinder becomes unsteady and time-dependent. In Fig. 12, we do not include data at Weissenberg numbers beyond the onset of time-dependent flow since the determination of the length of the upstream vortex under such conditions becomes highly uncertain in all three devices. The behavior shown here is similar to that reported by Kenney et al.40 for the growth of vortices upstream of a confined cylinder with a highly elastic semidilute poly(ethylene oxide) solution. However, unlike Kenney et al.,40 in no cases do we observe a periodic growth and collapse cycle of the vortices.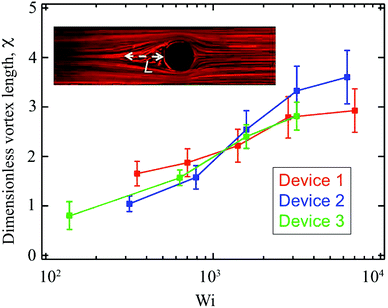 | ||
| Fig. 12 Dimensionless vortex length (χ = L/D) as a function of Wi for 3 different blockage ratio devices. The inset illustrates the definition of vortex length L. | ||
3.5 Flow pattern map
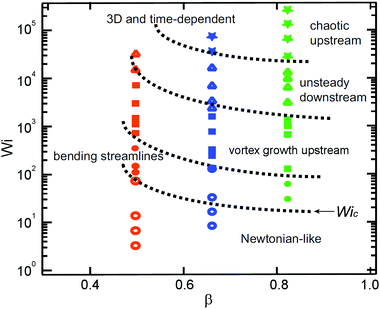
We summarize the transitions between the various flow patterns observed with our WLM solution in all three microfluidic cylinder devices using Wi–β state space, see Fig. 13. The flow of WLM solution displayed at least five distinct regimes in all experiments. We categorize the various flow states as described below:• Newtonian-like flow: flow is steady and both fore-aft and laterally symmetric around the cylinder
• Bending streamlines: streamlines become distorted in the compressional flow at the leading cylinder edge due to the onset of elastic effects
• Vortex growth upstream: streamlines begin to diverge upstream of the cylinder leading edge (i.e. near the upstream stagnation point), a recirculating region develops and a vortex grows with increasing Wi
• Unsteady flow downstream: time-dependent motion of streamlines is observed downstream
• 3D and time-dependent: flow becomes unsteady both upstream and downstream with quasi-periodic or chaotic appearance upstream
These flow regimes occur over a very wide variation in the Weissenberg number between Wi ∼ O(1) up to Wi ∼ O(105), but while inertial effects in the flow remain low with the Reynolds number in the range 10−7 ≲ Re ≲ 10. Note that the flow regime diagram shown in Fig. 13 will most likely also depend on the channel height H, which here is fixed at H = 100 μm in all three devices. Experiments with devices of different aspect ratio α = H/W may show similar flow transitions, but at different Wi values.
Rodd et al. reported the onset of transition from Newtonian-like flow patterns to bending streamlines at a critical Weissenberg number Wic ≈ 50 for semi-dilute polyethylene oxide (PEO) solutions through a micro-fabricated contraction expansion channel (with a contraction ratio of 16![[thin space (1/6-em)]](https://www.rsc.org/images/entities/char_2009.gif) :
:![[thin space (1/6-em)]](https://www.rsc.org/images/entities/char_2009.gif) 1) and with the Weissenberg number defined within the narrow contraction.91,92 In our confined cylinder devices, we also define our Weissenberg number in the narrow constriction regions and we observe the initial onset of flow transitions due to elastic effects occurs at comparable Wic. However, in our system there is some dependence of the critical Weissenberg number on the blockage ratio β (see Fig. 13), with Wic ≈ 100 in Device 1, Wic ≈ 50 in Device 2, and Wic ≲ 30 in Device 3. The onset of instabilities in the WLM solution showed a clear dependence on the spatial confinement resulting from the increasing blockage ratio. Kenney et al.40 reported flow instabilities with semi-dilute PEO solutions flowing around a microfluidic cylinder device with a cylinder blockage ratio of β = 0.65. They proposed that the instabilities they observed were purely elastic in origin but were affected by inertia. Also working with semi-dilute PEO solutions, Shi et al.72 proposed that instability arose due to the speed of the base flow exceeding that of the elastic traveling wave at a viscoelastic Mach number
1) and with the Weissenberg number defined within the narrow contraction.91,92 In our confined cylinder devices, we also define our Weissenberg number in the narrow constriction regions and we observe the initial onset of flow transitions due to elastic effects occurs at comparable Wic. However, in our system there is some dependence of the critical Weissenberg number on the blockage ratio β (see Fig. 13), with Wic ≈ 100 in Device 1, Wic ≈ 50 in Device 2, and Wic ≲ 30 in Device 3. The onset of instabilities in the WLM solution showed a clear dependence on the spatial confinement resulting from the increasing blockage ratio. Kenney et al.40 reported flow instabilities with semi-dilute PEO solutions flowing around a microfluidic cylinder device with a cylinder blockage ratio of β = 0.65. They proposed that the instabilities they observed were purely elastic in origin but were affected by inertia. Also working with semi-dilute PEO solutions, Shi et al.72 proposed that instability arose due to the speed of the base flow exceeding that of the elastic traveling wave at a viscoelastic Mach number  . However, in our experiments the elasticity numbers (El = Wi/Re) are significantly higher than those in the experiments of Kenney et al. and Shi et al.40,72 Here, the elasticity varies in the range 104 ≲ El ≲ 107, depending on the flow rate (due to shear thinning) whereas the elasticity of the most elastic fluid studied by Kenney et al was El = 88.40 The instabilities observed by Shi et al.72 arose for relatively moderate values of the Reynolds number (0.1 ≲ Re ≲ 1). In our work, instabilities in the form of bending and asymmetric streamlines become apparent for Reynolds numbers as low as Re ≈ 10−5, indicating that inertia is negligible in our case. We have evaluated the viscoelastic Mach numbers at the onset of instability in our experiment (using the same definitions of Re and De employed by Shi et al.72) and we find in all three cases that Ma ≪ 1. Therefore we consider instabilities for the flow of our WLM solution in our single cylinder devices to be purely elastic in origin. We associate the onset of instability upstream of the cylinder with the compression at the leading edge of the cylinder and the growth of viscoelastic stresses generated by the squeezing flow into the narrow gaps between the cylinder and the channel walls. Downstream of the cylinder, there is significant growth of viscoelastic stress originating from the trailing stagnation point, which results in strong flow modification in the wake of the cylinder. This may be the cause of the onset of flow instability in the downstream wake, although coupling with instability and time dependent flow upstream also appears to be a strong factor influencing the onset of the time dependent motion of streamlines observed in the downstream.
4 Discussion and conclusions
In this work, we investigated the flow of a Newtonian fluid and a viscoelastic wormlike micellar solution prepared from CTAB with a strong hydrotropic salt past three microfluidic cylinder devices with different blockage ratios. For Newtonian fluid flow, we have used flow diagnostic techniques including streak imaging and flow velocimetry to show both fore-aft and lateral symmetry of the flow with smooth streamlines around the cylinder over a range of Re comparable to those encountered in experiments with the WLM solution. In experiments with the WLM solution, we have used streak imaging, quantitative flow velocimetry and FIB imaging to document a sequence of elastic flow instabilities that occur for low Re but as the Wi is increased to very high values ∼O(105). We observe some contrasting effects compared with previous experiments carried out with viscoelastic polymer solutions.40,72,73 In particular with our WLM solution, instability is first apparent in the form of bending and distorted streamlines upstream of the cylinder, not downstream of the cylinder as reported by Kenney et al. and Shi et al.40,72 Also, as the instability develops we observe smoothly diverging streamlines upstream of the cylinder, as opposed to the “pinching” streamlines typically observed with polymer solutions.40,72,73 In addition, in our experiments the viscoelastic Mach numbers are apparently too low to account for the observed instabilities.72 Our results suggest that the instabilities observed upstream of the cylinder are associated with the growth of high stresses generated in the viscoelastic WLM fluid as it accelerates into the narrow gaps between the cylinder and the channel walls. The instabilities downstream of the cylinder are most likely associated with stresses generated by strong extensional deformations at the trailing stagnation point and the resulting flow modification in the wake, and are influenced by the onset of time-dependent flow in the upstream region. Furthermore, the onset of flow instabilities and flow patterns of the WLM solution are sensitive to the degree of confinement resulting from the variation of the blockage ratio of the channels.The characteristic shear rates imposed within the microchannels lie in the range 0.1 ≲ ![[small gamma, Greek, dot above]](https://www.rsc.org/images/entities/i_char_e0a2.gif) ≲ 1000 s−1, which coincides with the shear-banding stress-plateau regime in the steady flow curve (see Fig. 2a). Therefore, the instabilities we report are also likely to be affected by strong shear thinning and non-uniform distributions of stresses and structural interactions between micelles. We note that in our three microfluidic devices, besides the variable degree of spatial confinement caused by the presence of the cylinder, we also have a high degree of confinement due to the uniform shallow height of each device (H = 100 μm). This results in a three-dimensional flow and a large shear rate along the z-direction (see Fig. 3). It will be important in future studies to examine how the observed sequence of flow transitions is influenced by increasing the channel aspect ratio (α = H/W) for a fixed blockage ratio (β = D/W), as was performed by Shi et al.72 with aqueous PEO solutions.
≲ 1000 s−1, which coincides with the shear-banding stress-plateau regime in the steady flow curve (see Fig. 2a). Therefore, the instabilities we report are also likely to be affected by strong shear thinning and non-uniform distributions of stresses and structural interactions between micelles. We note that in our three microfluidic devices, besides the variable degree of spatial confinement caused by the presence of the cylinder, we also have a high degree of confinement due to the uniform shallow height of each device (H = 100 μm). This results in a three-dimensional flow and a large shear rate along the z-direction (see Fig. 3). It will be important in future studies to examine how the observed sequence of flow transitions is influenced by increasing the channel aspect ratio (α = H/W) for a fixed blockage ratio (β = D/W), as was performed by Shi et al.72 with aqueous PEO solutions.
In this work we did not observe evidence of the formation of the Flow-Induced Structured Phase (FISP) that has been reported previously for flows of WLM solutions through arrays of cylinders and through microscale models of porous media.36,37,43–45,100,101 This may be because the degree of spatial confinement in our devices was insufficient, or because shear and elongation rates were too low, or the concentration fluctuation of micelles was not sufficient in the flow field, or because the total fluid strains imposed were not great enough to induce the formation of FISP.36,44 In future work we intend to increase the complexity of our microfluidic devices through combinations of multiple aligned cylinders, staggered cylinders, etc., systematically varying the spatial confinement, strain rate and total available fluid strain. Our eventual aim is to approach a closer model of a real porous medium while building an understanding of the geometrical and rheological factors that affect flow stability (or onset of instability) and the potential formation of FISP in fluidic systems relevant to enhanced oil and gas extraction from underground reservoirs.
References
- J. N. Israelachvili, Intermolecular and Surface Forces, Academic Press, London, 1985 Search PubMed.
- H. Hoffmann, H. Löbl, H. Rehage and I. Wunderlich, Tenside Deterg., 1985, 22, 290–298 CAS.
- H. Rehage and H. Hoffmann, J. Phys. Chem., 1988, 92, 4712–4719 CrossRef CAS.
- H. Hoffmann, in Structure and Flow in Surfactant Solutions, ed. C. A. Herb and R. K. Prud'homme, American Chemical Society, Washington, 1994, pp. 2–31 Search PubMed.
- F. Nettesheim and N. J. Wagner, Langmuir, 2007, 23, 5267–5269 CrossRef CAS PubMed.
- H. Rehage and H. Hoffmann, Mol. Phys., 1991, 74, 933–973 CrossRef CAS.
- T. Shikata, S. J. Dahman and D. S. Pearson, Langmuir, 1994, 10, 3470–3476 CrossRef CAS.
- B. K. Mishra, S. D. Samant, P. Pradhan, S. B. Mishra and C. Manohar, Langmuir, 1993, 9, 894–898 CrossRef CAS.
- S. J. Candau and R. Oda, Colloids Surf., A, 2001, 183, 5–14 CrossRef.
- T. M. Clausen, P. K. Vinson, J. R. Minter, H. T. Davis, Y. Talmon and W. G. Miller, J. Phys. Chem., 1992, 96, 474–484 CrossRef CAS.
- T. S. Davies, A. M. Ketner and S. R. Raghavan, J. Am. Chem. Soc., 2006, 128, 6669–6675 CrossRef CAS PubMed.
- S. R. Raghavan, Langmuir, 2009, 25, 8382–8385 CrossRef CAS PubMed.
- K. Trickett and J. Eastoe, Adv. Colloid Interface Sci., 2008, 144, 66–74 CrossRef CAS PubMed.
- J. Yang, Curr. Opin. Colloid Interface Sci., 2002, 7, 276–281 CrossRef CAS.
- S. Kefi, J. Lee, T. Pope, P. Sullivan, E. Nelson, A. Hernandez, T. Olsen, M. Parlar, B. Powers, A. Roy, A. Wilson and A. Twynam, Oilfield Rev., 2005, 16, 10–23 Search PubMed.
- S. Ezrahi, E. Tuval and A. Aserin, Adv. Colloid Interface Sci., 2006, 128, 77–102 CrossRef PubMed.
- M. F. Torres, J. M. Gonzaléz, M. R. Rojas, A. J. Müller, A. E. Sáez, D. Löf and K. Schillén, J. Colloid Interface Sci., 2007, 307, 221–228 CrossRef CAS PubMed.
- M. R. Rojas, A. J. Müller and A. E. Sáez, J. Colloid Interface Sci., 2008, 326, 221–226 CrossRef CAS PubMed.
- A. J. Müller, M. F. Torres and A. E. Sáez, Langmuir, 2004, 20, 3838–3841 CrossRef.
- H. A. Stone, A. D. Stroock and A. Ajdari, Annu. Rev. Fluid Mech., 2004, 36, 381–411 CrossRef.
- T. M. Squires and S. R. Quake, Rev. Mod. Phys., 2005, 77, 977–1026 CrossRef CAS.
- R. Attia, D. C. Pregibon, P. S. Doyle, J. L. Viovy and D. Bartolo, Lab Chip, 2009, 9, 1213–1218 RSC.
- Y. Zhao, P. Cheung and A. Q. Shen, Adv. Colloid Interface Sci., 2014, 211, 34–46 CrossRef CAS PubMed.
- S. J. Haward and G. H. McKinley, Phys. Rev. E: Stat., Nonlinear, Soft Matter Phys., 2012, 85, 031502 CrossRef PubMed.
- S. J. Haward, T. J. Ober, M. S. N. Oliveira, M. A. Alves and G. H. McKinley, Soft Matter, 2012, 8, 536–555 RSC.
- S. J. Haward, F. J. Galindo-Rosales, P. Ballesta and M. A. Alves, Appl. Phys. Lett., 2014, 104, 124101 Search PubMed.
- C. Masselon, A. Colin and P. D. Olmsted, Phys. Rev. E: Stat., Nonlinear, Soft Matter Phys., 2010, 81, 021502 CrossRef PubMed.
- C. Masselon, J. B. Salmon and A. Colin, Phys. Rev. Lett., 2008, 10, 038301 CrossRef PubMed.
- P. Nghe, G. Degre, P. Tabeling and A. Ajdari, Appl. Phys. Lett., 2008, 93, 204102 CrossRef.
- T. J. Ober, J. Soulages and G. H. McKinley, J. Rheol., 2011, 55, 1127–1159 CrossRef CAS.
- J. A. Pathak and S. D. Hudson, Macromolecules, 2006, 39, 8782–8792 CrossRef CAS.
- C. J. Pipe, T. S. Majmudar and G. H. McKinley, Rheol. Acta, 2008, 47, 621–642 CrossRef CAS.
- C. J. Pipe and G. H. McKinley, Mech. Res. Commun., 2009, 36, 110–120 CrossRef.
- G. Arya and A. Panagiotopoulos, Phys. Rev. Lett., 2005, 95, 188301 CrossRef PubMed.
- G. A. Davies and J. R. Stokes, J. Non-Newtonian Fluid Mech., 2008, 148, 73–87 CrossRef CAS.
- M. Vasudevan, E. Buse, D. L. Lu, H. Krishna, R. Kalyanaraman, A. Q. Shen, B. Khomami and R. Sureshkumar, Nat. Mater., 2010, 9, 436–441 CrossRef CAS PubMed.
- N. Dubash, J. J. Cardiel, P. Cheung and A. Q. Shen, Soft Matter, 2011, 7, 876–879 RSC.
- P. Y. Huang and J. Feng, J. Non-Newtonian Fluid Mech., 1995, 60, 179–198 CrossRef CAS.
- A. H. Shiang, A. Ötekin, J. C. Lin and D. Rockwell, Exp. Fluids, 2000, 28, 128–142 CrossRef CAS.
- S. Kenney, K. Poper, G. Chapagain and G. F. Christopher, Rheol. Acta, 2013, 52, 485–497 CrossRef CAS.
- H. S. Dou and N. Phan-Thien, Chem. Eng. Sci., 2007, 62, 3909–3929 CrossRef CAS.
- V. M. Ribeiro, P. M. Coelho, F. T. Pinho and M. A. Alves, Chem. Eng. Sci., 2014, 111, 364–380 CrossRef CAS.
- P. Cheung, N. Dubash and A. Q. Shen, Soft Matter, 2012, 8, 2304–2309 RSC.
- J. J. Cardiel, A. C. Dohnalkova, N. Dubash, Y. Zhao, P. Cheung and A. Q. Shen, Proc. Natl. Acad. Sci. U. S. A., 2013, 110, E1653–E1660 CrossRef CAS PubMed.
- J. J. Cardiel, Y. Zhao, J.-H. Kim, J.-H. Chung and A. Q. Shen, Carbon, 2014, 80, 203–212 CrossRef CAS.
- L. Campo-Deaño, F. J. Galindo-Rosales, F. T. Pinho, M. A. Alves and M. S. N. Oliveira, Soft Matter, 2012, 8, 6445–6453 RSC.
- R. Cressely and R. Hocquart, Opt. Acta., 1980, 27, 699–711 CrossRef CAS.
- M. D. Chilcott and J. M. Rallison, J. Non-Newtonian Fluid Mech., 1988, 29, 381–432 CrossRef CAS.
- O. G. Harlen, J. M. Rallison and M. D. Chilcott, J. Non-Newtonian Fluid Mech., 1990, 34, 319–349 CrossRef CAS.
- B. Kalpakci, E. E. Klaus, J. L. Duda and R. Nagrajan, Soc. Pet. Eng. J., 1981, 21, 709–720 CrossRef CAS.
- J. Holweg, P. O. Brunn and F. Durst, Proceedings, 4th Europ. Symp. on Enhanced Oil Recovery, DGMK, Hamburg, 1987, pp. 1007–1018 Search PubMed.
- J. Holweg, P. O. Brunn and F. Durst, Progress and Trends in Rheology II, Steinkopff, 1988, pp. 195–197 Search PubMed.
- P. O. Brunn and J. Holweg, J. Non-Newtonian Fluid Mech., 1988, 30, 317–324 CrossRef CAS.
- E. Ruckenstein, P. O. Brunn and J. Holweg, Langmuir, 1988, 4, 350–354 CrossRef CAS.
- P. O. Brunn and J. Holweg, The Flow of Surfactant Solutions Through Porous Media: Universal Laws, Springer, Netherlands, 1990, pp. 78–80 Search PubMed.
- J. Vorwerk and P. Brunn, J. Non-Newtonian Fluid Mech., 1994, 51, 79–95 CrossRef CAS.
- J. P. Rothstein, Rheol. Rev., 2008, 6, 1–46 Search PubMed.
- J. L. Zakin, B. Lu and H. W. Bewersdorff, Rev. Chem. Eng., 1998, 14, 255–320 Search PubMed.
- V. J. Anderson, J. R. A. Pearson and E. S. Boek, Rheol. Rev., 2006, 217–253 CAS.
- A. Jayaraman and A. Belmonte, Phys. Rev. E: Stat., Nonlinear, Soft Matter Phys., 2003, 67, 065301 CrossRef PubMed.
- S. Chen and J. P. Rothstein, J. Non-Newtonian Fluid Mech., 2004, 116, 205–234 CrossRef CAS.
- N. Z. Handzy and A. Belmonte, Phys. Rev. Lett., 2004, 92, 124501 CrossRef PubMed.
- S. J. Haward and J. A. Odell, Rheol. Acta, 2004, 43, 350–363 CrossRef CAS.
- J. A. Odell and S. J. Haward, Rheol. Acta, 2008, 47, 129–137 CrossRef CAS.
- J. R. Gladden and A. Belmonte, Phys. Rev. Lett., 2007, 224501 CrossRef PubMed.
- G. R. Moss and J. P. Rothstein, J. Non-Newtonian Fluid Mech., 2010, 165, 1–13 CrossRef CAS.
- G. R. Moss and J. P. Rothstein, J. Non-Newtonian Fluid Mech., 2010, 165, 1505–1515 CrossRef CAS.
- S. J. Muller, R. G. Larson and E. S. G. Shaqfeh, Rheol. Acta, 1989, 28, 499–503 CrossRef CAS.
- P. Pakdel and G. H. McKinley, Phys. Rev. Lett., 1996, 77, 2459–2462 CrossRef CAS PubMed.
- G. H. McKinley, P. Pakdel and A. Öztekin, J. Non-Newtonian Fluid Mech., 1996, 67, 19–47 CrossRef CAS.
- S. J. Muller, Korea-Aust. Rheol. J., 2008, 20, 117–125 Search PubMed.
- X. Shi, S. Kenney, G. Chapagain and G. F. Christopher, Rheol. Acta, 2015, 54, 805–815 CrossRef CAS.
- F. J. Galindo-Rosales, L. Campo-Deaño, P. C. Sousa, V. M. Ribeiro, M. S. N. Oliveira, M. A. Alves and F. T. Pinho, Exp. Therm. Fluid Sci., 2014, 59, 128–139 CrossRef.
- C.-L. Sun and H.-Y. Huang, Biomicrofluidics, 2016, 10, 011903 Search PubMed.
- Y. Zhao, S. J. Haward and A. Q. Shen, J. Rheol., 2015, 59, 1229–1259 CrossRef CAS.
- B. D. Frounfelker, G. C. Kalur, B. H. Cipriano, D. Danino and S. R. Raghavan, Langmuir, 2009, 25, 167–172 CrossRef CAS PubMed.
- E. Cappelaere, R. Cressely and J. P. Decruppe, Colloids Surf., A, 1995, 104, 353–374 CrossRef CAS.
- E. Cappelaere, J. F. Berret, J. P. Decruppe, R. Cressely and P. Lindner, Phys. Rev. E: Stat. Phys., Plasmas, Fluids, Relat. Interdiscip. Top., 1997, 56, 1869–1878 CrossRef CAS.
- V. M. Entov and E. J. Hinch, J. Non-Newtonian Fluid Mech., 1997, 72, 31–54 CrossRef CAS.
- M. I. Kolte and P. Szabo, J. Rheol., 1999, 43, 609–625 CrossRef CAS.
- S. L. Anna, G. H. McKinley, D. C. Nguyen, T. Sridar, S. J. Muller, J. Huang and D. F. James, J. Rheol., 2001, 45, 83–114 CrossRef CAS.
- G. H. McKinley, R. C. Armstrong and R. A. Brown, Phys. Rev. E: Stat. Phys., Plasmas, Fluids, Relat. Interdiscip. Top., 1993, 344, 265–304 Search PubMed.
- C.-Y. Han and Y.-F. Chao, Rev. Sci. Instrum., 2006, 77, 023107 CrossRef.
- S. Nichols, J. Freudenthal, O. Arteaga and B. Kahr, Polarization: Measurement, Analysis, and Remote Sensing XI, 2014 Search PubMed.
- G. G. Fuller, Optical Rheometry of Complex Fluids, Oxford University Press, New York, 1995 Search PubMed.
- C. D. Meinhart, S. T. Wereley and M. H. B. Gray, Meas. Sci. Technol., 2000, 11, 809–814 CrossRef CAS.
- R. D. Keane and R. J. Adrian, Appl. Sci. Res., 1992, 49, 191–215 CrossRef.
- S. Wereley and L. Gui, Exp. Fluids, 2003, 34, 42–51 CrossRef.
- A. W. Liu, D. E. Bornside, R. C. Armstrong and R. A. Brown, J. Non-Newtonian Fluid Mech., 1998, 77, 153–190 CrossRef CAS.
- M. A. Alves, F. T. Pinho and P. J. Oliveira, J. Non-Newtonian Fluid Mech., 2001, 97, 207–232 CrossRef CAS.
- L. E. Rodd, J. J. Cooper-White, D. V. Boger and G. H. McKinley, J. Non-Newtonian Fluid Mech., 2007, 143, 170–191 CrossRef CAS.
- L. E. Rodd, T. P. Scott, D. V. Boger, J. J. Cooper-White and G. H. McKinley, J. Non-Newtonian Fluid Mech., 2005, 129, 1–22 CrossRef CAS.
- S. J. Haward, Z. Li, D. Lighter, B. Thomas, J. A. Odell and X.-F. Yuan, J. Non-Newtonian Fluid Mech., 2010, 165, 1654–1669 CrossRef CAS.
- T. J. Ober, S. J. Haward, C. J. Pipe, J. Soulages and G. H. McKinley, Rheol. Acta, 2013, 52, 529–546 CrossRef CAS.
- N. Dubash, P. Cheung and A. Q. Shen, Soft Matter, 2012, 8, 5847–5856 RSC.
- A. Lyazid, O. Scrivener and R. Teitgen, in Rheology Volume 2: Fluids, ed. G. Astarita, G. Marruci and L. Nicolais, Plenum, New York, 1980, pp. 141–148 Search PubMed.
- K. Gardner, E. R. Pike, M. J. Miles, A. Keller and K. Tanaka, Polymer, 1982, 23, 1435–1442 CrossRef CAS.
- S. J. Haward, J. A. Odell, Z. Li and X.-F. Yuan, Rheol. Acta, 2010, 49, 633–645 CrossRef CAS.
- S. J. Haward, J. A. Odell, Z. Li and X.-F. Yuan, Rheol. Acta, 2010, 49, 781–788 CrossRef CAS.
- D. L. Lu, J. J. Cardiel, G. Z. Cao and A. Q. Shen, Adv. Mater., 2010, 22, 2809–2813 CrossRef CAS PubMed.
- J. J. Cardiel, Y. Zhao, L. Tonggu, L. Wang, J.-H. Chung and A. Q. Shen, Lab Chip, 2014, 14, 3912–3916 RSC.
Footnote |
| † Electronic supplementary information (ESI) available: Movies showing streak imaging performed over a range of Wi for the wormlike micellar test fluid in each of the three experimental flow devices. See DOI: 10.1039/c6sm01597b |
| This journal is © The Royal Society of Chemistry 2016 |

