
 Open Access Article
 This Open Access Article is licensed under a
 Creative Commons Attribution 3.0 Unported Licence
Bacterial swarmer cells in confinement: a mesoscale hydrodynamic simulation study†
Thomas
Eisenstecken
a,
Jinglei
Hu
ab and
Roland G.
Winkler
a
aTheoretical Soft Matter and Biophysics, Institute for Advanced Simulation and Institute of Complex Systems, Forschungszentrum Jülich, D-52425 Jülich, Germany. E-mail: t.eisenstecken@fz-juelich.de; r.winkler@fz-juelich.de
bKuang Yaming Honors School, Nanjing University, 210023 Nanjing, China. E-mail: hujinglei@nju.edu.cn
First published on 14th September 2016
Abstract
A wide spectrum of Peritrichous bacteria undergo considerable physiological changes when they are inoculated onto nutrition-rich surfaces and exhibit a rapid and collective migration denoted as swarming. Thereby, the length of such swarmer cells and their number of flagella increases substantially. In this article, we investigated the properties of individual E. coli-type swarmer cells confined between two parallel walls via mesoscale hydrodynamic simulations, combining molecular dynamics simulations of the swarmer cell with the multiparticle particle collision dynamics approach for the embedding fluid. E. coli-type swarmer cells are three-times longer than their planktonic counter parts, but their flagella density is comparable. By varying the wall separation, we analyze the confinement effect on the flagella arrangement, on the distribution of cells in the gap between the walls, and on the cell dynamics. We find only a weak dependence of confinement on the bundle structure and dynamics. The distribution of cells in the gap changes from a geometry-dominated behavior for very narrow to fluid-dominated behavior for wider gaps, where cells are preferentially located in the gap center for narrower gaps and stay preferentially next to one of the walls for wider gaps. Dynamically, the cells exhibit a wide spectrum of migration behaviors, depending on their flagella bundle arrangement, and ranges from straight swimming to wall rolling.
1 Introduction
Many motile bacteria are propelled by helical filaments, which protrude from their cell body and are driven by rotary motors located in the cell membrane.1–4 Thereby, such bacteria exhibit different modes of locomotion, depending on the environment. In liquid environments, individual (planktonic) cells exhibit the so-called swimming motility.5–8 The various flagella of peritrichous bacteria self-organize into bundles by (typically) counterclockwise rotation of the flagella motors. This leads to nearly straight swimming in bulk fluids and circular motion near walls.9–12 To change the swimming direction, this “running” phase is interrupted by short periods of “tumbling”.1,13–22 The sequence of run-and-tumble events can be adjusted by chemotaxis, i.e., in response to changes in chemical concentrations.7Another mode of motion is denoted as bacterial swarming, where flagellated bacteria migrate collectively over surfaces and are able to form stable aggregates, which can become highly motile.5–8,23 Swarming bacteria show a strikingly different motile behavior than swimming cells. They are densely packed and exhibit large-scale swirling and streaming motions. Some bacteria strains show distinctly different morphologies in the swarming mode compared to the swimmer cells as they are more elongated by suppression of cell division and their number of flagella is significantly increased.6,7,24–27 This points toward the significance of flagella for swarming. E. coli and Salmonella bacteria more than double their length and increase the number of flagella, but the flagellar density remains approximately constant.6,28–31 The changes for P. mirabilis are even more dramatic, their length increases 10 to 50 times and an increase of their flagella number from fewer than 10 to 5000 has been reported.26,27,32 As stated in ref. 6, neither is the reason known why swarming requires multiple flagella nor why a significant cell elongation is required for many bacteria. Aside from a possible amplification of swarming by shape-induced alignment of adjacent cells, elongation associated with the increase in the number of flagella may help to overcome wall friction.29
This brief list already indicates that very little is known about the locomotion of swarming bacteria and their interactions. To the best of our knowledge, no theoretical study of individual swarmer cells has be performed so far, even less their collective behavior. The reason is twofold. On the hand, an adequate model of a multi-flagellated bacteria is required. On the other hand, hydrodynamic interactions have to be taken into account. The complexity of the propulsion mechanism with bundle formation of flagella, especially near-field hydrodynamics, poses substantial challenges for simulations.12,20,21 Both aspects are demanding in terms of computational resources and require the simulation of large systems.
In this article, we adopt a mesoscale hydrodynamic simulation approach to study the properties of a individual swarmer cell in thin films as a first step to unravel their specific motility properties during swarming. We extent our previous bacterium model,33 which closely resembles the geometry, flagellar elastic properties, and rotary motor torque of E. coli to a multi-flagellated swarmer cell. The fluid is modelled by the multiparticle collision dynamics (MPC) method, a particle-based simulation approach taking into account hydrodynamic interactions and thermal fluctuations.34–36 The MPC method has proven to be very valuable for the studies of active systems.12,33,35,37–48 Specifically, MPC has successfully been applied to elucidate synchronization between the flagella beating of nearby swimming sperm,49 bundling of helical flagella of bacteria,20,21 and swimming of bacteria near walls.12
Our E. coli-type swarmer cell is three times longer than a planktonic cell and is covered with 25 flagella. We consider various realizations with randomly arranged flagella, and find, in general, rather heterogeneous properties. One of our goals is to shed light on the organization of the flagella into bundles. We find that the majority of flagella self-organize into a major bundle, essentially independent of the extend of confinement. The bundle and the cell body exhibit a pronounced angle for most surfaces separations. Such a structure has already be seen experimentally for a planktonic E. coli cell.14 In very narrow slits, the distribution of cells strongly depends on their bundle arrangement, and cells may preferential be very close to the walls. For slightly wider gaps, the configuration with cells in the center between the walls is preferred, and for very wide gaps, cells migrate preferentially along one wall. Most cells move essentially in a straight manner in narrow gaps. Some cells exhibit a more complicated dynamics in wide gaps and roll over a wall.
An important conclusion of our studies is that the considered type of swarmer cell is rather similar to a swimmer cell as far as the flagella bundle characteristics and migration behavior of individual cells is concerned. Of course, such E. coli-type swarmer cells exhibit swarming at surfaces. However, they lack specificities of long swarmer cells such as multiple bundles as indicated in the images of ref. 24 and 25. We expect that such multiple bundles will give rise to additional collective effects, with qualitative and quantitative differences to the (short) considered swarmer cell.
2 Model of swarmer and fluid
2.1 Swarmer model
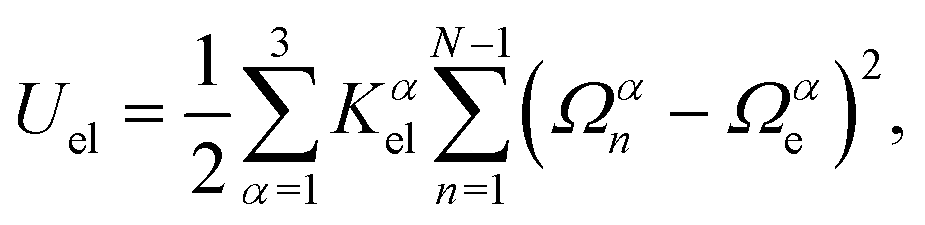
We use an extension of the bacteria model described in ref. 12 and 33. The swarmer cell is composed of a spherocylindrical body and attached flagellar filaments, as illustrated in Fig. 1. Both, the body and the flagella are constructed by connected mass points of mass M. The spherocylinder consists of circular sections, each with a center particle and uniformly distributed particles on its circumference. The larger circles comprise 30 particles, whereas the smaller ones toward the poles consist of 15 and 5 particles, respectively. In order to maintain the shape of the body, nearest- and next-nearest-neighboring pairs of particles are connected by a harmonic potential of the form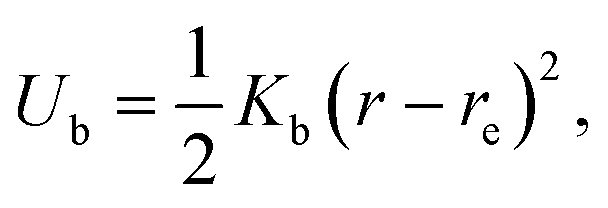 | (1) |
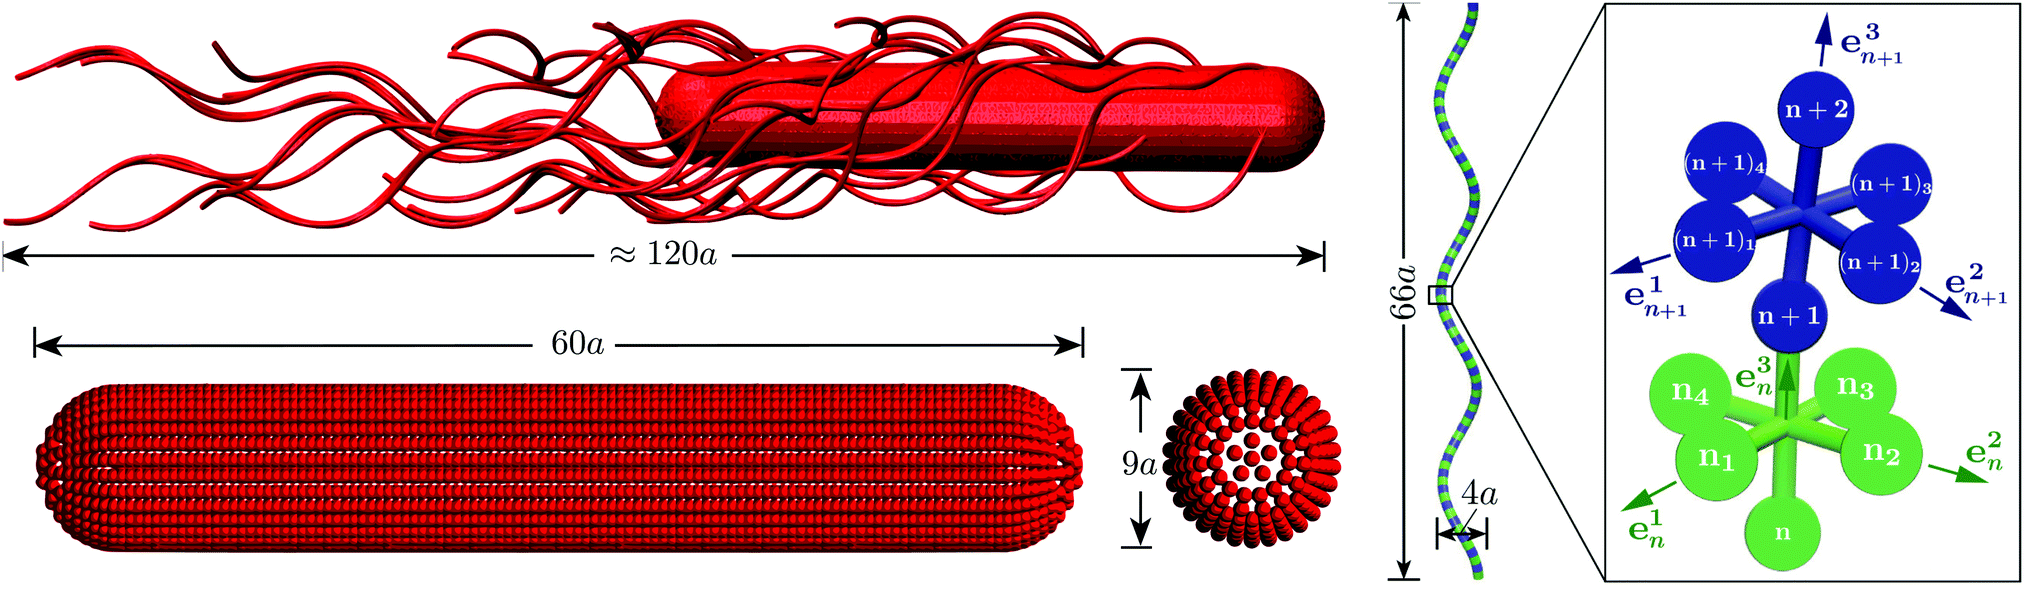 | ||
| Fig. 1 Model of the spherocylindrical cell body and the three-turn left-handed flagella. The cell body is three times longer than that of a swimmer cell. The anchoring points of the 25 flagella on the body surface are randomly chosen. The flagellum, a three-turn left-handed helix, consists of 76 consecutive segments. In each segment, six particles are arranged in an octahedron.33 | ||
A flagellum is described by the helical wormlike chain model,50–52 with an adaptation suitable for the combination with MPC.33 As shown in Fig. 1, a helical flagellum consists of NF = 76 octahedron-like segments with a total of 381 particles. In each segment, six particles are arranged in an octahedron of edge length  , forming 12 bonds along the edges and three along the diagonals, where a is the unit length of the MPC fluid as described in Section 2.2. The preferred bond lengths are
  for edges and re = a for diagonals. This construction allows for a straightforward description of the intrinsic twist of a flagellum and a coupling of the twist to the forces exerted by the MPC fluid.
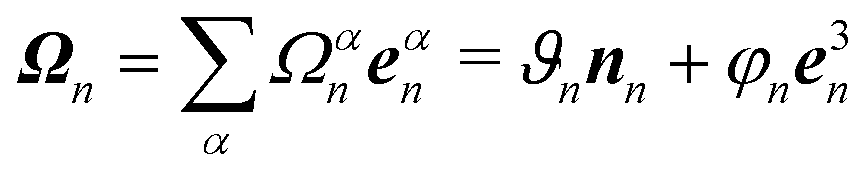
The bond vectors b3n = rn+1 − rn (n = 1,…,NF) specify the backbone of the flagellum, and, together with b1n = rn1 − rn3 and b2n = rn2 − rn4, define orthonormal triads {e1n,e2n,e3n}, where eαn = bαn/|bαn|, α ∈ {1, 2, 3}. Here, rn denotes the position of the backbone particle n, and the rnk (k = 1, 2, 3, 4) refer to the positions of the particles in the plane with the normal e3n (cf.Fig. 1).
The local elastic deformation of a flagellum is characterized by the transport of the triad {e1n,e2n,e3n} to {e1n+1,e2n+1,e3n+1} along the helix.51 This process is performed in two steps: (i) the rotation of {e1n,e2n,e3n} around e3n by a twist angle φn, and (ii) the rotation of the twisted triad {ẽ1n,ẽ2n,ẽ3n} by a bending angle ϑn around the unit vector nn = (e3n × e3n+1)/|e3n × e3n+1| normal to the plane defined by the contour bonds b3n and b3n+1. The corresponding elastic deformation energy is
 | (2) |
 the strain vector. The parameters Ωαe define the equilibrium geometry of the model flagellum and are chosen to recover the shape of an E. coli flagellum in the normal state, i.e., a three-turn left-handed helix.14
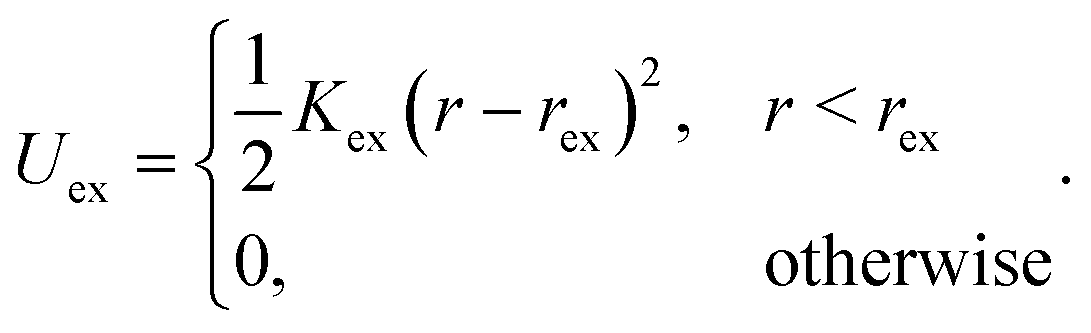
We do not explicitly model the hook connecting a flagellum with the cell body of a bacterium,15 but rather directly attach a flagellum to the cell body by choosing a body particle as its first contour particle (n = 1, see Fig. 1 for notation). To induce rotation of the flagellum, a motor torque T is applied, which is decomposed into a force couple F and −F acting on particles 12 and 14 (T = b21 × F with F antiparallel to b11), or equivalently 11 and 13 (T = b11 × F with F parallel to b21). Hence, the bacterium is force free. To ensure that the bacterium is also torque-free, an opposite torque −T is applied to the body. Penetration of a flagellum into the cell body and crossing of flagella is prevented by the harmonic repulsive potential
 | (3) |
The dynamics of the bacterium is described by Newton's equations of motion with the forces resulting from the potentials of eqn (1)–(3) and the “external” forces for generating the torques T and −T.
2.2 Fluid: multiparticle collision dynamics
In MPC, the fluid is described by N point particles of mass m with continuous positions ri and velocities vi (i = 1,…,N), which interact with each other by a stochastic, momentum-conserving process. The particle dynamics proceeds in a sequence of streaming and collision steps. In the ballistic streaming step, the particle positions are updated according to| ri(t + h) = ri(t) + hvi(t), | (4) |
 | (5) |
 | (6) |
Since the MPC algorithm is highly parallel, we exploit a graphics processor unit (GPU)-based version of the simulation code, which yields a high performance gain.60
2.3 Coupling of bacterium and MPC fluid
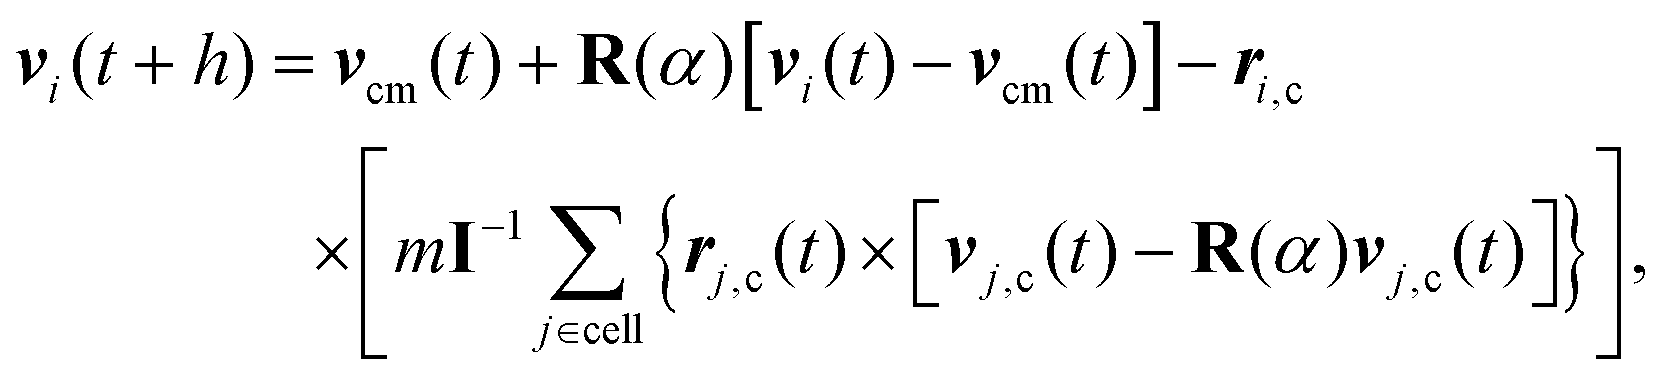
The coupling between the MPC particles and the mass points of the bacterium body and flagella is efficiently achieved in the MPC collision step.61–63 Thereby, the cell points are treated on equal footing with the MPC particles, i.e., their velocities are also rotated according eqn (5) to ensure momentum exchange between them and the fluid. The center-of-mass velocity of a collision cell containing mass points of a cell is now given by | (7) |
2.4 Wall interactions
Our swarmer cells are confined between two walls, which are parallel to the xz-plane and separated by a distance H (cf.Fig. 2). Various wall separations are considered, ranging from H/a = 20 to H/a = 120, or in units of body length from H/lb = 1/3 to H/lb = 2. No-slip boundary conditions are applied for the MPC fluid at the walls by implementing the bounce-back rule and taking into account phantom particles in the walls.59,64 The mass points of a cell experience the reflecting Lennard-Jones potential (wall at y = 0)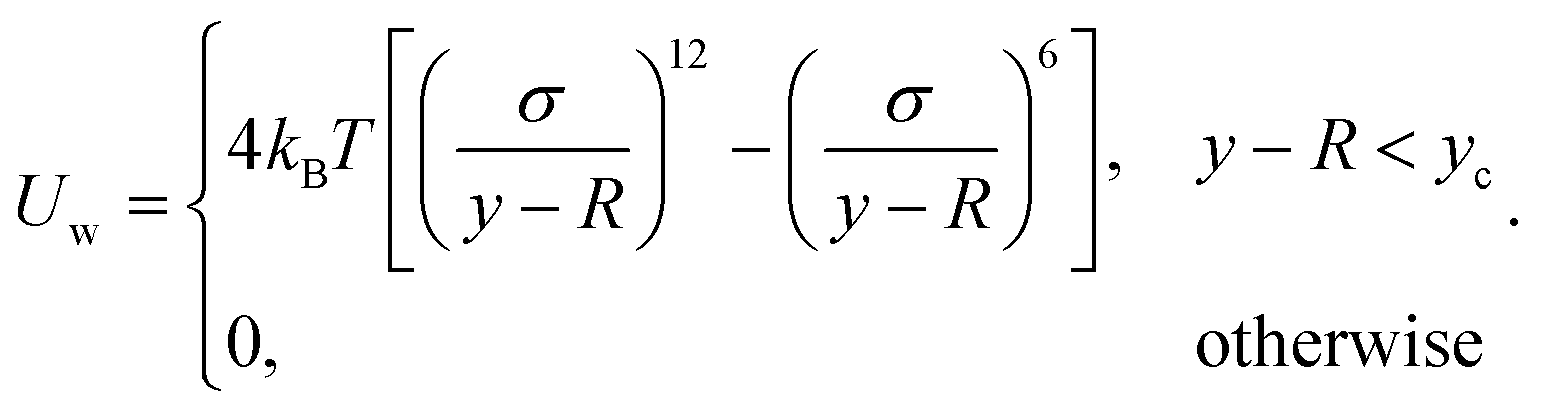 | (8) |
 .
.
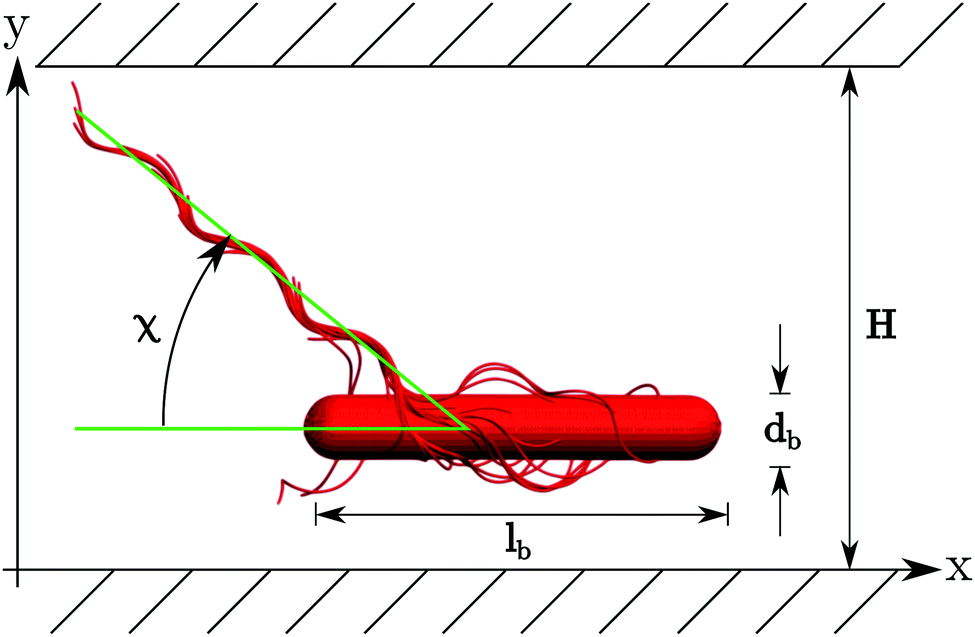 | ||
| Fig. 2 Illustration of the simulation set-up. A swarmer cell is confined between two walls parallel to the xz-plane separated by H. | ||
Initially, cells with randomly oriented and randomly anchored flagella are placed in the narrowest channel and are partially equilibrated until a loose bundle is formed as exemplified in Fig. 1; in total, we consider 11 distinct realizations. These structures are utilized for the studies of all gap widths, where the swarmer cells are further equilibrated with different starting velocities of the swarmer and fluid particles. Thereby, only one of the walls is displaced, i.e., the cells are initially close to one of the walls. In general, we find a significant heterogeneity in the appearing structures and the dynamical properties of individual cells. This is consistent with experimental observations of the properties of E. coli bacteria.14,65
2.5 Parameters
We choose K1el = K2el = K3el = 5 × 10⁴kBT, corresponding to a bending stiffness of 2 × 10⁻²³ N m2 for flagellar filaments within the experimental range of about 10−24–10−21 N m2.14,33,51,66,67 Moreover, we set |T| = 400kBT < 1000kBT ≃ 4100 pN nm,12,33 a torque smaller than the stall torque of approximately 4500 pN nm of the flagellar motor of E. coli.68The cell body is composed of 121 circles with a circle–circle separation of a/2. Hence, its total length is 60a and it comprises 3625 mass points. A flagellum contains NF = 76 octahedron-like segments with the back-bone bond length a, which yields the contour length 76a. With the pitch angle 30°, the effective length is approximately 66a. In total, a cell contains 13![[thin space (1/6-em)]](https://www.rsc.org/images/entities/char_2009.gif) 125 particles.
125 particles.
The force constants in eqn (1) and (3) are set to Kb = Kex = 104kBT/a2.
The length a of a collision cell, the mass m of a MPC particle, and the thermal energy kBT define the length, mass, and energy units in our simulations, which yields the unit of time  . We choose the collision time step h = 0.05τ and average number of fluid particles in a collision cell 〈Nc〉 = 10, which corresponds to the fluid viscosity
  and the Schmidt number Sc = 20.69 Newton's equations of motion for the bacterium model are integrated with the time step h/25 using the velocity-Verlet algorithm. The Reynolds number Re = lbm〈Nc〉v/η < 0.1 for the considered body length and velocities (cf.Fig. 8). Parallel to the walls (cf.Fig. 2), periodic boundary conditions are applied with the box length 160a, which corresponds to N = 3.072 × 10⁷ fluid particles for H/a = 120.
3 Results – flagella bundle
3.1 Bundle structure
Hydrodynamic interactions lead to synchronization of the flagella rotation and bundle formation. This aspect of swimming bacteria has been studied in ref. 20–22. As is evident from the snapshots of Fig. 3, our swarmer cells with, in comparison to swimmers,33 the markedly longer bodies and significantly larger number of flagella also form flagella bundles. Interestingly, typically the majority of flagella are assembled in a major bundle and only a very few individual flagella or bundles of a few flagella are present. As displayed in Fig. 4, the number of flagella Nf in a bundle depends only weakly on the wall separation. With increasing wall separation, only a minor reorganization of the flagella bundle and the number of participating flagella occurs. In the particular case Nf = 17, three bundles are formed (cf.Fig. 3), where the number of flagella in the two low-flagella-number bundles fluctuates, but the major bundle is rather stable.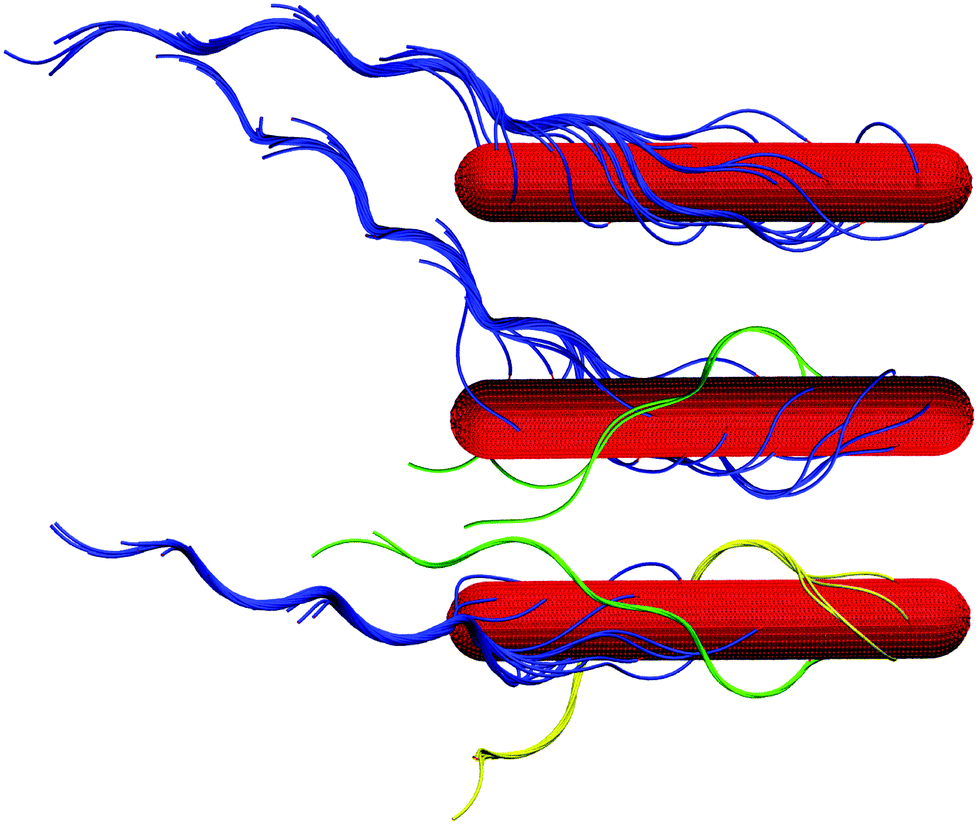 | ||
| Fig. 3 Illustration of cells confined in slits of widths H/a = 20 (top) and H/a = 120 (middle, bottom). (top) All flagella are included in a single bundle, (middle, bottom) two and three bundles are formed, respectively. (bottom) The major bundle of 17 flagella is rather stable for all Hs as shown in Fig. 4. | ||
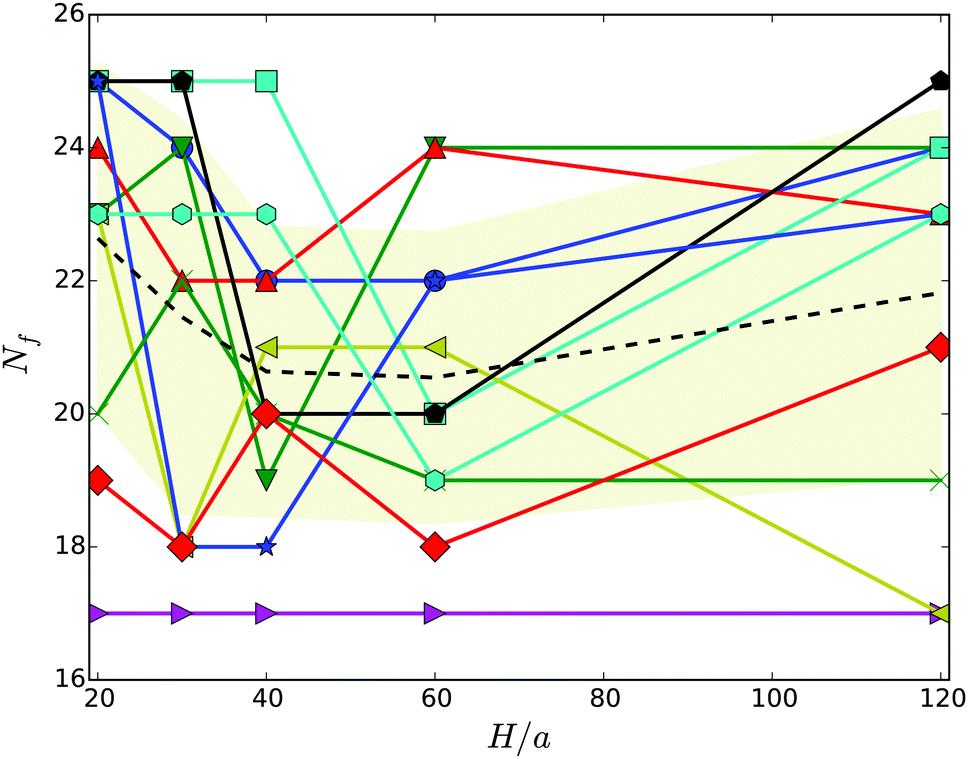 | ||
| Fig. 4 Number of flagella in the major bundle for various wall separations. The dashed line indicates the average over the various realizations labeled by different symbols, and the shaded area the standard deviation. | ||
The snapshots of Fig. 3 indicate a certain preferred orientation between the cell body and the flagella bundle. Similarly, the images of ref. 14 suggest such an arrangement of the flagella bundle of swimming E. coli cells. We characterize this orientation by calculating the angle χ between the major axis of the body and the major axis of the moment-of-inertia tensor of the flagella bundle (cf.Fig. 2). Fig. 5 displays χ as a function of the wall separation. Noteworthy, we find a large variation between the various realizations with the same arrangement of flagella on the cell surface, but different initial distributions of velocities, as well as the various gap widths. We like to emphasize that the variation is not a consequence of insufficient equilibration or sampling. For every individual presented average, the angle χ, as a function of time, moderately fluctuates around a straight line of slope zero and a standard deviation below ±2.5°. Only for the narrowest gap, the fluctuations are approximately one degree larger by confinement-induced additional forces. Our studies emphasize that the large variations observed in Fig. 5 are an intrinsic property of self-propelled systems. Evidently, strong confinement implies a small angle and wall interactions force a more parallel alignment of the body and bundle (cf.Fig. 3). For less confined cells, the angle increases with increasing H and saturates at an H-independent value for H/a > 40. The latter average is almost twice larger than the average of χ in the narrowest gap.
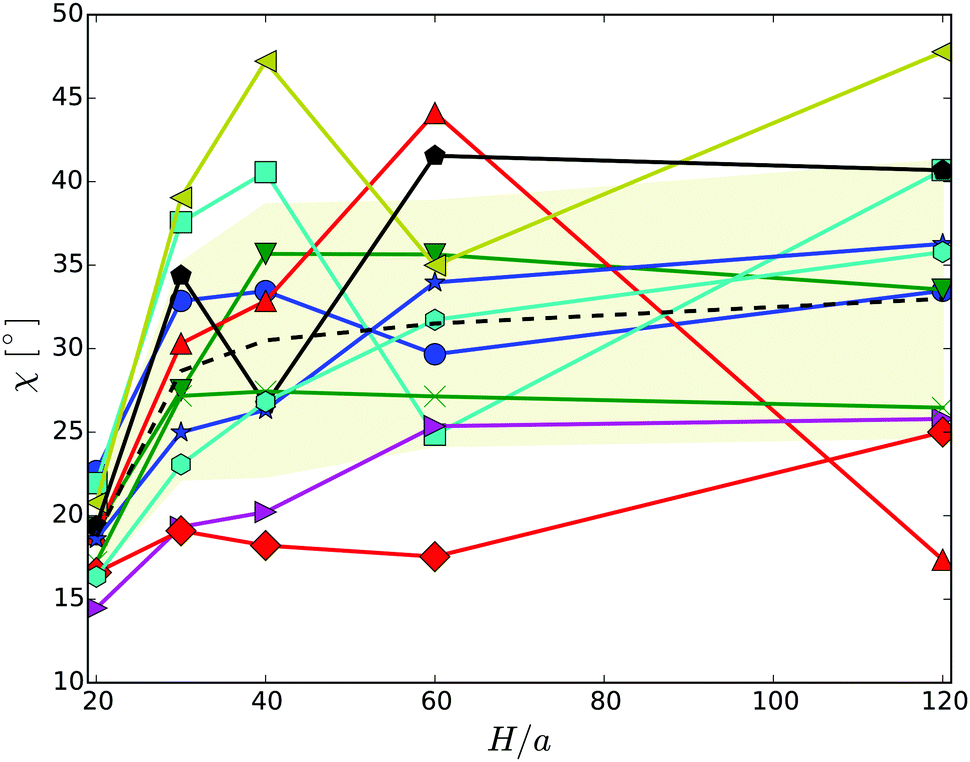 | ||
| Fig. 5 Angle between the cell-body and the bundle major axis. The dashed line indicates the average over the various realizations labeled by symbols. The symbols and colors are the same as in Fig. 4. | ||
3.2 Body and bundle rotation
The body-bundle arrangement strongly affects the rotational motion of the cell body. The latter is a consequence of the fact that the cell is torque free, i.e., the induced rotation of the flagella implies the well-known counter rotation of the cell body.14 We determine the rotation frequency ωb of the cell body via the relation Lb = Θbωb, where the angular momentum Lb of the body and its moment of inertia tensor Θb are given by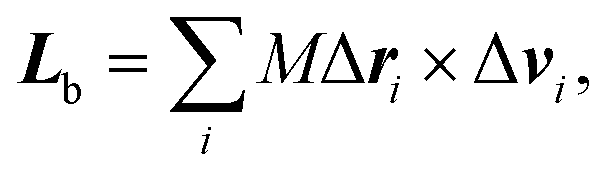 | (9) |
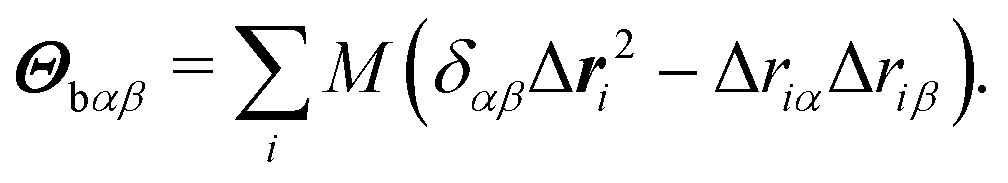 | (10) |
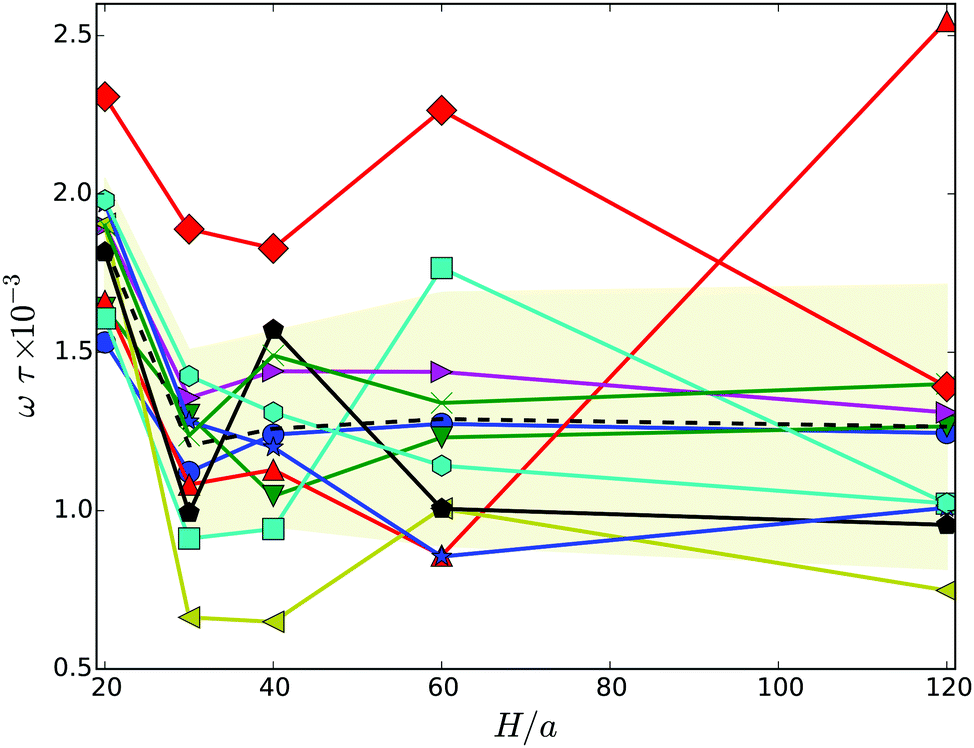 | ||
| Fig. 6 Body rotation frequency projected onto the major axis of the cell as a function of the wall separation. The dashed line indicates the average over the various realizations labeled by symbols. The symbols and colors are the same as in Fig. 4. | ||
As expected, the ω values are strongly linked with the body-bundle angle χ – an increase of χ causes a decrease of ω. In a straight configuration of the body and the bundle, both (counter) rotate essentially around the major axis of the body. An increase of the angle χ implies an additional rotation, a wobbling motion, of the whole cell around an oblique axis none aligned with e, hence, ω is smaller.
4 Results – swarmer distribution between walls
Fig. 7 shows distribution functions P(y) of the center-of-mass position of the cell body between the two walls. They are normalized such that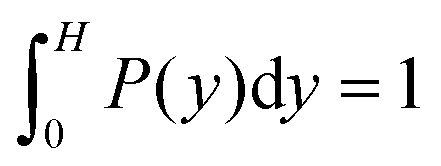 . In the narrowest gap H/a = 20, the distributions are symmetric with respect to the gap center, however, P(y) varies substantially between the various realizations. Note that the length of the cell body is lb/a = 60 and its diameter is db/a = 9. Cells with small angles χ exhibit a major peak in the center between the walls. With increasing angles, two off-center peaks appear, and for large χ off-center peaks close to the walls develop together with a central peak. The realization labeled by the yellow ◀ symbol shows an even more distinct distribution, although the differences in the flagella arrangement is a priori not evident. At H/a = 30, the cells are mainly concentrated in the gap center (Fig. 7(b)). Still, there are realizations, which prefer walls, giving rise to off-center peaks. In the infinite time limit, symmetric distributions are expected and will occur. Since we are able to only average over a limited time, the present asymmetry in the distributions reflects particular long-lived structures.
 | ||
| Fig. 7 Distribution functions of the center-of-mass position of cell bodies for various realizations and the wall separations (a) H/a = 20 or H/lb = 1/3, (b) H/a = 30 or H/lb = 1/2, and (c) H/a = 120 or H/lb = 2. The symbols and colors are the same as in Fig. 4. | ||
The swarmer cells in a gap of width H/a = 120, i.e., H/lb = 2, reveal a preference to reside near a wall for a long time. The cells are preferentially located within a layer of half a body length adjacent to the wall, or approximately three body diameters. Although, the cells are initially close to the wall, the simulation time is long enough such that the cells could diffuse a larger distance. Considering the time dependence of the cell height above the wall, only the cell furthest apart from the wall (cyan hexagons) exhibits a trend to move away from the wall. The other realizations are rather stable over the considered time range, again, indicating long-lived structures. The actual alignment between body and bundle seems to be of minor importance for the attachment close to the wall. By calculating the angle between the cell-orientation vector and the surface normal, we find that the cells are preferentially oriented toward the nearby wall during the simulations, with average angles in the range −2° to −10°. In the stationary state, the distribution functions will be symmetric with respect to the center of the gap, with equal probability to find the cells next to either of the walls. To reach this state is far beyond current computer simulations capabilities, when rather detailed cell models are used as in our study. Nevertheless, our simulations shed light onto temporarily stable and long-lived behaviors.
The preference to stay close to a wall is attributed to hydrodynamic interactions.12,31,48,70–75 A reduction of the wall separation leads to an overlap of the effective attraction of the two walls, which implies a preference of the cells to stay in the center of the gap. This has already been observed in theoretical calculations73 and experiments.31 The theoretical considerations in ref. 73 of monotrichous cells with well-aligned cell body and flagellum (χ = 0) show a crossover from single-wall behavior of cells in gaps of width H/lb ≈ 4 to a preference in the gap center for H/lb < 1. The theory predicts stable fixed points in front of the walls for large wall separations.73 These fix points become unstable at small wall separations and an initially unstable fixed point in the gap center becomes stable. Similarly, the experiments of ref. 31 indicate a stable position in the gap center for H/lb < 1. Our simulation results are qualitatively consistent with these findings. However, we predict a certain influence of the flagella bundle arrangement on the preferred location in the gap as long as the gap width is comparable to the cell diameter. Aside from hydrodynamic interactions, steric interactions between a cell and the walls matter. This is particularly pronounced for very narrow gaps as shown in Fig. 7(a).
5 Results – swarmer dynamics
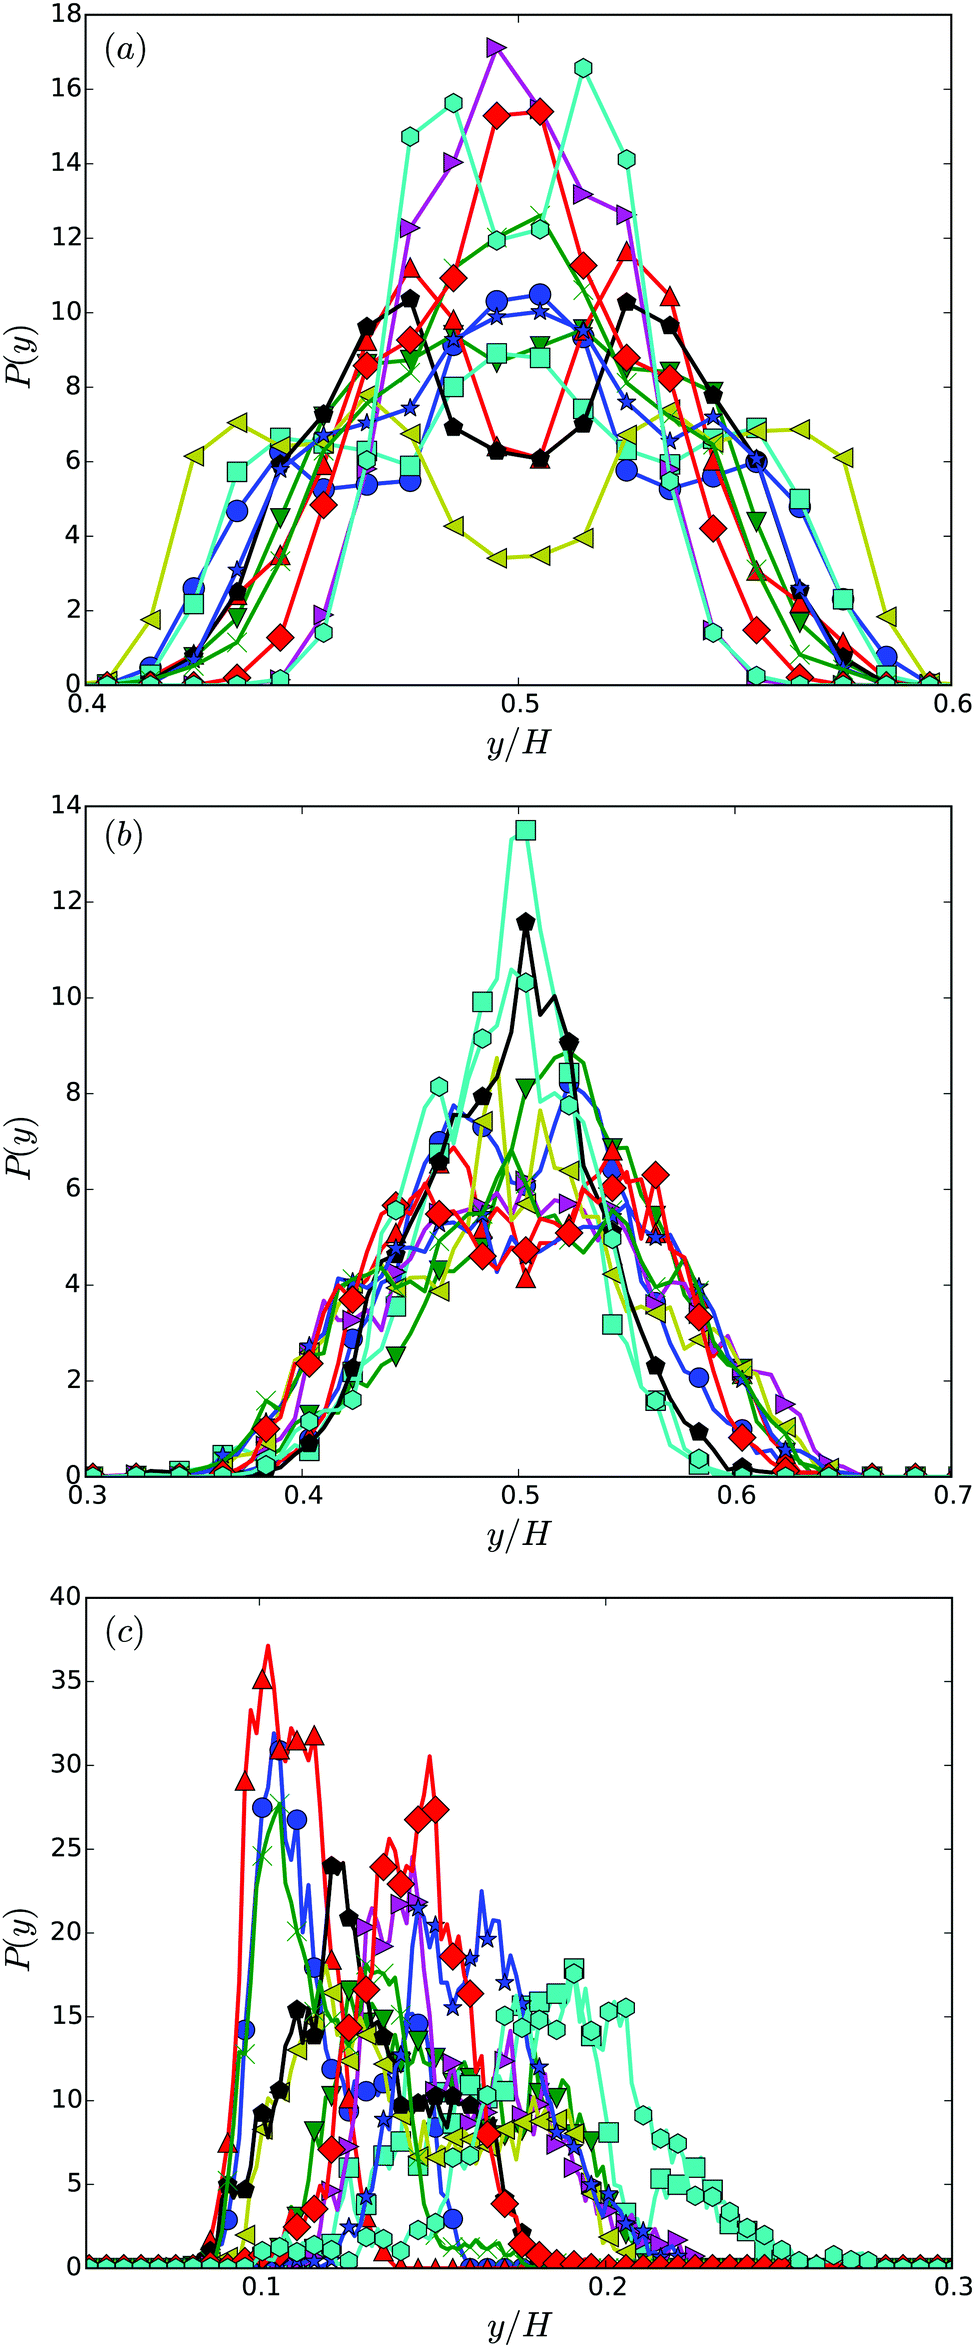
To characterize the motility of the cells, we calculate their migration velocity v and the their mean square displacement. The instantaneous velocity v(t) is defined as follows. We calculate the displacement Δrb(t) = rb(t + Δt) − rb(t) of the center of mass of the body for the lack time Δt. Dividing by Δt yields the velocity vb(t). We then project this velocity onto the major axis of the inertia tensor of the whole cell, i.e., v = vb·e. Results of the average velocity v for the various gap widths are displayed in Fig. 8. Obviously, the velocity decreases with increasing wall separation until a virtually H independent value is assumed for H/a ≳ 60. Thereby, cells in wider gaps are on average by a factor of three slower than strongly confined cells. This can partially be attributed to the body-bundle orientation, especially for H/a = 20, but for wider gaps, the angle χ is nearly constant whereas v decreases further. Hence, the change in velocity seems to be related to wall-cell hydrodynamic effects. | ||
| Fig. 8 Migration velocity of swarmer cells confined between two walls for various realizations. The dashed line indicates the average over the various realizations labeled by symbols. The symbols and colors are the same as in Fig. 4. | ||
The migration velocity depends not only on the extend of confinement, but also on the body size. This is illustrated in Fig. 9. Note, in Fig. 9, the flagella density is smaller than in the other studies presented in the article. The dependence of the migration velocity on the flagella number remains to be studied. Evidently, the velocity decreases significantly with increasing body length and assumes rather small values for long cells. The error bar indicates that even backwards-swimming realization appear. In general, the decrease of the velocity v with increasing body length in narrow slits is similar to the behavior of such cells in bulk fluids. The initial linear decrease of the velocity v is consistent with theoretical expectations based on resistive force theory.48,65,76–79 Here, the friction of the cell body dominates the resistance in the migration and, hence, v ∼ 1/lb. However, this is in contrast to experimental results, where the mean speed of a planktonic E. coli cell is comparable to that of an elongated planktonic cell.31 Our simulations predict a factor of three larger migration velocity of planktonic cells. The reason of this large discrepancy between experiment and simulation is not evident and needs to be further studied. However, obviously a stronger torque of the molecular motors exerted on a flagellum with a respective higher flagellum rotation frequency would lead to a faster mean speed. It needs to be clarified whether flagella in swarmer or elongated planktonic cells exhibit such an increased rotation frequency.
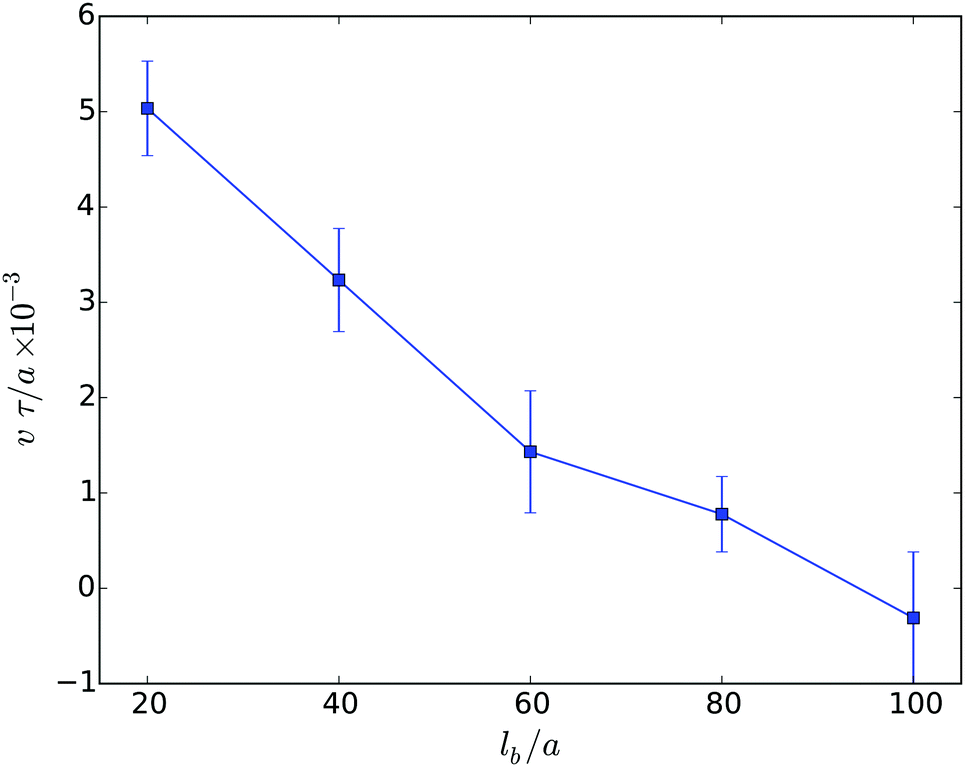 | ||
| Fig. 9 Migration velocities of swarmer cells confined between two walls of separation H/a = 20 as function of their body length. The number of flagella increases linearly with lb starting from Nf = 4 for lb/a = 20 to Nf = 20 for lb/a = 100. | ||
The mean square displacement (MSD) of the center of mass of the cell body is presented in Fig. 10. For a given wall separation, two regimes can be identified. At short times t/τ ≲ 103, the MSD increases in a superdiffusive manner as t1.6 mainly due to the inertia of the cell, i.e., activity affects the dynamic only slightly in this time regime. Thereby, there is little variation between the various gap widths. When the cell displacement, the square root of the MSD, reaches approximately a cell diameter at t/τ ≈ 2 × 10³, the MSD assumes a plateau-like value. This behavior is attributed to the wobbling motion of the cell body. While for the very narrow gap, wobbling is suppressed by steric interactions with the surfaces, it is well pronounced for wider gaps. The wobbling motion is illustrated in the simulation animations S1 and S2 of the ESI.†
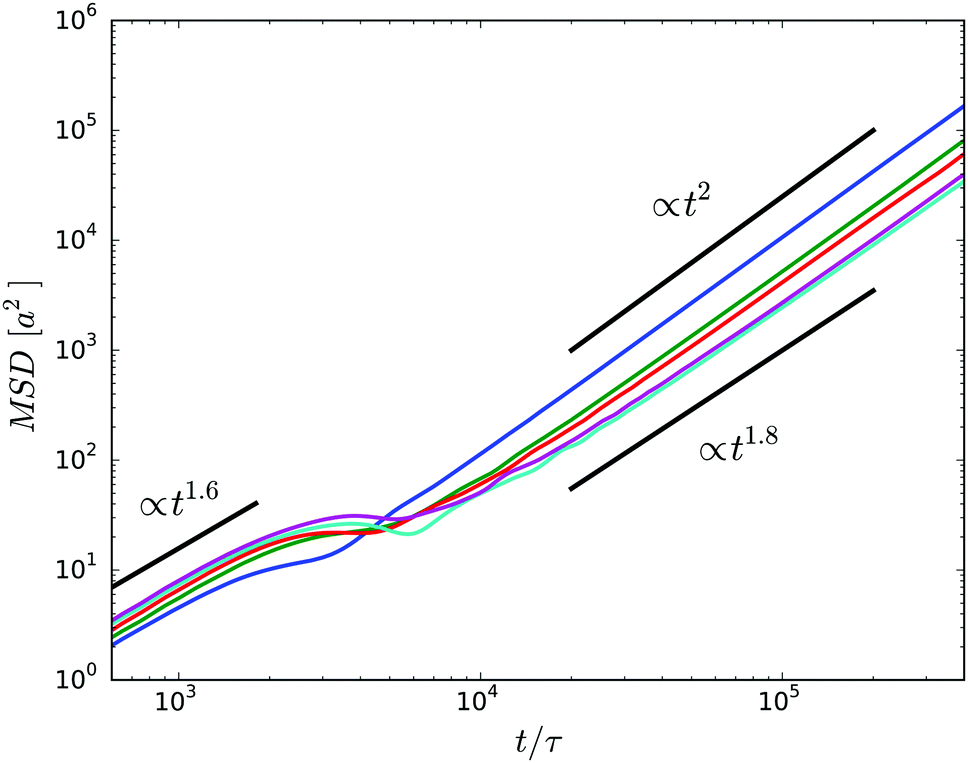 | ||
| Fig. 10 Mean square displacements of the center of mass of the body for cells confined in gaps of widths H/a = 20 (blue), H/a = 30 (green), H/a = 40 (red), H/a = 60 (cyan), and H/a = 120 (purple). | ||
At times longer than about t/τ = 104, another superdiffusive regime is assumed. In particular, the cells confined in the narrowest gap exhibit a ballistic motion. This is related to rather straight trajectories of the individual cells (cf.Fig. 11). For the wider gaps, the MSD increases somewhat slower, but it is close to ballistic motion. The smaller exponent points toward a modified migration behavior of the cells, possibly by curved trajectories or other types of migration behavior. In general, however, there are seemingly only minor qualitative differences between the various slit widths over the considered range of displacements on the order of 5lb. In the asymptotic limit t → ∞, we expect that the cells exhibit a diffusive motion. However, to reach this regime requires much longer simulations.
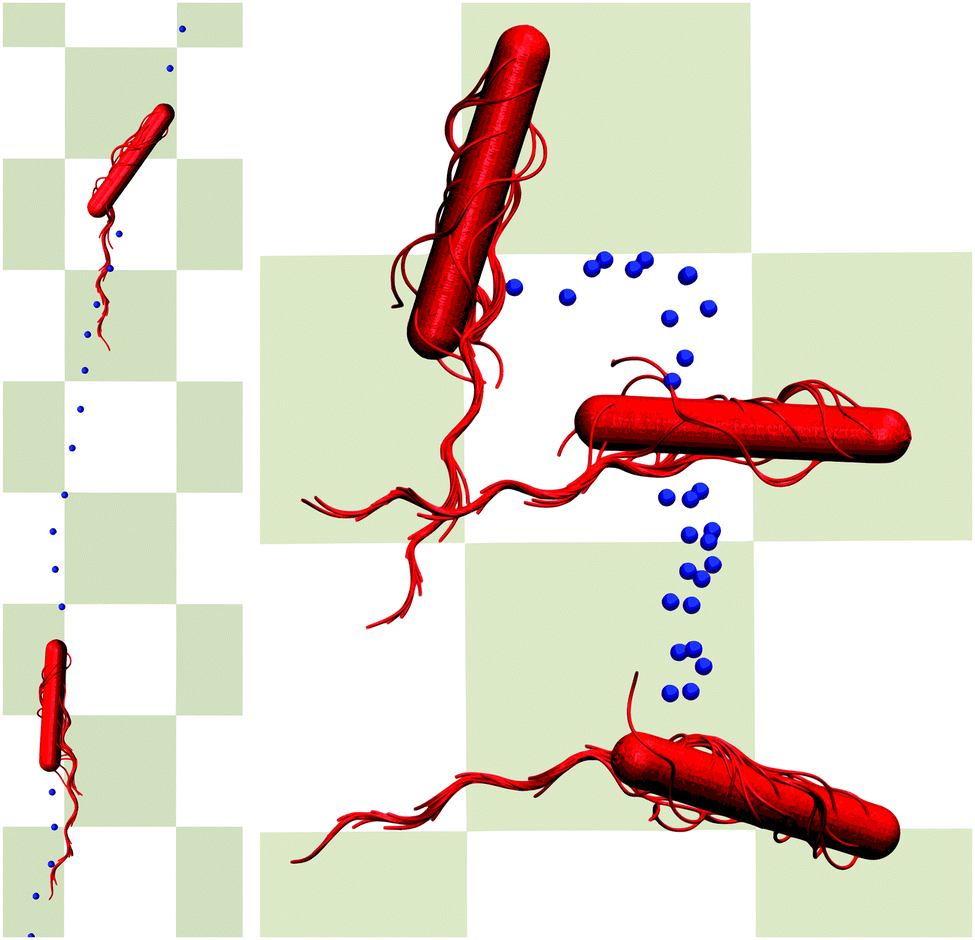 | ||
| Fig. 11 Illustration of migration patterns. The left cell (H/a = 20) migrates rather straight (bottom to top), whereas the right cell (H/a = 120) rolls over the wall (top to bottom). The dots indicate subsequent positions in time of the center of mass of the cell. Simulation animations are shown as Movies S1 and S2 in ESI.† | ||
In order to characterize the orientational stability of trajectories, we determine the body orientational correlation function
| Cb(t) = 〈eb(t)·eb(0)〉, | (11) |
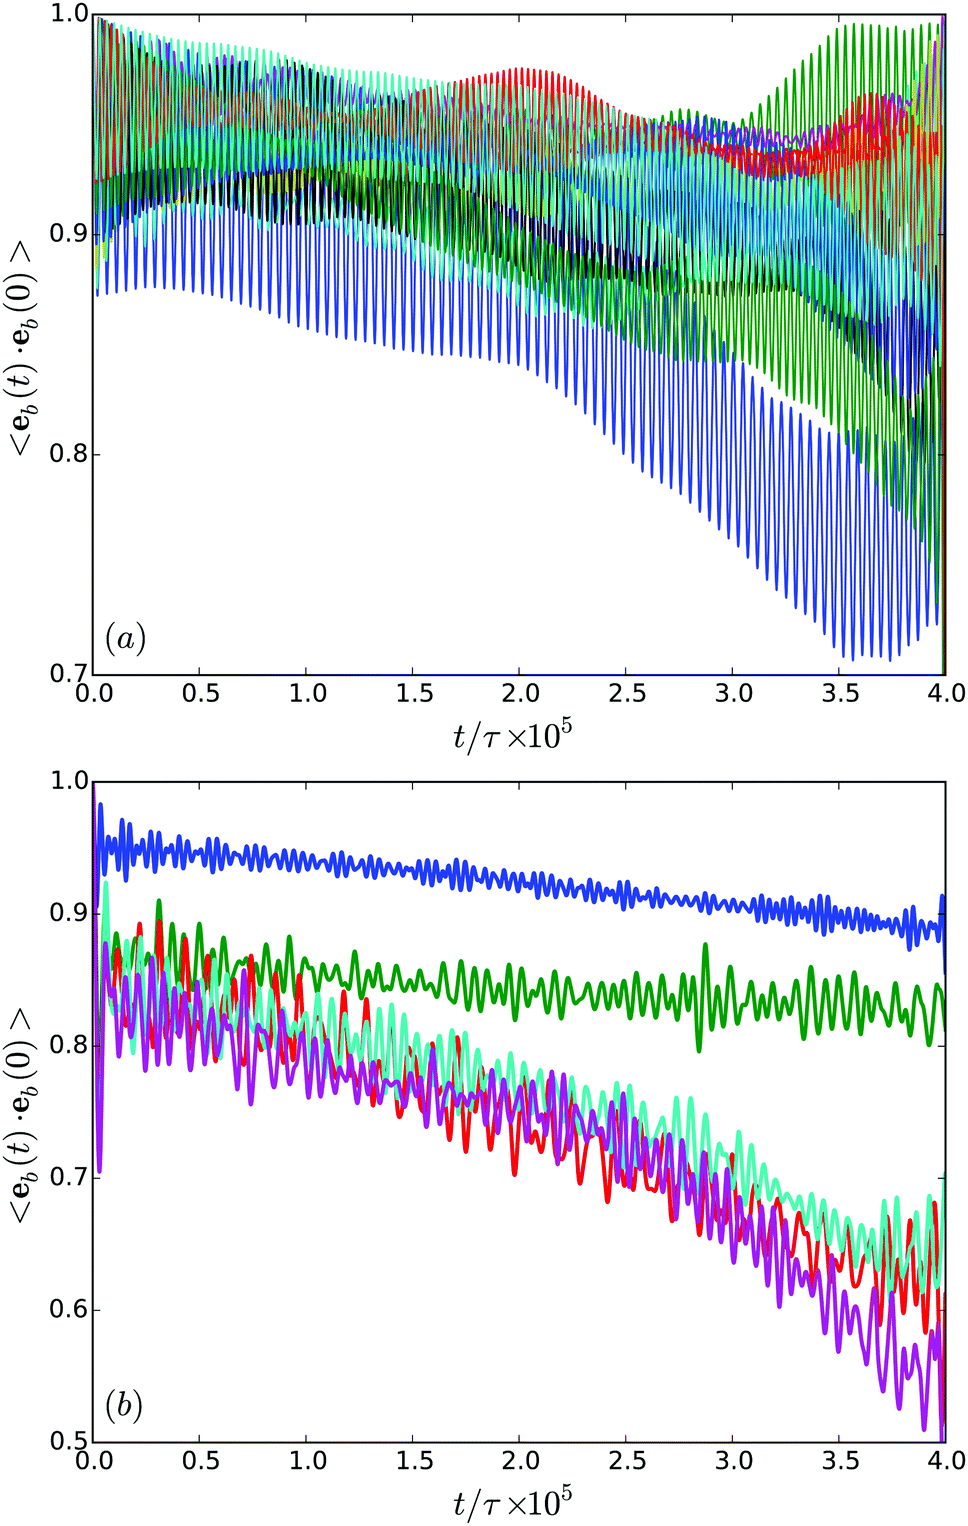 | ||
| Fig. 12 (a) Body-orientation correlation functions of cells confined in a film of width H/a = 20 for various realizations. (b) Body-orientation correlation functions averaged over the various realizations for H/a = 20 (blue), H/a = 30 (green), H/a = 40 (red), H/a = 60 (cyan), and H/a = 120 (purple). | ||
In general, the correlation functions decay in an non-exponential manner. This is certainly not surprising, since the rotational diffusion coefficient is low and we did not cover the time scale corresponding to the inverse of this diffusion coefficient. Nevertheless, the results of Fig. 12(b) reveal a qualitative difference in the migration behavior in rather narrow or wider gaps.
6 Summary and conclusions
We have proposed a model for an E. coli-type swarmer cell and have investigated its properties in confinement between two parallel walls. In general, we find a significant heterogeneity in the appearing structures and the dynamics. For very narrow gaps, where H/lb ≲ 1/3, confinement strongly affects the bundle arrangement and the dynamical properties of cells such as the cell rotation frequency and the migration velocity. For gap widths H/lb ≳ 2/3, H independent values are assumed. The distribution of cells sensitively depends on the wall separation. In very narrow gaps (H/lb = 1/3), the bundle arrangement matters and geometrical restrictions are essential. With increasing wall separation (H/lb = 1/2), both walls become equally important and the cells migrate in the center between the walls, whereas for large H/lb ≳ 1 cells stay close to one of the walls over the simulation time. Considering the migration patters, we find straight paths for narrow gaps, but also rolling over a surface of cells for wide gaps. This is reflected in the cells' center-of-mass mean square displacement.Our calculations show a decrease of the cell migration velocity with increasing body length. This result is in agreement with theoretical expectations within the resistive force theory.48,65,76–79 However, ref. 31 states that elongated E. coli planktonic cells migrate as fast as planktonic E. coli cells and that E.coli swarmer cells migrate even 60% faster. This clearly contradicts our simulation results and theoretical expectations. It remains to be clarified, why swarmer cells migrate so efficiently. Hypothetically, an increased torque in the elongated cells would give rise to faster migration.
Interestingly, essentially a single bundle is formed including in average approximately 80% of the flagella, which gives rise to a migration behavior rather similar to swimming planktonic cells. This is related to the length ratio between the cell body and the flagella; in our case the ratio is approximately unity. Such cells exhibit collective swarming behavior as seen in various experiments.6,7,26,29 However, significantly longer swarmer cells, longer than the length of a flagellum, form multiple bundles and are expected to show a distinctively different swarming behavior. Specifically, inter-cell bundles might be formed as suggested in ref. 24 and 25. We are currently working on an extension of our studies to such longer cells.
Finally, we would like to stress once more the importance of hydrodynamic interactions for bundle formation.20,21 Tests confirm that bundles are also occasionally formed without hydrodynamic interactions22 due to flagella rotation and the associated counter-rotation of the cell body, but that strongly depends on the initial arrangement of flagella. However, in presence of hydrodynamic interactions, bundles are always formed.
Acknowledgements
We thank G. Gompper for helpful discussions. Financial support by the Deutsche Forschungsgemeinschaft (DFG) within the priority program SPP 1726 “Microswimmers – from Single Particle Motion to Collective Behaviour” is gratefully acknowledged.References
- H. C. Berg and D. A. Brown, Nature, 1972, 239, 500–504 CrossRef CAS PubMed.
- H. C. Berg and R. A. Anderson, Nature, 1973, 245, 380 CrossRef CAS PubMed.
- H. C. Berg, E. Coli in Motion, Springer, New York, 2004 Search PubMed.
- G. Taylor, Proc. R. Soc. A, 1951, 209, 447 CrossRef.
- J. Henrichsen, Bacteriol. Rev., 1972, 36, 478 CAS.
- D. B. Kearns, Nat. Rev. Microbiol., 2010, 8, 634 CrossRef CAS PubMed.
- N. C. Darnton, L. Turner, S. Rojevsky and H. C. Berg, Biophys. J., 2010, 98, 2082 CrossRef CAS PubMed.
- L. Turner, R. Zhang, N. C. Darnton and H. C. Berg, J. Bacteriol., 2010, 192, 3259 CrossRef CAS PubMed.
- E. Lauga, W. R. DiLuzio, G. M. Whitesides and H. A. Stone, Biophys. J., 2006, 90, 400 CrossRef CAS PubMed.
- R. Di Leonardo, D. Dell'Arciprete, L. Angelani and V. Iebba, Phys. Rev. Lett., 2011, 106, 038101 CrossRef CAS PubMed.
- L. Lemelle, J.-F. Palierne, E. Chatre, C. Vaillant and C. Place, Soft Matter, 2013, 9, 9759 RSC.
- J. Hu, A. Wysocki, R. G. Winkler and G. Gompper, Sci. Rep., 2015, 5, 9586 CrossRef PubMed.
- L. Turner, W. S. Ryu and H. C. Berg, J. Bacteriol., 2000, 182, 2793 CrossRef CAS PubMed.
- N. C. Darnton, L. Turner, S. Rojevsky and H. C. Berg, J. Bacteriol., 2007, 189, 1756–1764 CrossRef CAS PubMed.
- N. Watari and R. G. Larson, Biophys. J., 2010, 98, 12 CrossRef CAS PubMed.
- J. Platzer, W. Sterr, M. Hausmann and R. Schmitt, J. Bacteriol., 1997, 179, 6391 CAS.
- B. Scharf, J. Bacteriol., 2002, 184, 5979 CrossRef CAS PubMed.
- R. Schmitt, Microbiology, 2002, 148, 627 CrossRef CAS PubMed.
- L. Xie, T. Altindal, S. Chattopadhyay and X.-L. Wu, Proc. Natl. Acad. Sci. U. S. A., 2011, 108, 2246–2251 CrossRef CAS PubMed.
- S. Y. Reigh, R. G. Winkler and G. Gompper, Soft Matter, 2012, 8, 4363 RSC.
- S. Y. Reigh, R. G. Winkler and G. Gompper, PLoS One, 2013, 8, e70868 CAS.
- T. C. Adhyapak and H. Stark, Phys. Rev. E: Stat., Nonlinear, Soft Matter Phys., 2015, 92, 052701 CrossRef PubMed.
- G. Ariel, A. Rabani, S. Benisty, J. D. Partridge, R. M. Harshey and A. Be'er, Nat. Commun., 2015, 6, 8396 CrossRef CAS PubMed.
- S. J. Stahl, K. R. Stewart and F. D. Williams, J. Bacteriol., 1983, 154, 930 CAS.
- B. V. Jones, R. Young, E. Mahenthiralingam and D. J. Stickler, Infect. Immun., 2004, 72, 3941 CrossRef CAS PubMed.
- M. F. Copeland and D. B. Weibel, Soft Matter, 2009, 5, 1174 RSC.
- H. H. Tuson, M. F. Copeland, S. Carey, R. Sacotte and D. B. Weibel, J. Bacteriol., 2013, 195, 368 CrossRef CAS PubMed.
- M. F. Copeland, S. T. Flickinger, H. H. Tuson and D. B. Weibel, Appl. Environ. Microbiol., 2010, 76, 1241 CrossRef CAS PubMed.
- J. D. Partridge and R. M. Harshey, J. Bacteriol., 2013, 195, 909 CrossRef CAS PubMed.
- J. D. Partridge and R. M. Harshey, J. Bacteriol., 2013, 195, 919 CrossRef CAS PubMed.
- J.-M. Swiecicki, O. Sliusarenko and D. B. Weibel, Integr. Biol., 2013, 5, 1490 RSC.
- L. L. McCarter, J. Bacteriol., 2010, 192, 3246 CrossRef CAS PubMed.
- J. Hu, M. Yang, G. Gompper and R. G. Winkler, Soft Matter, 2015, 11, 7843 RSC.
- A. Malevanets and R. Kapral, J. Chem. Phys., 1999, 110, 8605 CrossRef CAS.
- R. Kapral, Adv. Chem. Phys., 2008, 140, 89 CrossRef CAS.
- G. Gompper, T. Ihle, D. M. Kroll and R. G. Winkler, Adv. Polym. Sci., 2009, 221, 1 CAS.
- G. Rückner and R. Kapral, Phys. Rev. Lett., 2007, 98, 150603 CrossRef PubMed.
- I. O. Götze and G. Gompper, Phys. Rev. E: Stat., Nonlinear, Soft Matter Phys., 2010, 82, 041921 CrossRef PubMed.
- M. Yang and M. Ripoll, Phys. Rev. E: Stat., Nonlinear, Soft Matter Phys., 2011, 84, 061401 CrossRef PubMed.
- J. Elgeti and G. Gompper, EPL, 2009, 85, 38002 CrossRef.
- D. J. Earl, C. M. Pooley, J. F. Ryder, I. Bredberg and J. M. Yeomans, J. Chem. Phys., 2007, 126, 064703 CrossRef PubMed.
- J. Elgeti, U. B. Kaupp and G. Gompper, Biophys. J., 2010, 99, 1018 CrossRef CAS PubMed.
- S. B. Babu and H. Stark, New J. Phys., 2012, 14, 085012 CrossRef.
- J. Elgeti and G. Gompper, Proc. Natl. Acad. Sci. U. S. A., 2013, 110, 4470 CrossRef CAS PubMed.
- M. Theers and R. G. Winkler, Phys. Rev. E: Stat., Nonlinear, Soft Matter Phys., 2013, 88, 023012 CrossRef PubMed.
- M. Yang and M. Ripoll, Soft Matter, 2014, 10, 1006 RSC.
- A. Zöttl and H. Stark, Phys. Rev. Lett., 2014, 112, 118101 CrossRef PubMed.
- J. Elgeti, R. G. Winkler and G. Gompper, Rep. Prog. Phys., 2015, 78, 056601 CrossRef CAS PubMed.
- Y. Yang, J. Elgeti and G. Gompper, Phys. Rev. E: Stat., Nonlinear, Soft Matter Phys., 2008, 78, 061903 CrossRef PubMed.
- H. Yamakawa, Helical Wormlike Chains in Polymer Solutions, Springer-Verlag, Berlin Heidelberg, 1997 Search PubMed.
- R. Vogel and H. Stark, Eur. Phys. J. E: Soft Matter Biol. Phys., 2010, 33, 259 CrossRef CAS PubMed.
- C. A. Brackley, A. N. Morozov and D. Marenduzzo, J. Chem. Phys., 2014, 140, 135103 CrossRef CAS PubMed.
- S. Kumar and R. G. Larson, J. Chem. Phys., 2001, 114, 6937 CrossRef CAS.
- M. Theers, E. Westphal, G. Gompper and R. G. Winkler, Phys. Rev. E: Stat., Nonlinear, Soft Matter Phys., 2016, 93, 032604 CrossRef PubMed.
- H. Noguchi and G. Gompper, Phys. Rev. E: Stat., Nonlinear, Soft Matter Phys., 2008, 78, 016706 CrossRef PubMed.
- M. Theers and R. G. Winkler, Soft Matter, 2014, 10, 5894 RSC.
- T. Ihle and D. M. Kroll, Phys. Rev. E: Stat., Nonlinear, Soft Matter Phys., 2003, 67, 066705 CrossRef CAS PubMed.
- C.-C. Huang, R. G. Winkler, G. Sutmann and G. Gompper, Macromolecules, 2010, 43, 10107 CrossRef CAS.
- C.-C. Huang, A. Varghese, G. Gompper and R. G. Winkler, Phys. Rev. E: Stat., Nonlinear, Soft Matter Phys., 2015, 91, 013310 CrossRef PubMed.
- E. Westphal, S. P. Singh, C.-C. Huang, G. Gompper and R. G. Winkler, Comput. Phys. Commun., 2014, 185, 495 CrossRef CAS.
- A. Malevanets and J. M. Yeomans, Europhys. Lett., 2000, 52, 231–237 CrossRef CAS.
- M. Ripoll, K. Mussawisade, R. G. Winkler and G. Gompper, Europhys. Lett., 2004, 68, 106 CrossRef CAS.
- K. Mussawisade, M. Ripoll, R. G. Winkler and G. Gompper, J. Chem. Phys., 2005, 123, 144905 CrossRef CAS PubMed.
- A. Lamura, G. Gompper, T. Ihle and D. M. Kroll, Europhys. Lett., 2001, 56, 319–325 CrossRef CAS.
- S. Chattopadhyay, R. Moldovan, C. Yeung and X. Wu, Proc. Natl. Acad. Sci. U. S. A., 2006, 103, 13712 CrossRef CAS PubMed.
- S. Fujime, M. Maruyama and S. Asakura, J. Mol. Biol., 1972, 68, 347 CrossRef CAS PubMed.
- S. Trachtenberg and I. Hammel, J. Struct. Biol., 1992, 109, 18 CrossRef CAS PubMed.
- R. M. Berry and H. C. Berg, Proc. Natl. Acad. Sci. U. S. A., 1997, 94, 14433 CrossRef CAS.
- M. Ripoll, K. Mussawisade, R. G. Winkler and G. Gompper, Phys. Rev. E: Stat., Nonlinear, Soft Matter Phys., 2005, 72, 016701 CrossRef CAS PubMed.
- P. D. Frymier, R. M. Ford, H. C. Berg and P. T. Cummings, Proc. Natl. Acad. Sci. U. S. A., 1995, 92, 6195 CrossRef CAS.
- A. P. Berke, L. Turner, H. C. Berg and E. Lauga, Phys. Rev. Lett., 2008, 101, 038102 CrossRef PubMed.
- E. Lauga and R. E. Goldstein, Phys. Today, 2012, 65, 30 CrossRef.
- H. Shum and E. A. Gaffney, Phys. Rev. E: Stat., Nonlinear, Soft Matter Phys., 2015, 91, 033012 CrossRef PubMed.
- K. Drescher, J. Dunkel, L. H. Cisneros, S. Ganguly and R. E. Goldstein, Proc. Natl. Acad. Sci. U. S. A., 2011, 10940, 108 Search PubMed.
- J. S. Lintuvuori, A. T. Brown, K. Stratford and D. Marenduzzo, Soft Matter, 2016 10.1039/C6SM01353H.
- E. Lauga and T. R. Powers, Rep. Prog. Phys., 2009, 72, 096601 CrossRef.
- B. Rodenborn, C.-H. Chen, H. L. Swinney, B. Liu and H. P. Zhang, Proc. Natl. Acad. Sci. U. S. A., 2013, 110, E338 CrossRef CAS PubMed.
- Y. Magariyama, S. Sugiyama, K. Muramoto, I. Kawagishi, Y. Imae and S. Kudo, Biophys. J., 1995, 69, 2154 CrossRef CAS PubMed.
- E. M. Purcell, Proc. Natl. Acad. Sci. U. S. A., 1997, 94, 11307 CrossRef CAS.
- K. E. Peyer, L. Zhang, B. E. Kratochvil and B. J. Nelson, Robotics and Automation (ICRA), 2010 IEEE International Conference on, 2010, p. 96.
Footnote |
| † Electronic supplementary information (ESI) available: Movies show simulation animations of the migration of cells over a surface. See DOI: 10.1039/c6sm01532h |
| This journal is © The Royal Society of Chemistry 2016 |