 Open Access Article
Creative Commons Attribution 3.0 Unported Licence
Formation and relaxation kinetics of starch–particle complexes†
Frida
Iselau
 *ab,
Tuan
Phan Xuan
c,
Gregor
Trefalt
d,
Aleksandar
Matic
c,
Krister
Holmberg
a and
Romain
Bordes
*ae
aDepartment of Chemistry and Chemical Engineering, Chalmers University of Technology, 41296 Göteborg, Sweden. E-mail: frida.iselau@chalmers.se
bKemira Kemi AB, 44240 Kungälv, Sweden
cDepartment of Physics, Chalmers University of Technology, 41296 Göteborg, Sweden
dDepartment of Inorganic and Analytical Chemistry, University of Geneva, Switzerland
eVinn Excellence Center SuMo Biomaterials, Chalmers University of Technology, 41296 Göteborg, Sweden. E-mail: bordes@chalmers.se
First published on 9th November 2016
Abstract
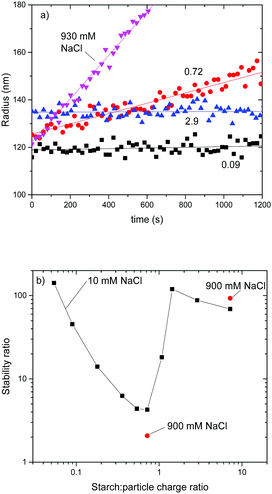
The formation and relaxation kinetics of starch–particle complexes were investigated in this study. The combination of cationic nanoparticles in suspension and anionic starch in solution gave rise to aggregate formation which was studied by dynamic light scattering, revealing the initial adsorption of the starch molecules on the particle surface. By examining the stability ratio, W, it was found that even in the most destabilized state, i.e. at charge neutralization, the starch chains had induced steric stabilization to the system. At higher particle and starch concentrations relaxation of the aggregates could be seen, as monitored by a decrease in turbidity with time. This relaxation was evaluated by fitting the data to the Kohlrausch–Williams–Watts function. It was found that irrespective of the starch to particle charge ratio the relaxation time was similar. Moreover, a molecular weight dependence on the relaxation time was found, as well as a more pronounced initial aggregated state for the higher molecular weight starch. This initial aggregate state could be due to bridging flocculation. With time, as the starch chains have relaxed into a final conformation on the particle surface, bridging will be less important and is gradually replaced by patches that will cause patchwise flocculation. After an equilibration time no molecular weight dependence on aggregation could be seen, which confirms the patchwise flocculation mechanism.
Introduction
In applications like paints, water treatment and paper making a combination of charged nanoparticles, such as silica or polystyrene, and polyelectrolytes (PEs) is often employed. The need for understanding the interactions between the particles and the PE has generated a large number of studies of the colloidal behavior of particles when a PE is added to the particle suspension. The main focus has been to understand how the PE adsorption on the particle surfaces will influence the colloidal stability.1–5The electrostatic interaction between a polyelectrolyte and an oppositely charged particle in suspension is the driving force and induces PE adsorption on the particle surface.6 However, by adsorbing onto a surface the PE reduces its entropy, which is energetically unfavorable. This is often more than compensated for since the PE adsorption induces an ion exchange process where the PE replaces the counterions. The release of many small inorganic ions is entropically very favorable and the total entropy of the system is therefore increased.7–9
Possible mechanisms for polyelectrolyte-induced aggregation of colloidal particles of opposite charge are extensively discussed in the literature.10,11 Charged particles in solution are typically stable due to electrostatic repulsion. If an oppositely charged polyelectrolyte is added to the suspension it adsorbs onto the particles and reduces the magnitude of their surface charge. Further addition of polyelectrolyte can lead to charge neutralization, where the amount of adsorbed polymer is just right to neutralize the charge of the particle. At this point the attractive van der Waals forces will cause aggregation of the particles.11 The adsorption of the polyelectrolyte will also enhance aggregation due to interaction with the particles and this interaction is often described in the literature as bridging or patchwise flocculation.11–13 Bridging flocculation relates to the situation when the polymer is attracted to more than one particle, thereby forming a bridge between the particles.12 This aggregation mechanism is predominant at high particle concentrations for high molecular weight polymers and it is also considered to be the main flocculation mechanism for neutral polymers.14
The other aggregation mechanism discussed in the literature is patchwise flocculation,4,5,13,15–19 for which it is proposed that the charged polymer chains adsorb in patches onto the particle surface due to electrostatic attraction. This adsorption results in a local charge reversal on the particle surface since it now holds patches of opposite charge. This, in turn, can cause electrostatic attraction between patches of reversed charge on some particles and oppositely charged uncovered patches on other particles.
In early studies, turbidity was used to study the rate of flocculation in systems composed of charged particles and oppositely charged polyelectrolytes.3,13,20 The impact of molecular weight was thoroughly investigated. In order to be able to capture the increase in turbidity with time, the aggregation half-time was adjusted by adjusting the particle concentration, according to Smoluchowski's theory,21 which was normally used. These studies led to the proposal of an aggregation mechanism through patchwise flocculation for such systems. In recent years dynamic light scattering (DLS) has been the main analytical tool employed to investigate the aggregation behavior and colloidal stability of particle–polyelectrolyte systems. The procedure has been used to study the effect of ionic strength, molecular weight of the PE and pH on the suspension stability.2,14,15,22,23 Also in these studies the particle and the PE concentrations have been very low in order to remain in the early stages of aggregation where singlets and doublets are dominant. Hence, by using low concentrations of particles in the aggregation experiments the formation of the aggregates can be studied.
In the investigations discussed above it is assumed that the adsorption of the polymer has reached equilibrium before aggregation of the colloidal particles occurs. This means that the polymer diffusion to the surface, attachment at the surface and reorganization occur before the particles collide.24 This might not always be the case and if the flocculation occurs prior to obtaining equilibrium, it is referred to as “non-equilibrium flocculation” (NEF) in the literature.25,26 During NEF, the time for collision, tc, is shorter than the time for polymer relaxation tr. This implies that when particle collision occurs, the adsorbed polymer chain has not rearranged into an equilibrated conformation. The possibility of initial bridging flocculation is discussed in the literature as an effect of a higher particle collision rate compared to the time needed for the adsorbed polymer to relax into an equilibrated conformation on the particle surface. In this transition state bridging of particles by the polymer can occur and result in a bridging flocculation mechanism.27
By using higher particle and PE concentrations, comparable to most industrial applications, the turbidity increase with time due to aggregate formation cannot be monitored since according to Smoluchowski theory21 the time for particle collision at this particle concentration is around 3 ms. However, with a particle concentration that gives a very fast collision time, tc shorter than tr, the particles will collide with the polymer chains attached to the surface in a non-equilibrated conformation. This gives the opportunity to study the rate of the PE reorganization on the particle surfaces and to compare the initial adsorption state with the equilibrated aggregation mechanism. This relaxation kinetics is followed both in short (minutes) and long (hours/days) time periods to determine both the initial adsorption state and the long term stability of the formed aggregates.
Latex/PE systems are used for surface hydrophobization of paper, referred to as surface sizing. In this process starch is commonly used in combination with positively or negatively charged latexes less than 100 nm in size. The particle size plays a very important role for this type of application, as a large surface area is beneficial in the drying process. The starch and the latex are normally first blended and then applied on the paper surface at the dry-end of the paper machine.28,29 The concentration of starch is typically a few percent and the particle concentration is around 0.1 wt%. In a previous paper the aggregation mechanism and the internal structure were described for cationic particles, labelled SP+, combined with an anionic starch.28 The results from that work regarding the aggregation mechanism, the shape of the polymer when adsorbed onto the cationic particle surface, as well as the selective adsorption of the high molecular weight amylopectin fraction of the starch during aggregation, are discussed in some detail. The SP+ particles that are used in this study are of practical interest in the paper industry.
As stated above, the majority of the studies related to interactions between suspended particles and polyelectrolytes are performed on dilute systems. Many of these studies focus on the initial aggregation rate at different particle to polyelectrolyte ratios and aim at determining the stability ratio, which is defined as W = kfast/k, where kfast is the aggregation rate coefficient at the maximum rate of aggregation and k is the aggregation rate coefficient under the studied conditions. The inverse stability ratio represents the likelihood of obtaining a dimer upon collision between two particles. The stability ratio, W, and the electrophoretic mobility as a function of added polyelectrolyte are employed to study how the stability ratio and the electrophoretic mobility are affected by the molecular weight of the PE, an increase in the ionic strength of the solution and changes in pH. Since the aggregate formation has been the focus of these studies, less attention has been dedicated to the aggregation behavior on a long term basis. In the study reported here we examine the interactions between cationic nanoparticles and an anionic PE. The aggregation was studied by a combination of techniques such as DLS, turbidity and small angle X-ray scattering (SAXS) which allowed us to describe the whole aggregation process starting from aggregate formation and determine the change from electrostatic to steric stabilization at maximum aggregation. We also investigate the relaxation kinetics for the formed aggregates with time. SAXS was used to clarify whether the internal structure and the fractal dimension of the aggregates are affected. To our knowledge this is the first time such a comprehensive picture is reported in a single study.
Experimental section
Materials
The starch powders, oxidized regular potato starch and oxidized waxy potato starch, were both from Avebe, The Netherlands, and used as received. To study the early stages of aggregation, polystyrene particles with a radius of 110 nm decorated with amidine groups, denoted as AL110, were purchased from Invitrogen (Basel, Switzerland). Before use the particles were dialyzed against Milli-Q water (resistivity >18 MΩ) until a conductivity of less than 8 × 10⁻⁵ S m−1 was reached. For studying the later stages of aggregation and relaxation kinetics the cationic particles, denoted SP+, were synthesized as described in a previous paper.29 Milli-Q water was used throughout the study. For the particle charge density titrations solutions of 0.001 N polydiallylmethyl ammonium chloride (polyDADMAC) and sodium polyethylene sulphonate (PES-Na) from BTG Instruments AB were used.Methods
Study of the aggregation behaviour
For the simultaneous aggregation and relaxation measurements of the cationic particle suspension in combination with the anionic starch the SP+ concentration was 0.001 wt% and starch corresponding to 1![[thin space (1/6-em)]](https://www.rsc.org/images/entities/char_2009.gif) :
:![[thin space (1/6-em)]](https://www.rsc.org/images/entities/char_2009.gif) 1 in the charge ratio was added to the particle suspension. Both SP+ and starch were filtered using a 0.2 μm hydrophilic syringe filter before mixing.
1 in the charge ratio was added to the particle suspension. Both SP+ and starch were filtered using a 0.2 μm hydrophilic syringe filter before mixing.
Aggregate growth monitoring and relaxation
![[thin space (1/6-em)]](https://www.rsc.org/images/entities/char_2009.gif) sin
sin![[thin space (1/6-em)]](https://www.rsc.org/images/entities/char_2009.gif) θ/λ, where λ is the wavelength and 2θ is the scattering angle and it was calibrated with a silver behenate sample. The difference in the radial averaged SAXS 2D images from the sample and the solvent is reported as scattering profiles I(q). Data reduction was processed using the Nika package on Igor pro.35
θ/λ, where λ is the wavelength and 2θ is the scattering angle and it was calibrated with a silver behenate sample. The difference in the radial averaged SAXS 2D images from the sample and the solvent is reported as scattering profiles I(q). Data reduction was processed using the Nika package on Igor pro.35
Sample injections were done with a Waters 717 plus Autosampler and an in-line degasser from Waters for the mobile phase was used. The separation column, a TSKgel GMPWXL from Tosch Bioscience, had a particle size of 13.0 μm and the dimension of 7.8 mm × 30.0 cm. The mobile phase was 10 mM NaCl + 0.02 wt% NaN3 and it was filtered and degassed before use. The flow rate was 0.5 mL min−1 and the elution time was 30 min. The mobile phase was used as a blank and a Pullulan standard was used for quality control. Triple injections of the samples were done. The starch samples were diluted with Milli-Q water to 2 mg mL−1 before analysis. The dn/dc value was set to 0.151 according to the literature.36
Results and discussion
System characterization and charge ratio determination of the particle–PE system
In the studied system two types of cationic particles were used in combination with oxidized starch. Starch consists of two types of anhydroglucose chains, amylose and amylopectin. Amylose is a short, linear polymer, while amylopectin has much higher molecular weight and is also highly branched. The ratio between amylose and amylopectin in native starch depends on the source of origin. Regular potato starch contains 20 wt% amylose and 80 wt% amylopectin38 while waxy potato starch consists of 99 wt% amylopectin. Both regular and waxy potato starch are used in this study. Native starch is often oxidized in order to decrease the molecular weight and thereby also decreases the solution viscosity. Further details of the starch oxidation are given in a previous paper.39The reason for including both regular and waxy starch in this study relies on previous results.39 Based on SEC and SAXS data, we concluded that mainly amylopectin participated in the aggregation with the cationic particles.
The charge density was determined by the streaming potential (see Table 1) and the difference in charge density originates from different degree of oxidation.
| Sample | M n (kD) | M w (kD) | M w/Mn | Charge density (μeq per g) |
|---|---|---|---|---|
| Regular starch | 202 | 870 | 4.3 | −176 |
| Waxy starch | 1380 | 3090 | 2.2 | −127 |
The starches used in this study were characterized by size exclusion chromatography (SEC).40 The results of the SEC analysis are listed in Table 1. Waxy starch has a higher weight average molecular weight compared to the regular starch. The polydispersity index, Mw/Mn, for regular potato starch is higher compared to waxy starch.
The SP+ particles consist of a hydrophobic core of the styrene–acrylate copolymer. Colloidal stability is achieved by a cationic stabilizer which is a copolymer of styrene and a quaternary ammonium monomer29 rendering the particles cationic over a wide pH range. SP+ has a hydrodynamic radius of 22 nm and a ζ potential of +53 mV.
In order to study the aggregate formation by DLS in the early stage for the SP+ particles and starch and extract the stability ratio for the system it is crucial that the collision rate of the particles is low enough to allow capturing the early stage of aggregation. Such measurements with small particles can be challenging because to ensure enough scattering signal one has to increase the concentration of the particles and this increases the collision rate.
With the SP+ particles system, it was found that the collision rate was too high to capture in detail the early stages of aggregation. This is due to the relatively small hydrodynamic radius of the SP+ particles. Therefore, another type of cationic particles, amidine particles with a RH of 110 nm, AL110, was employed for this part of the study. A comparative analysis of the two particle types was done to support the use of the amidine particles as a model for the SP+ particles. The amidine particles had a ζ potential of +40 mV and the colloidal charge was +17 μeq per g as determined by PCD. The starch to particle charge ratio for the amidine particles and the regular starch can be estimated to be 10![[thin space (1/6-em)]](https://www.rsc.org/images/entities/char_2009.gif) :
:![[thin space (1/6-em)]](https://www.rsc.org/images/entities/char_2009.gif) 1 taken from the charge density titrations.
1 taken from the charge density titrations.
For the SP+ particles the starch to particle charge ratio could not be obtained in the same straightforward manner since the higher charge density for the SP+ particles and the smaller size lead to fast aggregation. This is known to have a pronounced effect on the reliability of the results from the charge density titration. Therefore, the charge ratio for starch and SP+ was determined by using the starch as a titrant for the SP+ particles and by monitoring the amount of starch needed for charge neutralization of the SP+ particles. This value is then taken as the 1![[thin space (1/6-em)]](https://www.rsc.org/images/entities/char_2009.gif) :
:![[thin space (1/6-em)]](https://www.rsc.org/images/entities/char_2009.gif) 1 charge ratio for the starch
1 charge ratio for the starch![[thin space (1/6-em)]](https://www.rsc.org/images/entities/char_2009.gif) :
:![[thin space (1/6-em)]](https://www.rsc.org/images/entities/char_2009.gif) SP+ system.
SP+ system.
To a 6 ppm amidine particle suspension different amounts of starch were added and the electrophoretic mobility was monitored. The results are shown in Fig. 1 where electrophoretic mobility is plotted versus starch to particle charge ratio. The positive electrophoretic mobility for the AL110 particles decreases with increasing starch to particle ratio and the electrophoretic mobility crosses zero at a starch to particle charge ratio close to 1.
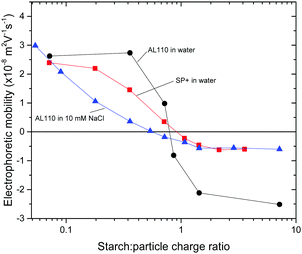 | ||
Fig. 1 Plot of electrophoretic mobility versus starch![[thin space (1/6-em)]](https://www.rsc.org/images/entities/char_2009.gif) : :![[thin space (1/6-em)]](https://www.rsc.org/images/entities/char_2009.gif) particle charge ratio for amidine particles and SP+ particles. Regular starch was used in this part of the study. particle charge ratio for amidine particles and SP+ particles. Regular starch was used in this part of the study. | ||
Above 1![[thin space (1/6-em)]](https://www.rsc.org/images/entities/char_2009.gif) :
:![[thin space (1/6-em)]](https://www.rsc.org/images/entities/char_2009.gif) 1 charge ratio, i.e. with excess starch, the electrophoretic mobility levels out at a slightly negative value, −2.5 × 10⁻⁸ m2 V−1 s−1. This is in accordance with the changes in the electrophoretic mobility for the SP+ particles when starch is added, also shown in Fig. 1.
1 charge ratio, i.e. with excess starch, the electrophoretic mobility levels out at a slightly negative value, −2.5 × 10⁻⁸ m2 V−1 s−1. This is in accordance with the changes in the electrophoretic mobility for the SP+ particles when starch is added, also shown in Fig. 1.
With increasing amount of starch added to the SP+ particles, the electrophoretic mobility decreases and crosses zero at a starch concentration corresponding to 1![[thin space (1/6-em)]](https://www.rsc.org/images/entities/char_2009.gif) :
:![[thin space (1/6-em)]](https://www.rsc.org/images/entities/char_2009.gif) 1 in the charge ratio. It then levels out at a slightly negative electrophoretic mobility, −0.6 × 10⁻⁸ m2 V−1 s−1. This behaviour validates the use of larger amidine particles as a model system for the aggregate formation of the SP+ particles and starch.
1 in the charge ratio. It then levels out at a slightly negative electrophoretic mobility, −0.6 × 10⁻⁸ m2 V−1 s−1. This behaviour validates the use of larger amidine particles as a model system for the aggregate formation of the SP+ particles and starch.
Aggregation behavior: kinetics and mechanism
The general aspects of turbidity evolution for the SP+ particle suspension in the presence of starch were discussed in a previous paper.39 Briefly it can be stated that the addition of starch induced a dramatic increase in turbidity due to the formation of aggregates in the system. The turbidity increased to a maximum at a starch to SP+ charge ratio of around 1. Further addition of starch partially restored the stability of the dispersion, as is evident from the decrease in turbidity above this charge ratio. However, the turbidity did not return to the initial absorbance value observed for the primary SP+ particles, indicating that even in the presence of excess starch, there were still aggregates in the suspension. This was found to be the result of a shift of the stabilization mechanism from electrostatic to electrosteric due to the highly branched amylopectin adsorbed onto the particle surface. Further studies of the aggregation revealed that the initial turbidity was higher compared to the turbidity after an equilibration time. The present study originates form this observation.DLS was employed to study the formation of the aggregates by the addition of starch. A model system of amidine particles, 110 nm in radius and +40 mV ζ potential, was used to reach sufficient scattering intensity, as the particle concentration to be used with SP+ particles gave rise to a too high collision rate, in order to be able to capture the early stage of aggregation. For larger amidine particles the collision rate was lower and therefore the aggregate formation when starch is added could be monitored. From this DLS study the stability ratio, W, was determined.
The change in turbidity was monitored with time at different starch to SP+ particle charge ratios and from the results the relaxation rates could be obtained. This was done at different particle concentrations, different temperatures, different addition orders as well as different molecular weights of the PE (namely the use of regular and waxy starch).
Complementary experiments were done to follow the aggregate formation, as well as the subsequent relaxation.
Furthermore, the inner aggregate structure was studied by SAXS.
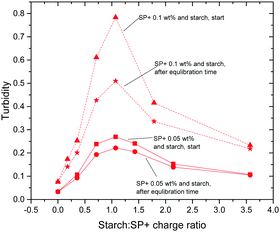
The initial and the equilibrated (after 6 h) turbidity values, for both regular and waxy starch, are shown in Fig. 3. In this figure it can be seen that the shape of the turbidity curve over the whole range of the starch to SP+ charge ratio used in this study is the same for the initial values as for the equilibrated values; the curves differ only in intensity. The maximum turbidity is observed at a starch to SP+ charge ratio of 1, which is in line with the early stage aggregation studies. The large difference in intensity between waxy and regular starch is particularly striking, the initial turbidity for waxy starch being much higher. The aggregation mechanism that was presented in a previous paper39 concluded that even if the possibility of amylose first adsorbing onto the particles followed by an exchange of amylose by amylopectin may be considered, it was mainly the amylopectin fraction of the starch that participated in the aggregation with the SP+ particles. The higher amount of amylopectin, 99 wt%, compared to 80 wt% for waxy starch, cannot be the sole explanation, since this would only cause a shift in the position of the maximum. Two factors that might contribute to this effect are the presence of amylose that could have an inhibiting effect on the aggregation and the long amylopectin chains in waxy starch that can form aggregates that would require longer rearrangement times.
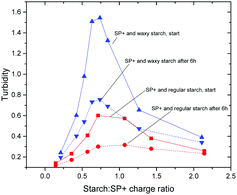 | ||
| Fig. 3 Initial and equilibrated turbidity curves for the SP+ particles with regular and waxy starch. The turbidity is measured as absorbance at 400 nm. | ||
The SP+ particle concentration of 0.1 wt% that was mainly used in this study is high compared to previous studies using turbidity as a measure of aggregation. A starch titration experiment was also performed where the SP+ particle concentration was 0.05 wt%. When comparing the turbidity curves for the two particle concentrations (Fig. 4), two main differences can be distinguished. First, the magnitude of the turbidity increase is more pronounced for the higher particle concentration. This is expected as more aggregation can take place for the same starch to SP+ ratio when more particles are present in the suspension. The second observation is that the initial kinetic contribution to the turbidity increase is higher for the particle concentration of 0.1 wt% compared to that of 0.05 wt%. This is seen from the difference between the initial and the final turbidity values being larger for higher particle concentration.
When the particle concentration is doubled, the time for collision, τ, should be halved according to the Smoluchowski relation τ ≈ (2 × 10¹¹/ν0) seconds, where the particle concentration ν0 is in particles per cm3. This means that the collision rate, rc, is higher at the higher particle concentration and that non-equilibrium flocculation can take place to a larger extent.20,26 The explanation for this is that the higher the particle concentration, the higher is the probability for the starch chains to interact with more than one particle through bridging flocculation. Initially the starch chains have the possibility to interact with more than one particle surface but rearrangement occurs, giving rise to starch patches on the particles and the aggregation mechanism will then move towards patchwise aggregation,24,41 which leads to a decrease in turbidity with time. This is in agreement with the discussions in the literature about an initial aggregation state that with time will evolve into an equilibrated aggregation state.3,20,42 The possibility of initial bridging flocculation is discussed in the literature as an effect of higher particle collision rate compared to the time needed for the adsorbed polymer to relax into an equilibrated conformation on the particle surface. In this transition state bridging of the polymer between particles can occur and result in an initial bridging flocculation.27
These results also explain why relaxation could not be seen in the light scattering experiments, wherein the aggregate formation was captured. In that case the very dilute particle and starch system mainly allowed doublets to form and therefore bridging flocculation was unlikely to occur. Furthermore, doublets constitute a form of aggregates that cannot evolve into a more compact form, in the sense that doublets constitute the simplest form of aggregates. Singlets are primary particles that cannot be referred to as aggregates.
The influence of temperature on the aggregation was investigated. First, the temperature impact on the particle suspension and the starch solution alone was addressed by monitoring the turbidity of a 0.1 wt% suspension of SP+ and of a 3 wt% regular starch solution while increasing the temperature. No turbidity change was noted on either system.
For the combination of SP+ and starch a temperature effect on the turbidity could be seen. In the ESI† the turbidity curves for SP+ and starch are plotted for three different temperatures; room temperature, 40 °C and 60 °C. The shape of the curves is the same irrespective of the measuring temperature, but the intensity of the turbidity differs.
There is a decrease in the turbidity maximum with increasing temperature and the plot of turbidity versus 1/T shows a linear relationship, see Fig. S2 in the ESI.† When comparing the titration curve recorded at 60 °C and the curve for the equilibrated values at room temperature there is good agreement of the values, as seen in Fig. S3 (ESI†). This is reasonable since the system is more dynamic at higher temperatures, which leads to a faster reorganization of the PE chains from bridges to patches on the particle surfaces.
This demonstrates that the relaxation rate after aggregate formation can be accelerated by increased temperature, but in the end the remaining, stable, aggregates will be the same.
By monitoring the variation of turbidity with time the kinetic pattern could be analysed. Starting from the moment when starch was added to the 0.1 wt% SP+ suspension, the turbidity decreases for the whole starch to SP+ charge ratio range included in this study (Fig. 5). Moreover, the decrease was more pronounced the higher the initial turbidity. This means that the charge ratios that resulted in the strongest aggregation also had the largest time dependence in terms of turbidity decrease. Similar behaviour was also observed for waxy starch.
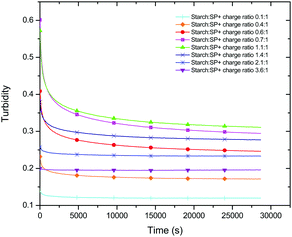 | ||
| Fig. 5 Turbidity curves as a function of time for different starch (regular) to particle charge ratios. | ||
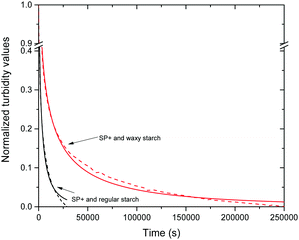
When the data for the different starch to particle ratios were normalized the effect of the different ratios could no longer be seen, as is shown in Fig. S4 in the ESI.† However, an important difference could be seen between the two different starch types (Fig. 6); regular starch had a steeper turbidity decline than waxy starch. This relaxation behaviour of the turbidity with time was evaluated further by fitting the experimental data with the Kohlrausch–Williams–Watts (KWW) relaxation function.
The Kohlrausch–William–Watts function is a stretched exponential function that originates from Kohlrausch's work from 1866,43 which was further developed by William and Watts.44 This function is used to describe various types of relaxation data. Historically the focus has been on dielectric relaxation but nowadays it is also used for enthalpy relaxation, light scattering,45 as well as investigations of polymer solutions46 and protein aggregation.47 It is even used as an universal tool for studying various physical and chemical processes.48
The KWW function is expressed as
 | (1) |
The aggregate relaxation data from the turbidity studies of the mixtures of SP+ particles and starch were fitted with the KWW function (1) and from the fitting the relaxation time, τ, and the relaxation distribution parameter, β, were obtained.
The R2 value for the fitting was >0.95 for all turbidity curves examined with the KWW function. The plots of β and τ versus time are shown in Fig. 7 and 8, respectively. The plot of β versus time in Fig. 7 shows the similarity between the two starch types regarding the β values. This is especially important as large discrepancies in the β value would not allow the comparisons of the relaxation time between waxy and regular starch.52 Irrespective of the amount of starch added to the SP+ particle suspension and of the starch type, the β value is around 0.4, supporting a relatively heterogeneous system, as would be expected for a system where multiple reorganization events of the same nature, i.e. aggregate structure changes, occur simultaneously.
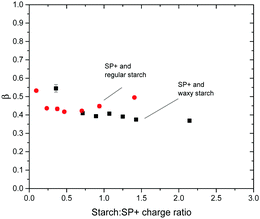 | ||
| Fig. 7 Plot of relaxation distribution parameter β versus starch to particle charge ratio for the combination of SP+ particles and the two different starch types, regular and waxy starch. | ||
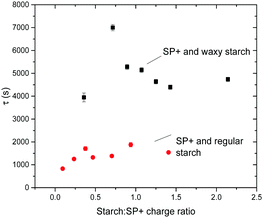 | ||
| Fig. 8 Plot of relaxation time, τ, versus starch to particle charge ratio for the combination of SP+ particles and the two different starch types, regular and waxy starch. | ||
The τ values for different starch to SP+ charge ratios show no obvious trend, especially in relation to the ratio giving maximum turbidity. This implies that irrespective of the starch to particle charge ratio and the net charge of the complex (as determined by electrophoresis), the time for going from an initial aggregated state to the relaxed equilibrated state where the starch chains have had sufficient time to rearrange on the particle surface is the same.
The magnitude of the turbidity change is evidently affected by the amount of starch added; the maximum turbidity corresponds to a specific starch concentration where the particle suspension is in its most destabilized state. However, it is interesting to note the difference between waxy and regular starch. On average the relaxation time for regular starch is around 1400 s and for waxy starch it is around 4800 s. The fact that waxy starch, which has three times higher Mw than regular starch, also has three times longer relaxation time supports the view that there is an initial aggregation state where bridging flocculation occurs while the equilibrated aggregation is via patchwise flocculation. The fact that the relaxation is more pronounced with amylopectin-rich waxy starch than with regular starch indicates that exchange of amylose by amylopectin does not contribute to the relaxation process.
The relaxation time can also be affected by the strength of the surface attraction.53 Since regular starch carries a higher anionic charge compared to waxy starch regular starch can be expected to have stronger attraction to the cationic particle surface. This might also contribute to the difference in relaxation time between regular and waxy starch.
After two weeks of storage at room temperature the turbidity of the SP+ particles together with regular starch remains at the same level as presented above, however, the samples with SP+ and waxy starch have dropped considerably in turbidity. No sedimentation was observed that could explain the decreased turbidity. This means that the kinetics for waxy starch when going from bridging flocculation to patchwise flocculation was not entirely captured within the six hours of the study.
No change in intensity over time could be seen for any of the different starch to particle ratios.
In a paper by Cosgrove et al. from 1981,54 it is argued that the hydrodynamic radius “is determined by the very longest tails”, which can be less than 5% of the total amount, i.e. the long tails contribute much to RH and to the initial bridging flocculation. However, from the SAXS data the radius of gyration, RG, and not the RH, is obtained and that could be the reason for no visible change of the inner structure or fractality with time.
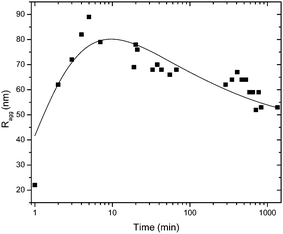
The evolvement of the size distributions during the first 10 minutes after mixing reveals the formation of the aggregates at the initial step of aggregation and is shown in Fig. S6 (ESI†). At first, the primary particles still can be seen and the size distribution is bimodal. The peak corresponding to the primary particles decreases with time and the aggregate size increases. At the last time point relaxation takes place which can be seen by a decrease in aggregate size. The peak corresponding to the primary particles does not reappear during the relaxation, an observation in favour of rearrangement rather than singlet formation.
Conclusions
In this study the whole aggregation process, including aggregate formation, the transformation from electrostatic to steric stabilization and the relaxation kinetics, has been explored. In the investigation of aggregate formation the stability ratio, W, was determined and it was found that even at a starch to particle charge ratio of 1 the minimum W did not reach 1, which would have been an indication of a fully destabilized system. This was interpreted as the starch giving rise to steric stabilization at the 1![[thin space (1/6-em)]](https://www.rsc.org/images/entities/char_2009.gif) :
:![[thin space (1/6-em)]](https://www.rsc.org/images/entities/char_2009.gif) 1 in charge ratio. At starch to particle ratios higher than 1 the electrophoretic mobility was reversed due to adsorption of the anionic starch and the values reached a plateau. However, the slightly net anionic charge of the complex at the plateau is not sufficient to provide stabilization via electrostatic repulsion. The steric contribution to stability from the highly branched, high molecular weight amylopectin fraction is significant.
1 in charge ratio. At starch to particle ratios higher than 1 the electrophoretic mobility was reversed due to adsorption of the anionic starch and the values reached a plateau. However, the slightly net anionic charge of the complex at the plateau is not sufficient to provide stabilization via electrostatic repulsion. The steric contribution to stability from the highly branched, high molecular weight amylopectin fraction is significant.
The kinetics study also gives information about the aggregation mechanism. The initial, higher turbidity that could be seen for the SP+ and starch mixture at the highest aggregation level, around the 1![[thin space (1/6-em)]](https://www.rsc.org/images/entities/char_2009.gif) :
:![[thin space (1/6-em)]](https://www.rsc.org/images/entities/char_2009.gif) 1 in charge ratio, indicates that at first, the aggregates are larger, and the starch flocculates the particles more effectively via bridging flocculation. After rearrangement due to the electrostatic interaction between the polyelectrolyte and the oppositely charged particle surface the aggregation at equilibrium is due to patchwise flocculation. This means that a somewhat denser aggregate structure with smaller aggregate size is formed, which is manifested as a decrease in turbidity.
1 in charge ratio, indicates that at first, the aggregates are larger, and the starch flocculates the particles more effectively via bridging flocculation. After rearrangement due to the electrostatic interaction between the polyelectrolyte and the oppositely charged particle surface the aggregation at equilibrium is due to patchwise flocculation. This means that a somewhat denser aggregate structure with smaller aggregate size is formed, which is manifested as a decrease in turbidity.
The two starch types, regular and waxy starch, gave rise to different turbidity intensities. The high molecular weight waxy starch induced a much higher initial turbidity. However, after relaxation the turbidity decreased for both starches and after sufficient time there was no longer a significant difference between them. A flocculation mechanism that goes from bridging flocculation, where the length of the polymer chain has a strong influence on the bridges formed, towards patchwise flocculation, which is more or less independent of the molecular weight of the polyelectrolyte, explains the initial difference between the starch types and also why there is no longer any difference after the equilibration state has been reached.
Acknowledgements
Financial support from the Swedish Research Council and the University of Geneva is gratefully acknowledged. The opportunity to go to MAX IV Laboratory for SAXS beam time is gratefully acknowledged. SuMo Biomaterials is gratefully acknowledged for providing economic and scientific support.References
- M. Borkovec and G. Papastavrou, Curr. Opin. Colloid Interface Sci., 2008, 13, 429–437 CrossRef CAS.
- A. Fuchs and E. Killmann, Colloid Polym. Sci., 2001, 279, 53–60 CAS.
- J. Gregory, J. Colloid Interface Sci., 1976, 55, 35–44 CrossRef CAS.
- F. Mabire, R. Audebert and C. Quivoron, J. Colloid Interface Sci., 1984, 97, 120–136 CrossRef CAS.
- J. Zhang, C. Huguenard, C. Scarnecchia, R. Menghetti and J. Buffle, Colloids Surf., A, 1999, 151, 49–63 CrossRef CAS.
- G. J. Fleer, T. Cosgrove, B. Vincent, M. A. Cohen Stuart and J. M. H. M. Scheutjens, Polymers at interfaces, Chapman & Hall, London, 1993 Search PubMed.
- A. A. Meier-Koll, C. C. Fleck and H. H. Von Grünberg, J. Phys.: Condens. Matter, 2004, 16, 6041–6052 CrossRef CAS.
- S. Rosenfeldt, A. Wittemann, M. Ballauff, E. Breininger, J. Bolze and N. Dingenouts, Phys. Rev. E: Stat., Nonlinear, Soft Matter Phys., 2004, 70, 0614031 CrossRef PubMed.
- K. Holmberg, B. Jönsson, B. Kronberg and B. Lindman, Surfactants and polymers in aqueous solution, Wiley, Chichester, 2003 Search PubMed.
- L. Feng, M. C. Stuart and Y. Adachi, Adv. Colloid Interface Sci., 2015, 226, 101–114 CrossRef CAS PubMed.
- I. Szilagyi, G. Trefalt, A. Tiraferri, P. Maroni and M. Borkovec, Soft Matter, 2014, 10, 2479–2502 RSC.
- T. W. Healy and V. K. La Mer, J. Colloid Sci., 1964, 19, 323–332 CrossRef CAS.
- J. Gregory, J. Colloid Interface Sci., 1973, 42, 448–456 CrossRef CAS.
- H. W. Walker and S. B. Grant, Colloids Surf., A, 1996, 119, 229–239 CrossRef CAS.
- G. Gillies, W. Lin and M. Borkovec, J. Phys. Chem. B, 2007, 111, 8626–8633 CrossRef CAS PubMed.
- Y. Shin, J. E. Roberts and M. M. Santore, J. Colloid Interface Sci., 2002, 247, 220–230 CrossRef CAS PubMed.
- K. Furusawa, M. Kanesaka and S. Yamashita, J. Colloid Interface Sci., 1984, 99, 341–348 CrossRef CAS.
- S. Schwarz, H. M. Buchhammer, K. Lunkwitz and H. J. Jacobasch, Colloids Surf., A, 1998, 140, 377–384 CrossRef CAS.
- Y. Chen, S. Liu and G. Wang, Chem. Eng. J., 2007, 133, 325–333 CrossRef CAS.
- J. Gregory and I. Sheiham, Br. Polym. J., 1974, 6, 47–59 CrossRef CAS.
- R. J. Hunter, Foundations of Colloid Science, Oxford University Press, United States, 2001, ch. 12.8, pp. 616–617 Search PubMed.
- W. L. Yu, F. Bouyer and M. Borkovec, J. Colloid Interface Sci., 2001, 241, 392–399 CrossRef CAS.
- E. Seyrek, J. Hierrezuelo, A. Sadeghpour, I. Szilagyi and M. Borkovec, Phys. Chem. Chem. Phys., 2011, 13, 12716–12719 RSC.
- J. Gregory and S. Barany, Adv. Colloid Interface Sci., 2011, 169, 1–12 CrossRef CAS PubMed.
- J. Gregory, Colloids Surf., 1988, 31, 231–253 CrossRef CAS.
- E. G. M. Pelssers, M. A. C. Stuart and G. J. Fleer, Colloids Surf., 1989, 38, 15–25 CrossRef CAS.
- Y. Adachi, Adv. Colloid Interface Sci., 1995, 56, 1–31 CrossRef CAS.
- R. Carceller and A. Juppo, Pap. Puu, 2004, 86, 161–163 CAS.
- F. Iselau, P. Restorp, M. Andersson and R. Bordes, Colloids Surf., A, 2015, 483, 264–270 CrossRef CAS.
- K. Böckenhoff and W. R. Fischer, Fresenius' J. Anal. Chem., 2001, 371, 670–674 CrossRef.
- R. Wäsche, M. Naito and V. A. Hackley, Powder Technol., 2002, 123, 275–281 CrossRef.
- W. Brown, Dynamic light scattering: the method and some applications, Clarendon Press, Oxford, 1993 Search PubMed.
- T. Oncsik, G. Trefalt, M. Borkovec and I. Szilagyi, Langmuir, 2015, 31, 3799–3807 CrossRef CAS PubMed.
- A. Labrador, Y. Cerenius, C. Svensson, K. Theodor and T. Plivelic, J. Phys.: Conf. Ser., 2013, 425, 072019 CrossRef.
- J. Ilavsky, J. Appl. Crystallogr., 2012, 45, 324–328 CrossRef CAS.
- S. Chakraborty, B. Sahoo, I. Teraoka and R. A. Gross, Carbohydr. Polym., 2005, 60, 475–481 CrossRef CAS.
- K. Schätzel and J. Merz, J. Chem. Phys., 1984, 81, 2482–2488 CrossRef.
- J. J. M. Swinkels, Starch – Stärke, 1985, 37, 1–5 CrossRef CAS.
- F. Iselau, T. Phan Xuan, A. Matic, M. Persson, K. Holmberg and R. Bordes, Soft Matter, 2016, 12, 3388–3397 RSC.
- D. Kuakpetoon and Y. J. Wang, Carbohydr. Res., 2006, 341, 1896–1915 CrossRef CAS PubMed.
- J. A. De Witt and T. G. M. Van De Ven, Langmuir, 1992, 8, 788–793 CrossRef CAS.
- R. Ferretti, J. Zhang and J. Buffle, Colloids Surf., A, 1997, 121, 203–215 CrossRef CAS.
- L. C. E. Struik, Physical Aging in Amorphous Polymers and Other Materials, Elsevier, Amsterdam, 1978 Search PubMed.
- F. Alvarez, A. Alegra and J. Colmenero, Phys. Rev. B: Condens. Matter Mater. Phys., 1991, 44, 7306–7312 CrossRef.
- S. L. Shamblin, B. C. Hancock, Y. Dupuis and M. J. Pikal, J. Pharm. Sci., 2000, 89, 417–427 CrossRef CAS PubMed.
- E. B. Stukalin, J. F. Douglas and K. F. Freed, J. Chem. Phys., 2008, 129, 094901 CrossRef PubMed.
- S. Yoshioka, Y. Aso and S. Kojima, Pharm. Res., 2001, 18, 256–260 CrossRef CAS.
- S. A. H. R. S. Anderssen and R. J. Loy, Anziam journal, 2004, 45, C800–C816 CrossRef.
- R. M. Syamaladevi, G. V. Barbosa-Cánovas, S. J. Schmidt and S. S. Sablani, Carbohydr. Polym., 2012, 88, 223–231 CrossRef CAS.
- W. A. De Morais, M. R. Pereira and J. L. C. Fonseca, Carbohydr. Polym., 2012, 87, 2376–2380 CrossRef CAS.
- V. A. V. De Oliveira, W. A. De Morais, M. R. Pereira and J. L. C. Fonseca, Eur. Polym. J., 2012, 48, 1932–1939 CrossRef CAS.
- Y. Kawasaki, H. Watanabe and T. Uneyama, Nihon Reoroji Gakkaishi, 2011, 39, 127–131 CrossRef CAS.
- Q. H. Yang, C. J. Qian, H. Li and M. B. Luo, Phys. Chem. Chem. Phys., 2014, 16, 23292–23300 RSC.
- T. Cosgrove, T. L. Crowley, B. Vincent, K. G. Barnett and T. F. Tadros, Faraday Symp. Chem. Soc., 1981, 16, 101–108 RSC.
Footnote |
| † Electronic supplementary information (ESI) available. See DOI: 10.1039/c6sm01312k |
| This journal is © The Royal Society of Chemistry 2016 |

