
 Open Access Article
 This Open Access Article is licensed under a
 Creative Commons Attribution 3.0 Unported Licence
Measuring rotational diffusion of colloidal spheres with confocal microscopy†
Bing
Liu
*abc and
Alexander
Böker
abd
aFraunhofer Institut für angewandte Polymerforschung (IAP), Geiselbergstr. 69, 14476 Potsdam, Germany. E-mail: liubing@iccas.ac.cn
bDWI – Leibniz Institute for Interactive Materials e.V., Lehrstuhl für Makromolekulare Materialien und Oberflächen, RWTH Aachen University, Forckenbeckstr. 50, D-52056 Aachen, Germany
cState Key Laboratory of Polymer Physics and Chemistry, Institute of Chemistry, Chinese Academy of Sciences, 100190, Beijing, China
dLehrstuhl für Polymermaterialien und Polymertechnologien, Universität Potsdam, Geiselbergstrasse 69, 14476 Potsdam, Germany
First published on 15th June 2016
Abstract
We report an experimental method to measure the translational and rotational dynamics of colloidal spheres in three dimensions with confocal microscopy and show that the experimental values reasonably agree with the theoretical values. This method can be extended to study rotational dynamics in concentrated colloidal systems and complex bio-systems.
Measuring the diffusion of colloidal particles in a complex fluid is central for understanding the dynamic behavior of colloids.1 The aging behavior of glassy colloidal systems, the enhanced motion of active colloids, and molecular motors in biological processes are typical examples.2–4 Additionally, colloidal diffusion is reported to be used for exploring the microrheology of soft materials.5,6 The translational diffusion of colloidal spheres is relatively accessible and has been extensively studied. Rotational diffusion, however, is much more difficult to study due to the spherical symmetry of the particles. Several methods to measure the rotational diffusion of colloidal spheres have been reported, including dynamic depolarized light scattering (DDLS),7 dynamic evanescent wave scattering,8 deuteron NMR,9 and polarized fluorescence recovery after photobleaching (pFRAP).10 Structural and dynamic heterogeneities are typically difficult to detect by such ensemble-averaging methods. Also, these methods are not suitable for systems in complex biological environments.11
In recent years, digital video microscopy is attracting much attention as a powerful tool for the direct visualization of colloidal suspensions at a single particle level. Together with advanced computer tracking algorithms, digital video microscopy offers sub-pixel resolution for the identification of the positions of colloidal particles.12 This method is extensively used to track the translational diffusion of both spherical colloids and anisotropic colloids.12–14 Especially for the latter, for examples rods or ellipsoids, this method can also be extended to measure the rotational diffusion by tracking any identifiable optical axis of each particle.13,14 However, this straightforward strategy is not applicable for isotropic spherical colloids due to the lack of such identifiable optical axes. While retaining the advantages of single particle tracking, digital holography microscopy has shown the ability to measure the rotational dynamics of a single particle by recording a 2D holographic interference pattern and then fitting it with appropriate theoretical models. Examples of the measured colloidal particles reported include rods, dumbbells and spheres.15,16 The drawback of this method is its expensive computational process. Modulated optical probes (MOONs) provide another effective way to track colloidal rotation at a single particle level. The probe consists of a fluorescent spherical particle that is half coated with metal. The metal cap can modulate the excitation and emission of fluorescence, resulting in moon-like patterns, thus enabling the tracking of rotation.17,18 Unfortunately, this method is more suitable for the study of a colloidal system in two dimensions.
Traditional bright field microscopy is limited due to its low resolution in the z axis. With a confocal pinhole, confocal microscopy can precisely resolve the positions of colloidal particles in three dimensions.19 As such, confocal microscopy has been widely used for real space imaging of colloidal systems in colloidal physics, concerning a variety of topics such as crystallization, melting and freezing, and glass transition.20–24 Some groups have developed methods based on confocal microscopy to measure the rotation of anisotropic particles.13,14 However, for colloidal spheres, their rotational dynamics have not been greatly explored with confocal microscopy to date. Rotational diffusion of colloidal spheres has been used to explore the decoupling of translational–rotational motion in concentrated colloidal systems.25,26 In this communication, we demonstrate a quantitative method to concurrently measure the translational and rotational diffusion of colloidal spheres with confocal microscopy. Our strategy is to build an identifiable fluorescent optical axis inside colloidal spheres via chemical synthesis while retaining the uniform surface chemistry of each colloidal sphere. To realize this idea, we devised and synthesized eccentric core–shell colloids (Fig. 1a) where the core was marked with one dye and the shell was marked with another dye. The two dyes are readily distinguishable with confocal microscopy; thus, the center of mass of either the core or the shell can be identified independently. The optical axis is referred to the vector from the center of the shell to the center of the core, as shown in Fig. 1a. By following the motion of this optical axis with a confocal microscope, we can determine the rotational dynamics. In this communication, we validate this method for colloidal spheres in dilute suspensions as a proof-of-principle.
 | ||
| Fig. 1 Illustration of the method of measuring rotational diffusion using eccentric colloidal spheres. (a) Schematic model. u(t) is the unit vector from the center of the shell pointing to the center of the core. (b) TEM image of an eccentric particle. The dashed circle indicates the position of the small particle. (c) Single channels of an eccentric particle showing two distinct colors excited by two different laser lines, 458 nm (left) and 561 nm (middle). The red color indicates the position of the shell and the green color indicates the position of the core. The right image in (c) shows an overlay of the two channels. (d) A confocal image overview showing several of the particles shown in (c). The scale bar in (c) is 1 μm. | ||
Monodisperse fluorescent colloidal silica spheres with a diameter of 247 nm (measured by TEM, polydispersity 4.3%: mean value divided by standard deviation) was synthesized as described in ref. 27. The dye molecule rhodamine B isothiocyanate (RITC) was covalently incorporated into the silica spheres to enable visualization under a confocal microscope. The silica spheres were then modified with 3-methacryloxypropyl trimethoxysilane (MPTS) and then grafted with a thin layer (ca. 20 nm) of polystyrene (PS) via emulsion polymerization. Finally, we obtained eccentric core–shell colloidal spheres, denoted as SiO2/poly(MPTS), according to the reported procedure in ref. 28 (Fig. 1b and Fig. S1, ESI†). The core is SiO2 and the shell is the polymerized MPTS. The as-prepared particles have a diameter of 941 nm (measured by TEM, polydispersity 5.7%: mean value divided by standard deviation). The poly(MPTS) shell was marked with the dye coumarin 153.
The SiO2/poly(MPTS) colloidal spheres were dispersed into solvents with very similar refractive indices. We tested two systems: one is a mixture of dimethyl sulfoxide (DMSO) and glycerol (1![[thin space (1/6-em)]](https://www.rsc.org/images/entities/char_2009.gif) :3.53, m/m) (ne,mix = 1.4750, η = 0.23 Pa s) and the other is Triton X-100 (ne = 1.4920, η = 0.33 Pa s). All the measurements were performed with a volume fraction less than 0.005 so that the colloidal spheres formed an extremely dilute suspension where they did not interact with each other. The samples were studied with a laser scanning confocal microscope (Leica TCS SP8 equipped with a 12000 kHz resonant scanner). All images were acquired in fluorescence mode. Two excitation wavelengths, 458 nm and 561 nm, were used for coumarin 153 and RITC, respectively. The scanning time of each series was 1.03 s, achieved by scanning 512 × 256 × 67 pixels with a pixel size of 24 nm in x–y and 150 nm in z. Typically, the data recording requires 500 repeats to achieve reliable statistics. We extracted the positional coordinates of the core and the shell using a standard Interactive Data Language (IDL) route12 and calculated the vector of the optical axis via a home-made program. In order to successfully identify the centers of mass of the core and the shell, it was necessary for us to use two highly distinguishable dyes in a single colloid. As mentioned above, we used RITC for the core and coumarin 153 for the shell. In the free state, RITC typically has excitation and emission peaks at 546 nm and 568 nm and coumarin 153 typically has excitation and emission peaks at 422 nm and 532 nm in ethanol, respectively. We used two different laser lines to excite the dyes separately, and the fluorescence signals were collected by two detector channels. To further avoid crosstalk between the two dyes, we used sequential scanning mode. In this case, either the shell or the core can be imaged independently; therefore, we can also identify their centers of brightness independently (Fig. 1c and d). For the core, the center of brightness is the center of mass, and for the shell, the center of brightness has a slight deviation (<10 nm) from the geometrical center. In this case, the vector of the optical axis of each particle can thus be uniquely tracked, which makes it possible to track those angular displacements to 180°. However, for colloidal particles with symmetries, such as rods, an angular displacement of less than 90° is normally required, as the two ends are not distinguishable.13,14 The trajectories of the center of mass and the orientations of the spheres were obtained by particle tracking.
:3.53, m/m) (ne,mix = 1.4750, η = 0.23 Pa s) and the other is Triton X-100 (ne = 1.4920, η = 0.33 Pa s). All the measurements were performed with a volume fraction less than 0.005 so that the colloidal spheres formed an extremely dilute suspension where they did not interact with each other. The samples were studied with a laser scanning confocal microscope (Leica TCS SP8 equipped with a 12000 kHz resonant scanner). All images were acquired in fluorescence mode. Two excitation wavelengths, 458 nm and 561 nm, were used for coumarin 153 and RITC, respectively. The scanning time of each series was 1.03 s, achieved by scanning 512 × 256 × 67 pixels with a pixel size of 24 nm in x–y and 150 nm in z. Typically, the data recording requires 500 repeats to achieve reliable statistics. We extracted the positional coordinates of the core and the shell using a standard Interactive Data Language (IDL) route12 and calculated the vector of the optical axis via a home-made program. In order to successfully identify the centers of mass of the core and the shell, it was necessary for us to use two highly distinguishable dyes in a single colloid. As mentioned above, we used RITC for the core and coumarin 153 for the shell. In the free state, RITC typically has excitation and emission peaks at 546 nm and 568 nm and coumarin 153 typically has excitation and emission peaks at 422 nm and 532 nm in ethanol, respectively. We used two different laser lines to excite the dyes separately, and the fluorescence signals were collected by two detector channels. To further avoid crosstalk between the two dyes, we used sequential scanning mode. In this case, either the shell or the core can be imaged independently; therefore, we can also identify their centers of brightness independently (Fig. 1c and d). For the core, the center of brightness is the center of mass, and for the shell, the center of brightness has a slight deviation (<10 nm) from the geometrical center. In this case, the vector of the optical axis of each particle can thus be uniquely tracked, which makes it possible to track those angular displacements to 180°. However, for colloidal particles with symmetries, such as rods, an angular displacement of less than 90° is normally required, as the two ends are not distinguishable.13,14 The trajectories of the center of mass and the orientations of the spheres were obtained by particle tracking.
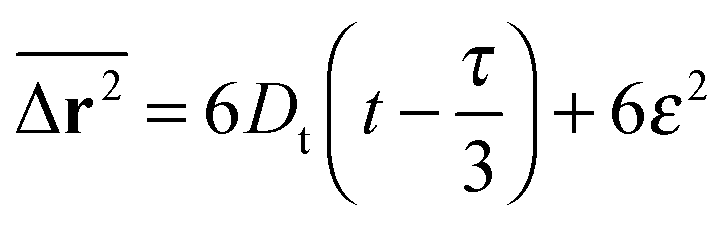
The trajectories of a single particle for the free translational and rotational motions are shown in Fig. 2a and b, respectively, spanning a time period of 515 s (equal to 500 stacks). Sedimentation induced by the density mismatch between the SiO2/poly(MPTS) colloids and the solvent does not show an obvious influence during this measured time period. Following the method suggested by Savin and Doyle,29 we evaluated the static error in determining the coordinates of the rotational optical axis. The colloidal particles were immobilized into a similar sample cell and imaging was performed under the same conditions as the other experiments. The static error was found to be 5.5° in our measurements. For a motion-free colloidal sphere, its translational and rotational diffusions in a viscous solvent are expected to appear Gaussian. Since our method allows us to track the diffusion of each colloidal sphere for all five degrees of freedom, we plotted the probability distribution of both the center of mass translational displacements and the optical axis vector angular displacements in Fig. 3. We typically measured 5 to 15 particles under the same conditions for statistical purposes. Indeed, as shown by the fitting curves (Fig. 3 and Fig. S2, ESI†), they are approximated by Gaussian functions. We also noticed a deviation from Gaussian distribution at large angular displacements for two rotational degrees of freedom; this could originate from the limited statistics, as we found that the large displacement in Δϕ is mainly induced by a small angular displacement in u(t) − u(0) of the optical axis around the polar axis. It should be mentioned that the density mismatch between the silica core and the poly(MPTS) shell also induced a deviation of the geometric center from the center of mass, and this deviation is less than 10 nm in our case by a simplified estimation. This effect should be negligible. We calculated the mean square displacement and mean angular square displacement from these trajectories, and the results are summarized in Fig. 4. To obtain the translational diffusion coefficient, we employed the formula
 | (1) |
 | ||
| Fig. 2 (a) Translational and (b) rotational trajectories of a single particle. The trajectories span a time period of 515 s. The dispersion media is a mixture of glycerol and DMSO. | ||
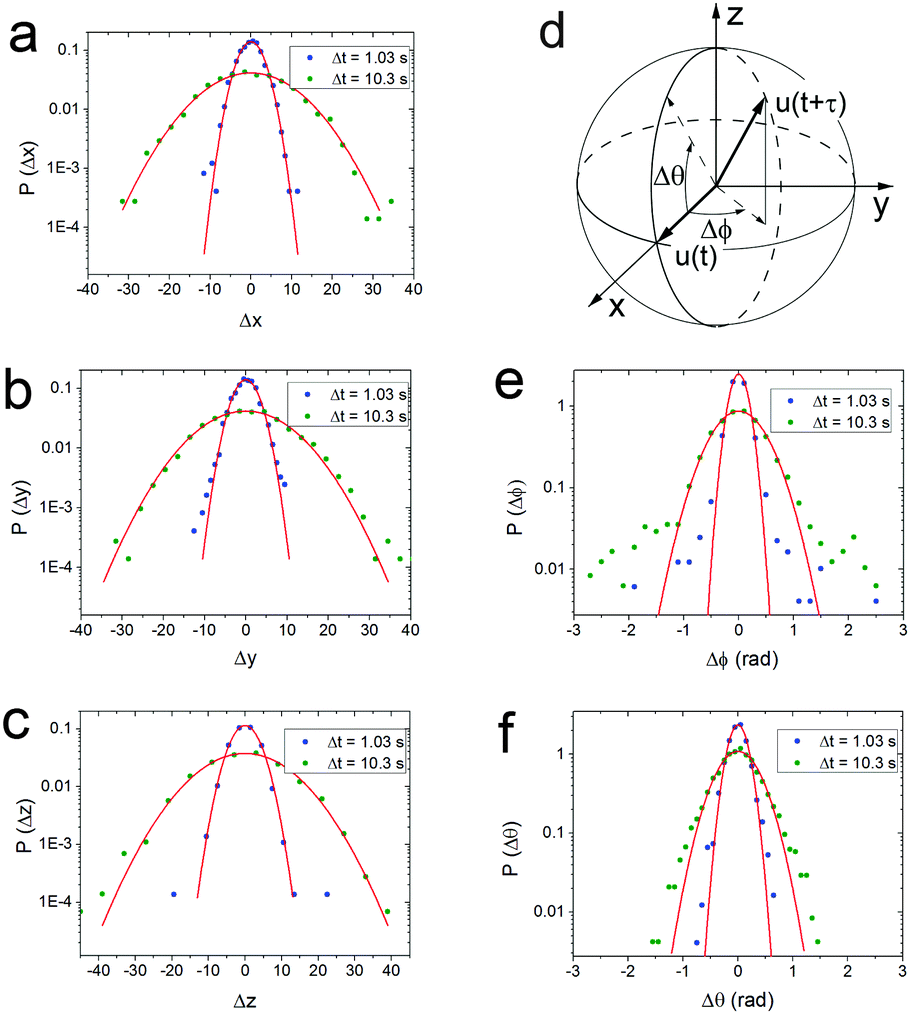 | ||
| Fig. 3 The probability distribution of particle translational (a–c) and rotational (e and f) displacements. Each plot was fitted with a single Gaussian function (red curves). The blue dots are for Δt = 1.03 s and the green dots are for Δt = 10.30 s. The dispersion media is a mixture of glycerol and DMSO. A schematic of one coordinate system for colloidal sphere rotation is shown in (d). | ||
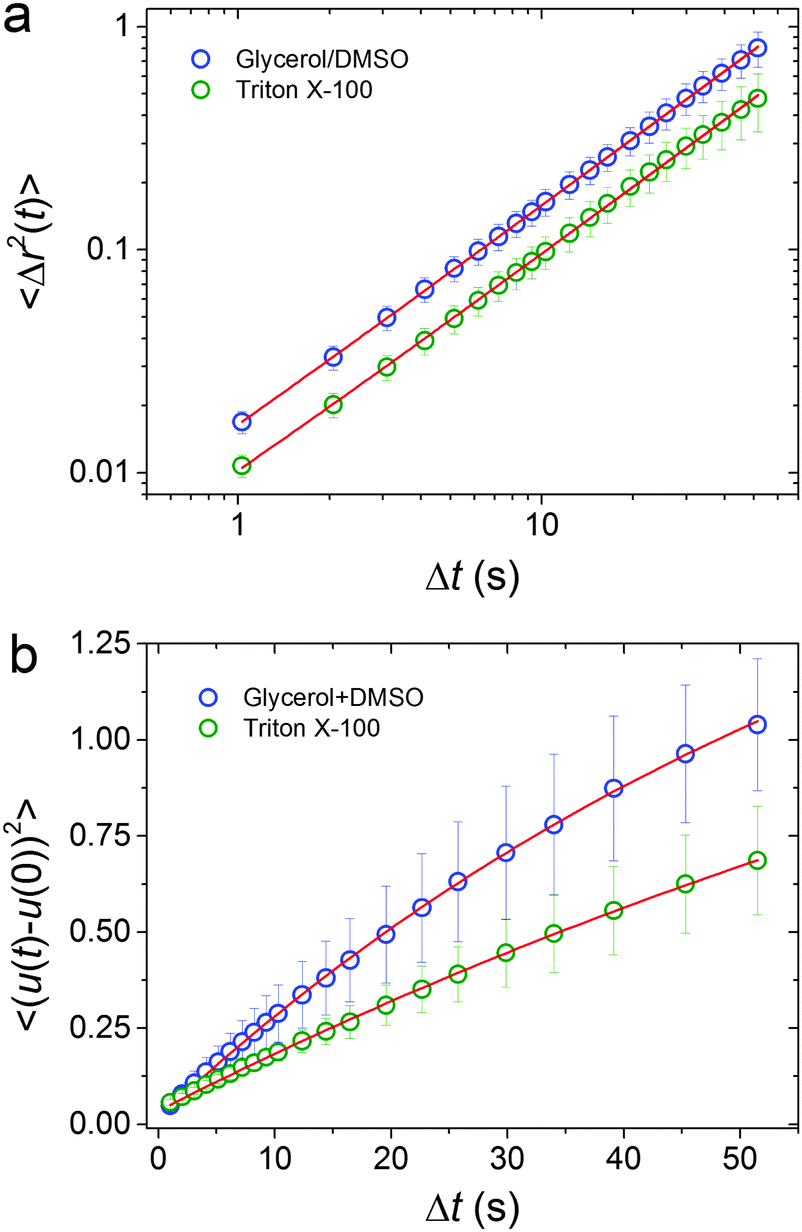 | ||
| Fig. 4 The mean square displacements (a) and the mean angular square displacements (b) of eccentric core–shell SiO2/poly(MPTS) colloidal spheres. Two dispersing media were used: a mixture of glycerol and DMSO, and Triton X-100. The circles are data, calculated from the measurements, and the solid curve is the fit with formula (1) for translational motion and formula (2) for rotational motion. The mass ratio of glycerol to DMSO is 3.53. | ||
To obtain the rotational diffusion coefficient, we employed the formula
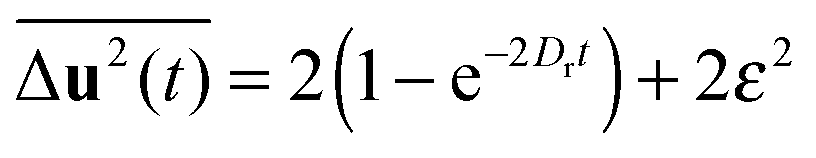 | (2) |
As a second test, we used Triton X-100 as the solvent instead of the mixture of DMSO and glycerol. Following a similar procedure, we obtained a translational diffusion coefficient Dt = 1.56 ± 0.06 × 10⁻³ μm2 s−1 with an estimated error ε ≈ 40 nm and a rotational diffusion coefficient Dr = 3.83 ± 0.08 × 10⁻³ rad2 s−1 with an estimated error ε ≈ 7.7°. A comparison between the measured values and the theoretical values is summarized in Table 1. The theoretical values were calculated via the Stokes–Einstein equation for the translational diffusion coefficient and via the Stokes–Einstein–Debye equation for the rotational diffusional coefficient. The relative error for the latter is 5% for DMSO/glycerol and 19% for Triton X-100. In the following section, we briefly discuss several possible origins of the error. Firstly, the mismatch of the refractive indices between the silica core and poly(MPTS) and the dispersion media and the point spread function are known to induce a distortion of axial distance along the z axis,30 which induced an error in the determination of the vector of the optical axis. In addition to performing a correction based on either experimental measurements or theoretical considerations, a simple solution would be using the same materials for both the core and the shell by a synthetic route, which is also expected to be easily index-matched by the solvents. Secondly, photo-bleaching of the used fluorescent markers is also a known problem for long-time imaging. The resulting decrease in the signal/noise ratio can increase the error in determining the center of brightness. The third origin of error could be from the polydispersity of the model colloids, as it is close to 6% in our case. This can be improved by improving the monodispersity of the colloids.
| Solvent | D t (μm2 s−1) | D r (s−1) | ||
|---|---|---|---|---|
| Theo. | Exp. | Theo. | Exp. | |
| Glycerol/DMSO | 1.99 × 10⁻³ | 2.60 × 10⁻³ | 6.74 × 10⁻³ | 7.04 × 10⁻³ |
| Triton X-100 | 1.38 × 10⁻³ | 1.56 × 10⁻³ | 4.70 × 10⁻³ | 3.83 × 10⁻³ |
Conclusions
In summary, we report a confocal microscopy method for concurrently tracking the translational and rotational dynamics of colloidal spheres in three dimensions. As a proof-of-concept, we devised and synthesized bicolor colloidal spheres with an eccentric core–shell structure and measured their translational and rotational dynamics in two different dilute systems. We found the measured values to reasonably agree with the theoretical values which were calculated via the Stokes–Einstein and Stokes–Einstein–Debye equations. Because this method is based on confocal microscopy, it can be applied in 3D to concentrated colloidal systems, soft materials systems (such as gel, glass, etc.) and complex bio-systems.Acknowledgements
We thank Prof. Jiajia Zhou in Beihang University for helpful discussion and critical reading of the manuscript.References
- W. B. Russel, D. A. Saville and W. R. Schowalter, Colloidal Dispersions, Cambridge University Press, 1999 Search PubMed.
- S. Jabbari-Farouji, G. H. Wegdam and D. Bonn, Phys. Rev. E: Stat., Nonlinear, Soft Matter Phys., 2012, 86, 041401 CrossRef CAS PubMed.
- Y. Peng, L. Lai, Y.-S. Tai, K. Zhang, X. Xu and X. Cheng, Phys. Rev. Lett., 2016, 116, 068303 CrossRef PubMed.
- K. Adachi, R. Yasuda, H. Noji, H. Itoh, Y. Harada, M. Yoshida and K. Kinosita, Jr., Proc. Natl. Acad. Sci. U. S. A., 2000, 97, 7243–7247 CrossRef CAS PubMed.
- T. G. Mason and D. A. Weitz, Phys. Rev. Lett., 1995, 74, 1250–1253 CrossRef CAS PubMed.
- Z. Cheng and T. G. Mason, Phys. Rev. Lett., 2003, 90, 018304 CrossRef CAS PubMed.
- V. Degiorgio, R. Piazza and R. B. Jones, Phys. Rev. E: Stat. Phys., Plasmas, Fluids, Relat. Interdiscip. Top., 1995, 52, 2707–2717 CrossRef CAS.
- S. A. Rogers, M. Lisicki, B. Cichocki, J. K. G. Dhont and P. R. Lang, Phys. Rev. Lett., 2012, 109, 098305 CrossRef CAS PubMed.
- J. Kanetakis, A. Tölle and H. Sillescu, Phys. Rev. E: Stat. Phys., Plasmas, Fluids, Relat. Interdiscip. Top., 1997, 55, 3006–3014 CrossRef CAS.
- M. P. Lettinga, G. H. Koenderink, B. W. M. Kuipers, E. Bessels and A. P. Philipse, J. Chem. Phys., 2004, 120, 4517–4529 CrossRef CAS PubMed.
- L. Sanchez, P. Patton, S. M. Anthony, Y. Yi and Y. Yu, Soft Matter, 2015, 11, 5346–5352 RSC.
- J. C. Crocker and D. G. Grier, J. Colloid Interface Sci., 1996, 179, 298–310 CrossRef CAS.
- A. Mohraz and M. J. Solomon, Langmuir, 2005, 21, 5298–5306 CrossRef CAS PubMed.
- B. Liu, T. H. Besseling, M. Hermes, A. F. Demirörs, A. Imhof and A. van Blaaderen, Nat. Commun., 2014, 5, 3092 Search PubMed.
- F. C. Cheong and D. G. Grier, Opt. Express, 2010, 18, 6555–6562 CrossRef CAS PubMed.
- A. Wang, T. G. Dimiduk, J. Fung, S. Razavi, I. Kretzschmar, K. Chaudhary and V. N. Manoharan, J. Quant. Spectrosc. Radiat. Transfer, 2014, 146, 499–509 CrossRef CAS.
- J. Behrend, J. N. Anker, B. H. McNaughton, M. Brasuel, M. A. Philbert and R. Kopelman, J. Phys. Chem. B, 2004, 108, 10408–10414 CrossRef.
- S. M. Anthony, L. Hong, M. Kim and S. Granick, Langmuir, 2006, 22, 9812–9815 CrossRef CAS PubMed.
- D. Dinsmore, E. R. Weeks, V. Prasad, A. C. Levitt and D. A. Weitz, Appl. Opt., 2001, 40, 4152–4159 CrossRef PubMed.
- P. Tan, N. Xu and L. Xu, Nat. Phys., 2014, 10, 73–79 Search PubMed.
- A. van Blaaderen and P. Wiltzius, Science, 1995, 270, 1177–1179 CrossRef CAS.
- U. Gasser, E. R. Weeks, A. Schofield, P. N. Pusey and D. A. Weitz, Science, 2001, 292, 258–262 CrossRef CAS PubMed.
- E. R. Weeks, J. C. Crocker, A. C. Levitt, A. Schofield and D. A. Weitz, Science, 1999, 287, 627–630 CrossRef.
- A. Yethiraj and A. van Blaaderen, Nature, 2003, 421, 513–517 CrossRef CAS PubMed.
- S. Jiang, J. Yan, J. K. Whitmer, S. M. Anthony, E. Luijten and S. Granick, Phys. Rev. Lett., 2014, 112, 218301 CrossRef.
- K. V. Edmond, M. T. Elsesser, G. L. Hunter, D. J. Pine and E. R. Weeks, Proc. Natl. Acad. Sci. U. S. A., 2012, 109, 17891–17896 CrossRef CAS PubMed.
- N. A. M. Verhaegh and A. van Blaaderen, Langmuir, 1994, 10, 1427–1438 CrossRef CAS.
- S. Sacanna, M. Korpics, K. Rodriguez, L. Colón-Meléndez, S.-H. Kim, D. J. Pine and G.-R. Yi, Nat. Commun., 2013, 4, 1688 CrossRef PubMed.
- T. Savin and P. S. Doyle, Biophys. J., 2005, 88, 623–638 CrossRef CAS PubMed.
- A. Diaspro, F. Federici and M. Robello, Appl. Opt., 2002, 41, 685–690 CrossRef PubMed.
Footnote |
| † Electronic supplementary information (ESI) available: Details of the synthesis of model colloids and supporting figures. See DOI: 10.1039/c6sm01082b |
| This journal is © The Royal Society of Chemistry 2016 |