
 Open Access Article
 This Open Access Article is licensed under a Creative Commons Attribution-Non Commercial 3.0 Unported Licence
Predicting the dynamic impact behaviour of spray droplets on flat plant surfaces
M. A.
Delele
*a,
D.
Nuyttens
b,
A. T.
Duga
a,
A.
Ambaw
c,
F.
Lebeau
d,
B. M.
Nicolai
a and
P.
Verboven
a
aKU Leuven-University of Leuven, Division BIOSYST-MeBioS, Willem de Croylaan 42, 3001 Heverlee, Belgium. E-mail: mulugetaadmasu.delele@kuleuven.be
bInstitute for Agricultural and Fisheries Research (ILVO), Technology and Food Science Unit, Agricultural Engineering, Burgemeester Van Gansberghelaan 115, bus 1, 9820 Merelbeke, Belgium
cStellenbosch University, South African Research Chair in Postharvest Technology, Stellenbosch, South Africa
dUniversity of Liege, Gembloux Agro-BioTech, UMC, Passages des Déportés 2, 5030 Gembloux, Belgium
First published on 2nd August 2016
Abstract
The dynamic impact behaviour of water droplets on plant surfaces was investigated based on a multiphase computational fluid dynamics (CFD) model. The study was conducted using the Volume Of Fluid (VOF) approach. The static contact angle of water droplets on leaf surfaces of different plants (apple, pear, leek and cabbage) was measured and found to vary between 54.9 and 138.2°. Impact experiments were conducted by monitoring the flow and impact characteristics of water droplets on leaves in still air with a high speed camera. Droplets were generated by an agricultural flat fan spray nozzle moving across the leaf at constant speed. The nozzle produced droplets with diameters ranging from 20.6 up to 550.8 μm, and droplet velocity values near the impact between 0.03 and 13.2 m s−1. The CFD model was capable of predicting the observed dynamic impact behaviour of droplets on the plant surfaces. The fate of the droplets after the impact process for adhesion, bouncing or splashing was accurately predicted for Weber numbers (We) in the range of 0.007 to 1096 and droplet Reynolds numbers (Re) between 5 to 8000. The process was highly dependent on the surface and droplet flow characteristics during the impact. Combinations of We, Re and Ohnesorge (Oh) numbers defined the droplet maximum spread factor, the number of secondary droplets generated as a result of the splashing process and the transition between the different impact outcomes. These criteria can then be used in field scale spray deposition and drift models to better understand agricultural spray operations.
1. Introduction
In agriculture and horticulture, there are several areas where liquid droplets interact with plant surfaces, such as spraying of crop protection chemicals, irrigation and rainfall.1,2 During application of crop protection chemicals, it is important to optimize the amount and uniformity of the on-target deposition while avoiding exceeding residue levels and minimizing run-off and drift with consequent environmental risks.3–5 During irrigation, the amount of liquid that is intercepted by the plant canopy affects the performance of irrigation systems. Canopy interception is considered as one of the causes of water loss, and a reduction in the plant transpiration rate due to canopy interception was also reported.6,7 Leaves also intercept rainfall.8 Intercepted rain can cause erosion of waxes from leaf surfaces and favours the development and dispersion of pathogens.9,10Understanding the impact characteristics of the liquid droplets on the plant surfaces helps in optimizing the required outputs and minimizing unwanted phenomena. The droplet-surface interaction is a complex, dynamic multiphase process that determines the final fate of the impacted droplets.4 Upon impact, a droplet first spreads due to its kinetic energy to the maximum possible spread area. Then due to the surface tension it starts to recoil back. This spread-recoiling process is associated with the loss of energy. Depending on the impact characteristics, droplets can adhere to the surface, bounce from the surface or shatter.11,12 The influencing parameters include physical and chemical properties of the liquid, droplet size, velocity and impact direction, surface morphology of the plant surface and microclimate conditions.2,4,5,13,14
Mathematical models have been presented as alternatives to the tedious and expensive field/laboratory studies for studying the droplet impact on plants.5,12,15–21 Few of these models are empirical,19 while most have been developed using physical principles.5,12,15,20,21 Duga et al.16,17 and Endalew et al.18 developed a 3D canopy deposition model in the framework of a Lagrangian droplet tracking model which used a stochastic model to decide droplet deposition. No distinction was made between types of impact. Dorr et al.5 presented a 3D model of the droplet impact on cotton, wheat and chenopodium leaves that was capable of predicting the final fate of the impacted droplet, whether it was adhered, bounced or shattered. The model was based on scanned leaf images and applied a combined ballistic and random walk approach to model the movement of the droplets through the air. The model only predicted the final output of the impacting process without considering the impact dynamics, and assumed droplets impacting perpendicular to a horizontal leaf surface. Recently Massinon et al.22 studied the variability of spray retention using a 3-D model of a superhydrophobic leaf surface coupled with small and slanted leaves in relation to spray quality, applied volume, plant size and orientation and liquid formulation. The 3D architecture of a barley plant, the spray quality and the droplet impact behavior were measured and used as an input to the model. Similar to the model of Dorr only the final fate of the impacted droplet was calculated.
Based on a review of the literature, Glass et al.23 concluded that CFD models have the potential to provide accurate predictions of pesticide droplet flow on leaf surfaces by taking into account the influences of each of the key parameters (surface topography and chemistry, initial spray deposition conditions, evaporation and multiple droplet spreading interactions). Multiphase computational fluid dynamic (CFD) models based on the Volume Of Fluid (VOF) approach have been used to study the dynamic behavior of droplet surface interactions in different systems,24–30 but not yet for droplet-plant interactions. The VOF has the ability to dynamically capture the interface between the gas and the liquid phases and determine the droplet surface impact characteristics by taking into account the properties of the liquid and the surrounding air, droplet impact characteristics and surface morphology.
The aim of this study was to develop and validate a 3-D two-phase CFD model of the dynamic impact behavior of water droplets on plant surfaces to improve predictive models of deposition and drift of agricultural spray operations. The study relied on experimental measurements to generate model parameters and for validation of the simulations. The model was applied to investigate the dynamics of the droplet impact process on different leaf surfaces of important agricultural and horticultural crops that require spray applications for pest management. The model was also used to predict the outcome of the impact in terms of adhesion, bouncing or splashing/shattering using agricultural spray nozzles that typically generate a wide range of values of important droplet characteristics such as droplet velocity and diameter. The used agricultural spray nozzle in this work produced water droplets with diameters between 20.6 and 550.8 μm, and droplet velocity values upon impact between 0.03 and 13.2 m s−1.
2. Materials and methods
2.1. Experimental studies
Different experiments were conducted to determine model parameters and for the validation of the developed model. Validation experiments were conducted to obtain the dynamics and the outcome of the impact process of the droplet on the plant surfaces. The experiments were conducted using distilled water.| Liquid | Density (kg m−3) | Viscosity (Pa s) | Surface tension (N m−1) | Contact angle per leaf type (°) | |||
|---|---|---|---|---|---|---|---|
| Apple | Pear | Leek | Cabbage | ||||
| Distilled water | 1000 | 0.001 | 0.073 | 54.9 ± 6.6 | 68.1 ± 11.2 | 113.7 ± 27.4 | 138.2 ± 13.1 |
![[thin space (1/6-em)]](https://www.rsc.org/images/entities/char_2009.gif) 000 frames per s. A leaf sample was placed in between the high speed camera and the light source (19LED, Integrated Design Tools, Florida, USA) (Fig. 1). There was a distance of 0.50 m between the light source and target surface.
000 frames per s. A leaf sample was placed in between the high speed camera and the light source (19LED, Integrated Design Tools, Florida, USA) (Fig. 1). There was a distance of 0.50 m between the light source and target surface.
 | ||
| Fig. 1 Experimental set-up for determining the droplet impact characteristics. | ||
The velocity and diameter of the impacting droplets were determined using image processing with the software Motion Studio (Integrated Design Tools, Florida, USA). Droplet diameters (μm) were calculated from the product of the pixel number that was taken by counting the number of image pixels on a line from one side of the droplet through the centre of the droplet to the other, multiplied with the spatial resolution of the image (10.8 μm per pixel). The velocity of the droplets (m s−1) was calculated based on the droplet movement between the nth and n + 10th frames, the spatial resolution of the image and the frame rate of the camera.
A single droplet was generated using a droplet generator (Université de Liège, Gembloux, Agro-Bio-Tech, Belgium) and used to validate the predicted result of the dynamic behaviour of the impact of the water droplet on the plant surfaces. The droplet generator was working using a piezoelectric element that can be driven with voltages up to 60 V.31 This study investigated the dynamics of the impact process of the water droplet with a diameter of 310 μm and an impact velocity of 2.8 m s−1 on a cabbage leaf.
To investigate the output of the impact process, experiments were conducted using a commercial spray nozzle. The target surface was fixed on a mounting stage under the moving spray nozzle at a position where it was possible to capture a sufficient number of droplets in the field of view. The nozzle was moving at a speed of 2 m s−1, perpendicular to the direction of the camera and the light source; the speed representative of field spraying operations. A flat fan nozzle type 11004VS (TeeJet Technologies, Illinois, USA) at a liquid pressure of 3 bar was used. The nozzle produced droplets with a wide spectrum of droplet size (20.6 to 550.8 μm) and impacting velocity (0.03 and 13.2 m s−1). A small strip of leaf, about 0.5 cm wide and 5 cm in length, was cut and used as a target plant surface. Using bigger strips caused problems in terms of visualisation. In this work, only droplets under perpendicular impact were considered.
2.2. Impact dynamics and dimensionless numbers
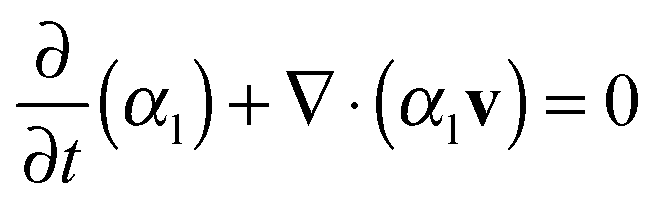
Dimensionless numbers were used to define the droplet maximum spread factor, the number of secondary droplets generated as a result of the splashing process and the transition between the different impact outcomes. The main dimensionless numbers that govern the dynamic impact process are the Weber number (We) and the Reynolds number (Re).2,32,33 We expresses the ratio of inertia to surface tension forces and Re gives the ratio of inertia to viscous forces. The Ohnesorge (Oh) number combines We and Re to provide a ratio of viscous to combined inertia and surface tension forces: | (1) |
 | (2) |
 | (3) |
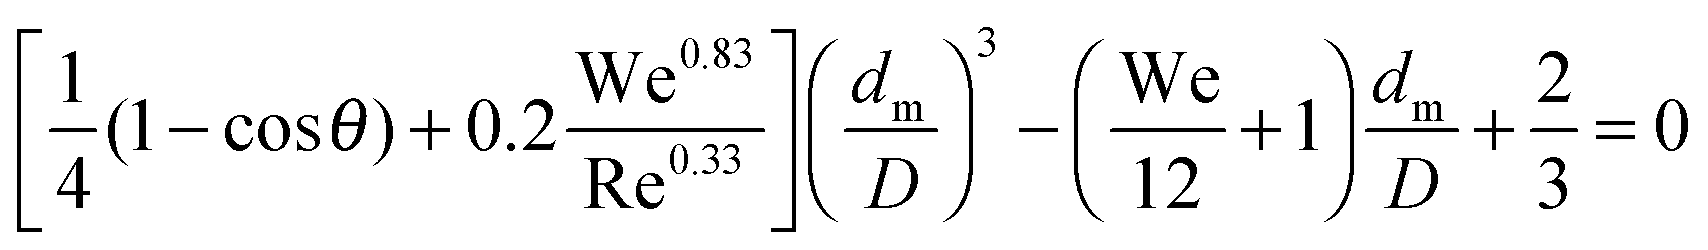
Mao et al.34 presented an energy balance model of the droplet impact that is capable of calculating the maximum spread diameter (dm) from the droplet diameter (D), static contact angle (θ), We and Re:
 | (4) |
 less than 6, the agreement between the measured and predicted results was within a confidence level of 90%. Due to the flat disk assumption that was made in developing the model, there was a significant decrease in the accuracy of the model for lower impact velocities (less than 1 m s−1). The model prediction was also compared to literature data35–37 that were collected on a wide range of impact velocities (1.4–28 m s−1), viscosities (0.001–0.296 Pa s), surface tensions (0.025–0.073 N m−1), static contact angles (34–100°) and droplet sizes (40–3700 μm). Predicted results showed an agreement to the literature data with a similar confidence level as above, so the equations appear valid for a wide range of We and Re values.
Mundo et al.38 conducted an extensive experimental study of the droplet impact on a stainless steel surface for a smaller range of droplet diameter values (60–150 μm). They measured much higher values of impact velocity (12–18 m s−1), and considered variations of surface tension (0.022–0.072 N m−1), viscosity (0.001–0.0029 Pa s) and surface roughness (mean roughness heights of 2.8 and 78 μm). The study reported the surface profile data that showed the amplitude of surface roughness and the type of topographical features. The surface with the highest mean roughness height had a highly variable surface profile. Contact angles were not reported. The corresponding range of impact Re and We values were 195–2694 and 94–2204, respectively. Compared to the smooth surface, the rough surface produced a more irregular droplet deformation pattern. During splashing, the rough surface produced secondary droplets which were smaller in mean diameter and narrower in droplet size distribution. This study developed an empirical relation that defined the boundary between deposition and splash regions using:
| Oh·Re1.25 = K | (5) |
2.3. VOF model
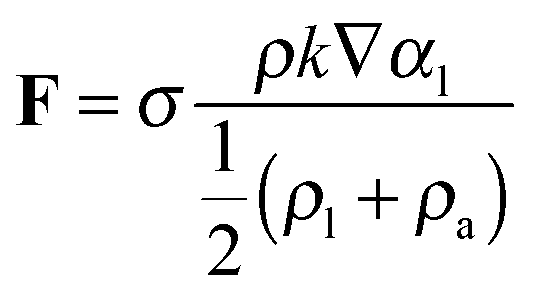
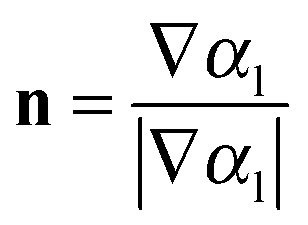
The VOF method solves a single set of momentum equations while computing the volume fraction of each of the phases, resulting in effective fluid properties throughout the computational domain. At the air-droplet interface, a continuum force model is applied to account for surface tension. | (6) |
 | (7) |
The apparent density and viscosity in each cell were calculated using:
| ρ = αlρl + (1 − αl)ρa | (8) |
| μ = αlμl + (1 − αl)μa | (9) |
 | (10) |
| αa = 1 − αl | (11) |
 | (12) |
| k = −(∇·n) | (13) |
 | (14) |
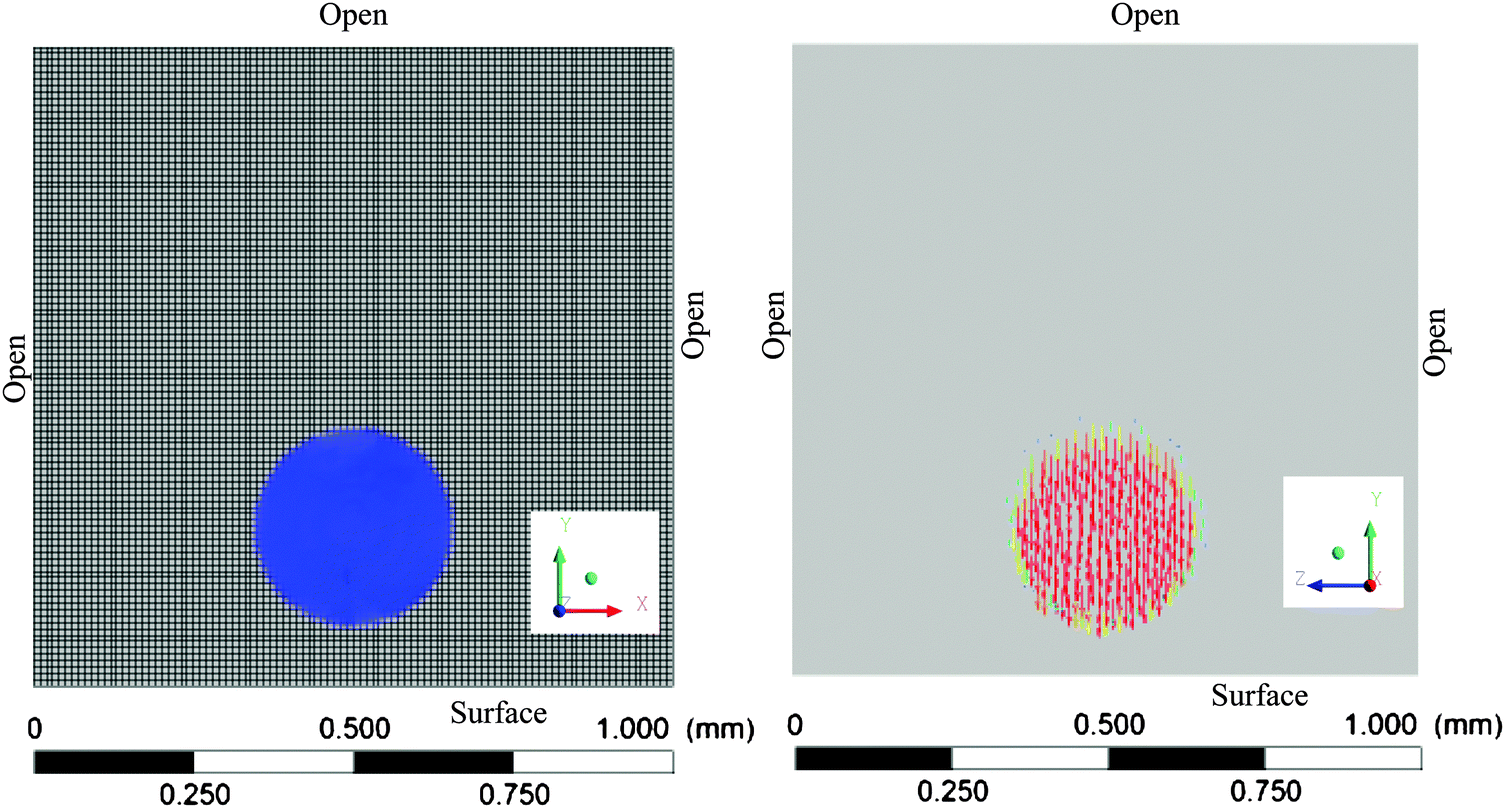 | ||
| Fig. 2 Typical discretized computational domain showing the initial position of a 300 μm droplet (left), impact velocity vector (right) and the boundary conditions; blue represents a liquid volume fraction of 1; red represents an initial impact velocity of 2 m s−1. | ||
The plant surface was taken as a flat no slip wall and the rest of the boundaries were defined as pressure outlets. To predict the contact behaviour of the droplet on the plant surface, the wall adhesion model of Brackbill et al.41 was applied. In this model the contact angle of the droplet on the wall is used to determine the droplet surface normal in computational cells near the wall (n = (ntsinθ + nwcosθ)), where nw and nt are the unit vectors normal and tangential to the wall, respectively. The dynamic boundary condition results in the adjustment of the curvature of the surface near the wall. The model input parameters that include the measured static contact angles of the droplets on the leaf surfaces, the viscosity and surface tension of the liquid are given in Table 1. Initially, the droplets were placed at a small prescribed distance of 0.1 mm above the contact surface with an initial (impact) velocity (Fig. 2). Initially the surrounding air was assumed to have zero velocity and 101.3 kPa pressure, and it was considered as compressible gas.
A fractional step algorithm was used for pressure-velocity coupling. The continuity, momentum and volume fraction equations were solved using the PRESTO, QUICK and compressive method, respectively, for spatial discretization. Time discretization used the first order implicit method. A time step size of 1 × 10⁻⁷ s was needed to capture the important features of the impact dynamics of the droplet on the plant surface. The selected mesh size and time steps fulfilled the criteria of the maximum Courant number 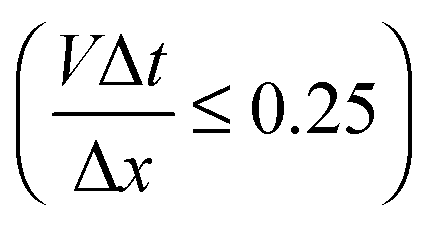 of the simulation that was set to 0.25. V is the impact velocity (m s−1), Δt is the time step (s) and Δx is the grid size (m). The calculations were performed on a 64-bit, Intel® Core™ i7-4790 CPU, 3.60 GHz, 32 Gb RAM, Windows 7 Professional computer and the CPU time of calculation was up to 76 h.
3. Results and discussion
3.1. Impact dynamics of the droplet with no splashing
The impact process of water droplets during collision on hydrophilic (late season apple leaf with a static contact angle of 54.7°) and hydrophobic (young cabbage leaf with a static contact angle of 138.2°) plant surfaces is shown in Fig. 3a and b, respectively, for a 300 μm droplet impacting at 2 m s−1. The droplet was impacting vertically on a horizontal surface (impact angle equal to 90°). This impact angle was considered throughout this study. The corresponding Weber and Reynolds numbers were 16.4 and 600, respectively. As the liquid droplet makes contact with the plant surface, it starts to spread radially and forms a lamella and rim. For these impact We and Re numbers, droplets either deposited on the leaf or bounced from the surface. On hydrophilic plant surfaces (static contact angle <90°), after recoiling and a series of oscillations, the droplet reached its equilibrium position and got deposited (Fig. 3a). This deposition showed that the droplet that impacted on an old apple leaf at We = 16.4 and Re = 600 did not have enough energy to overcome the adhesive force of the surface. On the hydrophobic plant surfaces (static contact angle >90°), after recoiling the droplet bounced back from the surface (Fig. 3b). Such an impact on the hydrophobic young cabbage surface indicated that the droplet maintained enough kinetic energy to rebind after recoiling. For lower Weber numbers (We < 0.3) the droplet did not have enough energy to bounce back from hydrophobic plant surfaces.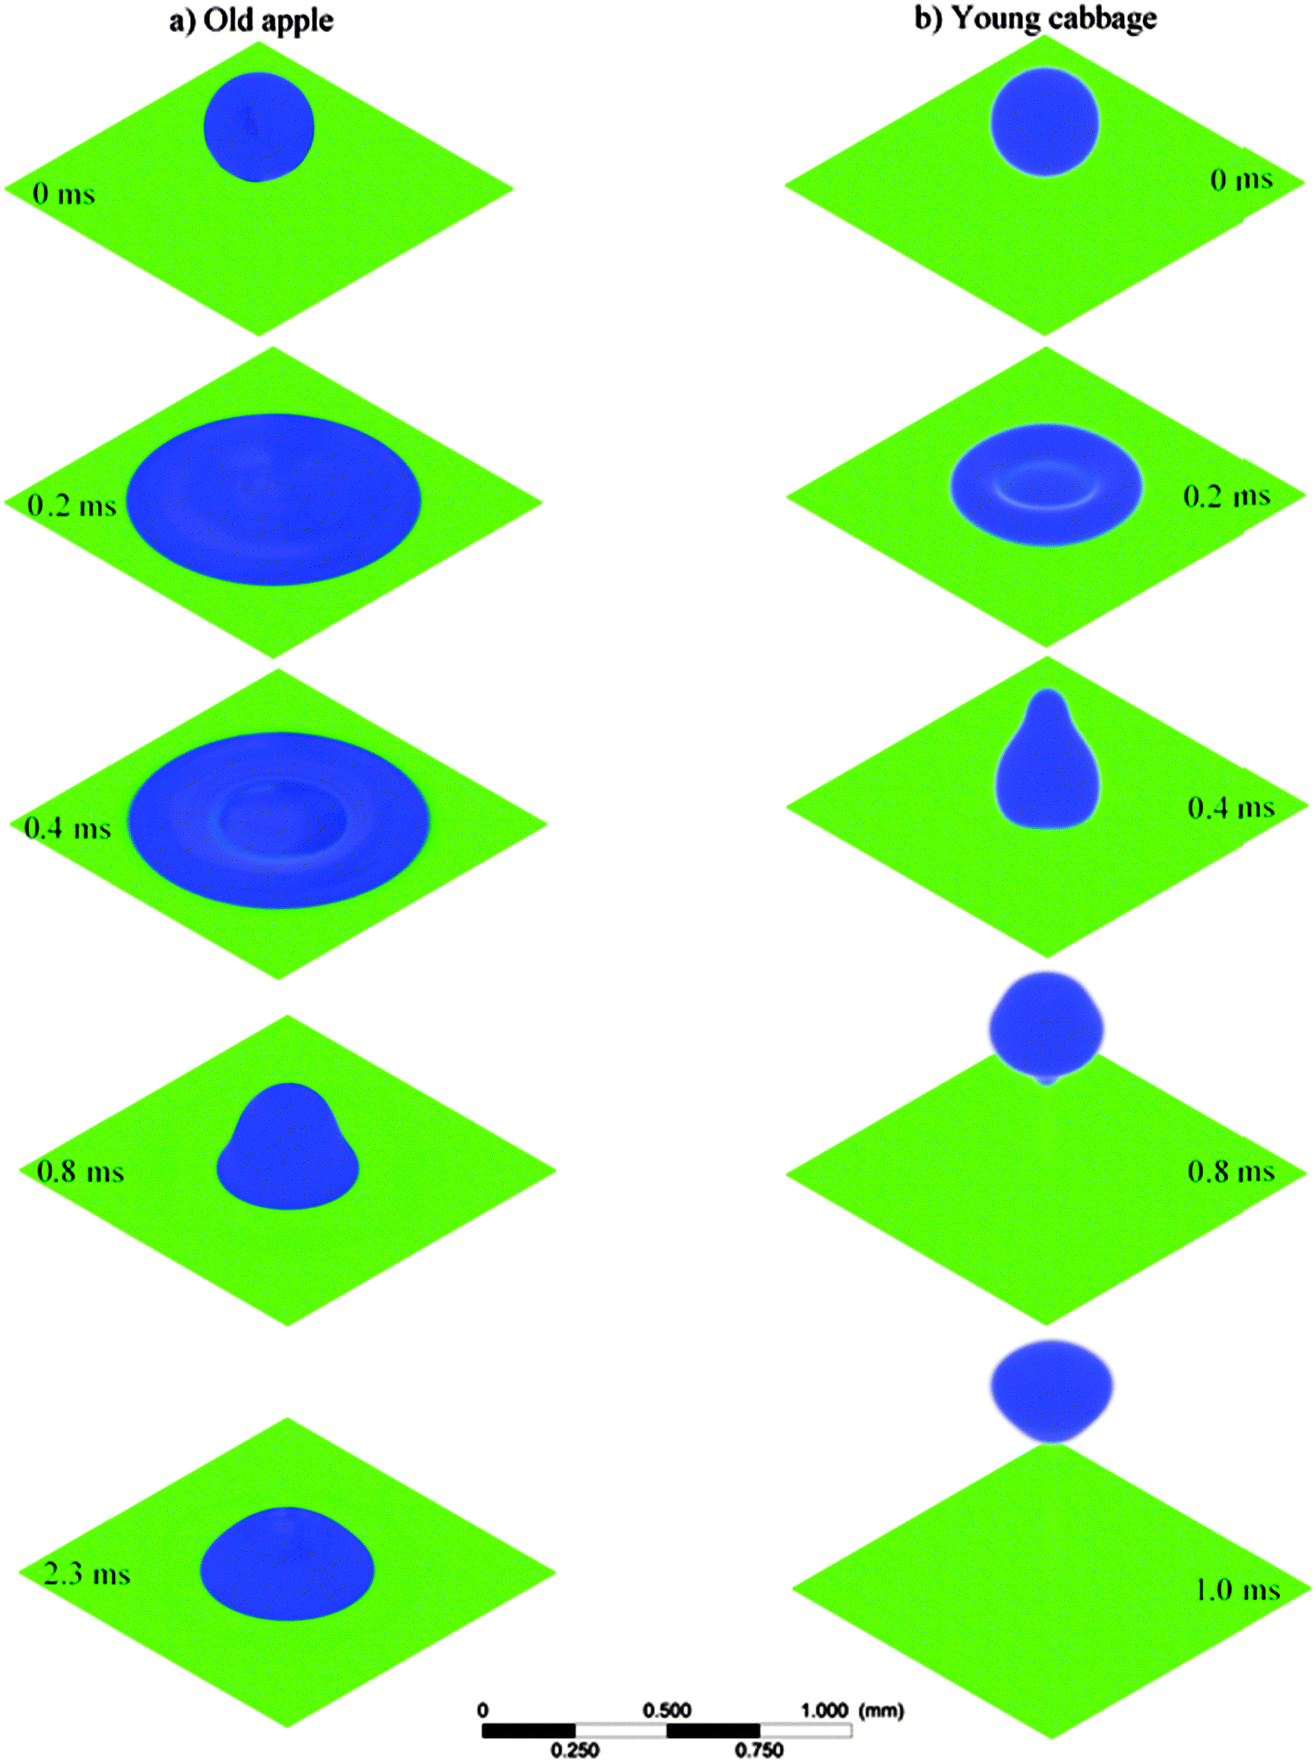 | ||
| Fig. 3 Predicted dynamic behavior of a 300 μm diameter water droplet during the impact on a horizontally placed leaf of (a) old apple and (b) young cabbage with a vertical impact velocity of 2 m s−1; blue represents liquid volume fraction of 1 and the time after the impact is given in milliseconds. | ||
The velocity distribution during the spreading and recoiling of the droplet after its impact on the old apple leaf is given in Fig. 4a. After the impact the liquid flow changes from vertical to radial during the spreading phase. As the spread progresses, there is a decrease in radial velocity. When it reaches the maximum possible spread diameter, it starts to recoil back and finally attains the equilibrium state and adheres to the surface. The velocity distribution during the impact process of the droplet on the young cabbage leaf (Fig. 4b) was different from that of the old apple leaf (Fig. 4a). During the bouncing stage, there was a generation of a relatively high upward velocity.
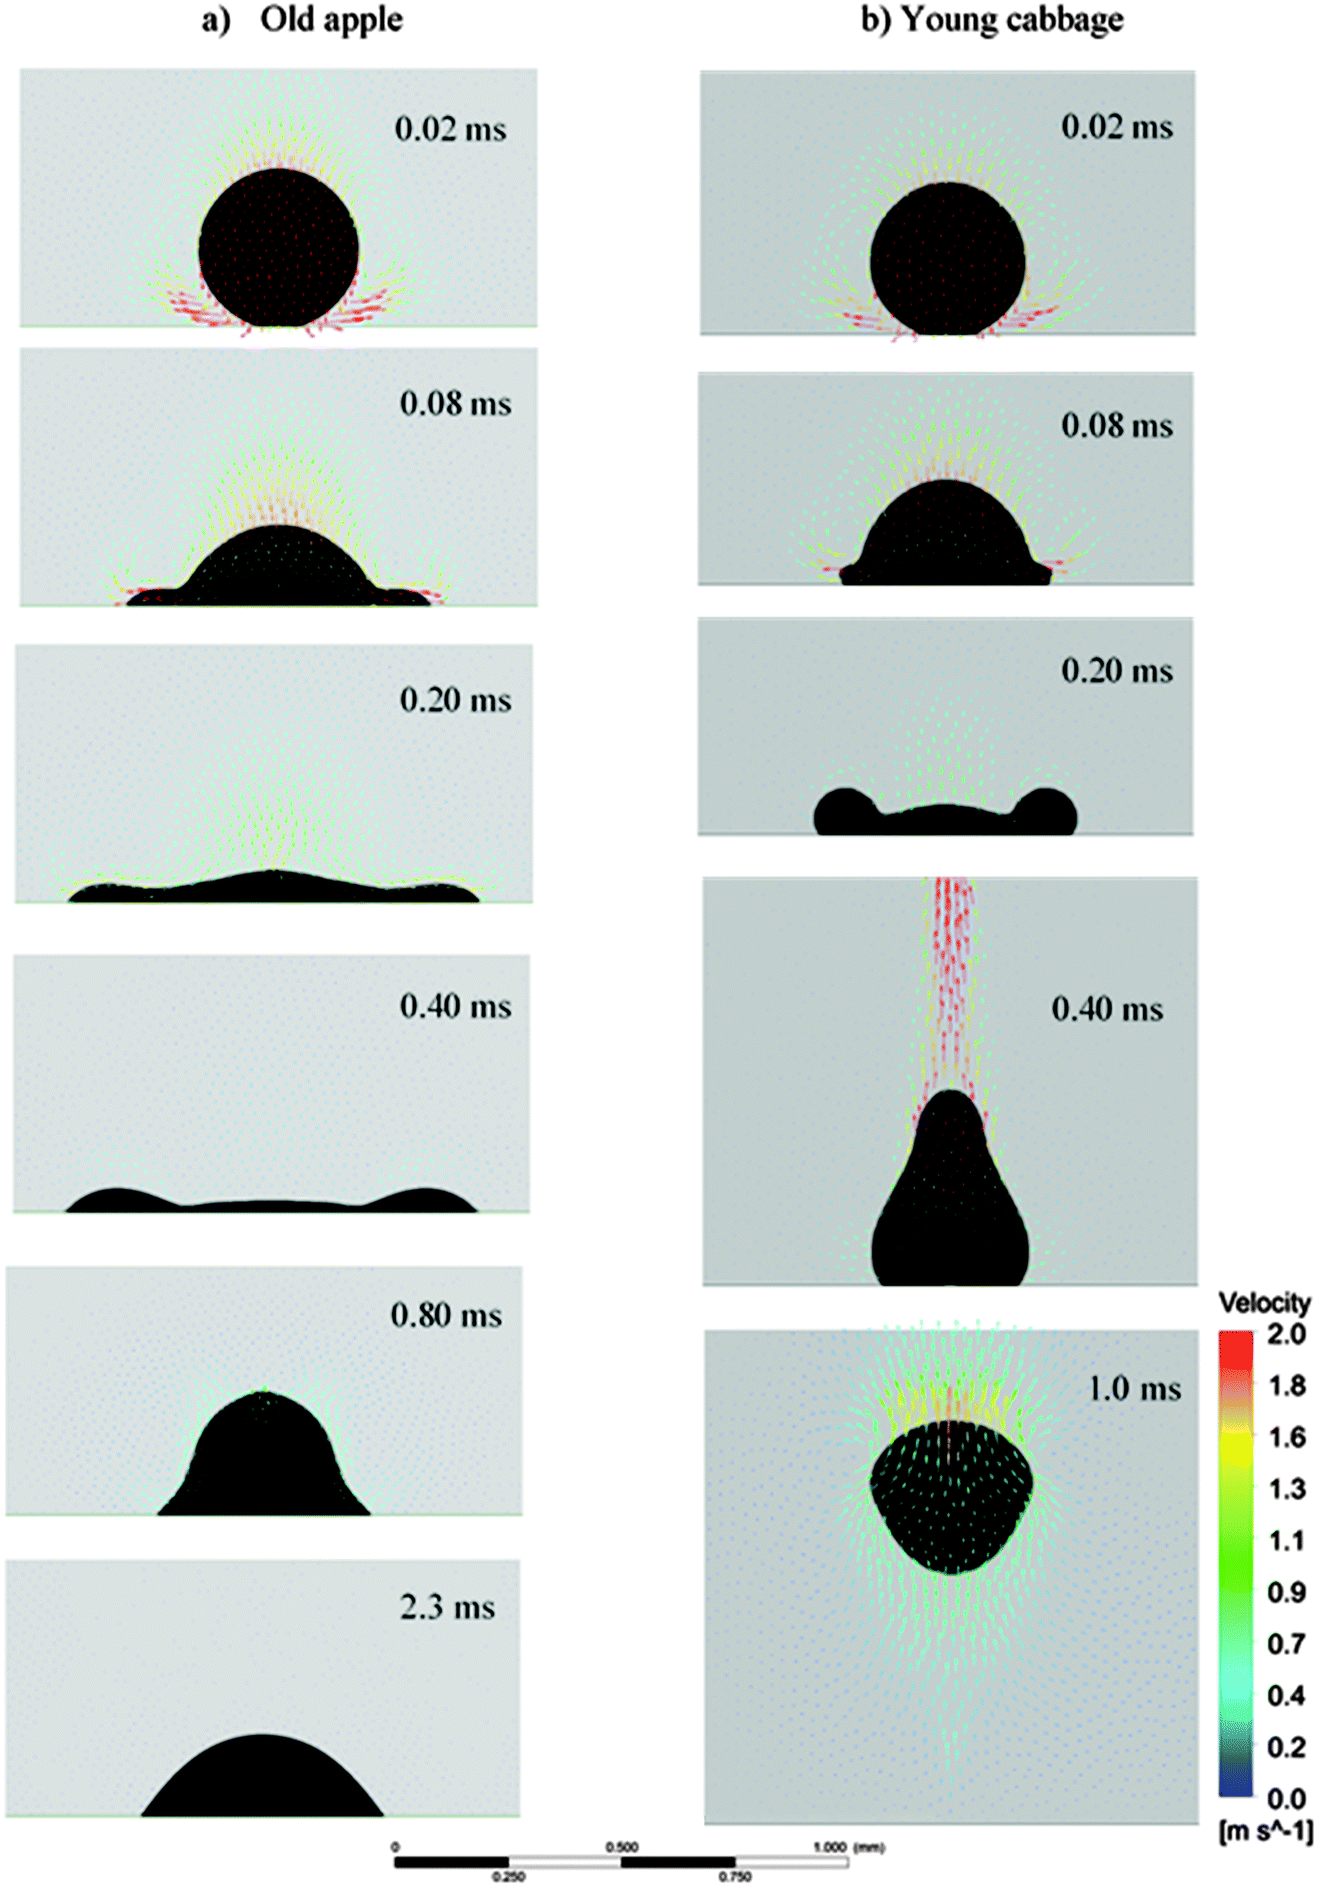 | ||
| Fig. 4 Predicted dynamic behavior and VOF velocity distribution during the droplet impact on a horizontally placed leaf of (a) old apple and (b) young cabbage with a vertical impact velocity of 2 m s−1; the black color represents the contour of the droplet; the time after the impact is given in milliseconds. | ||
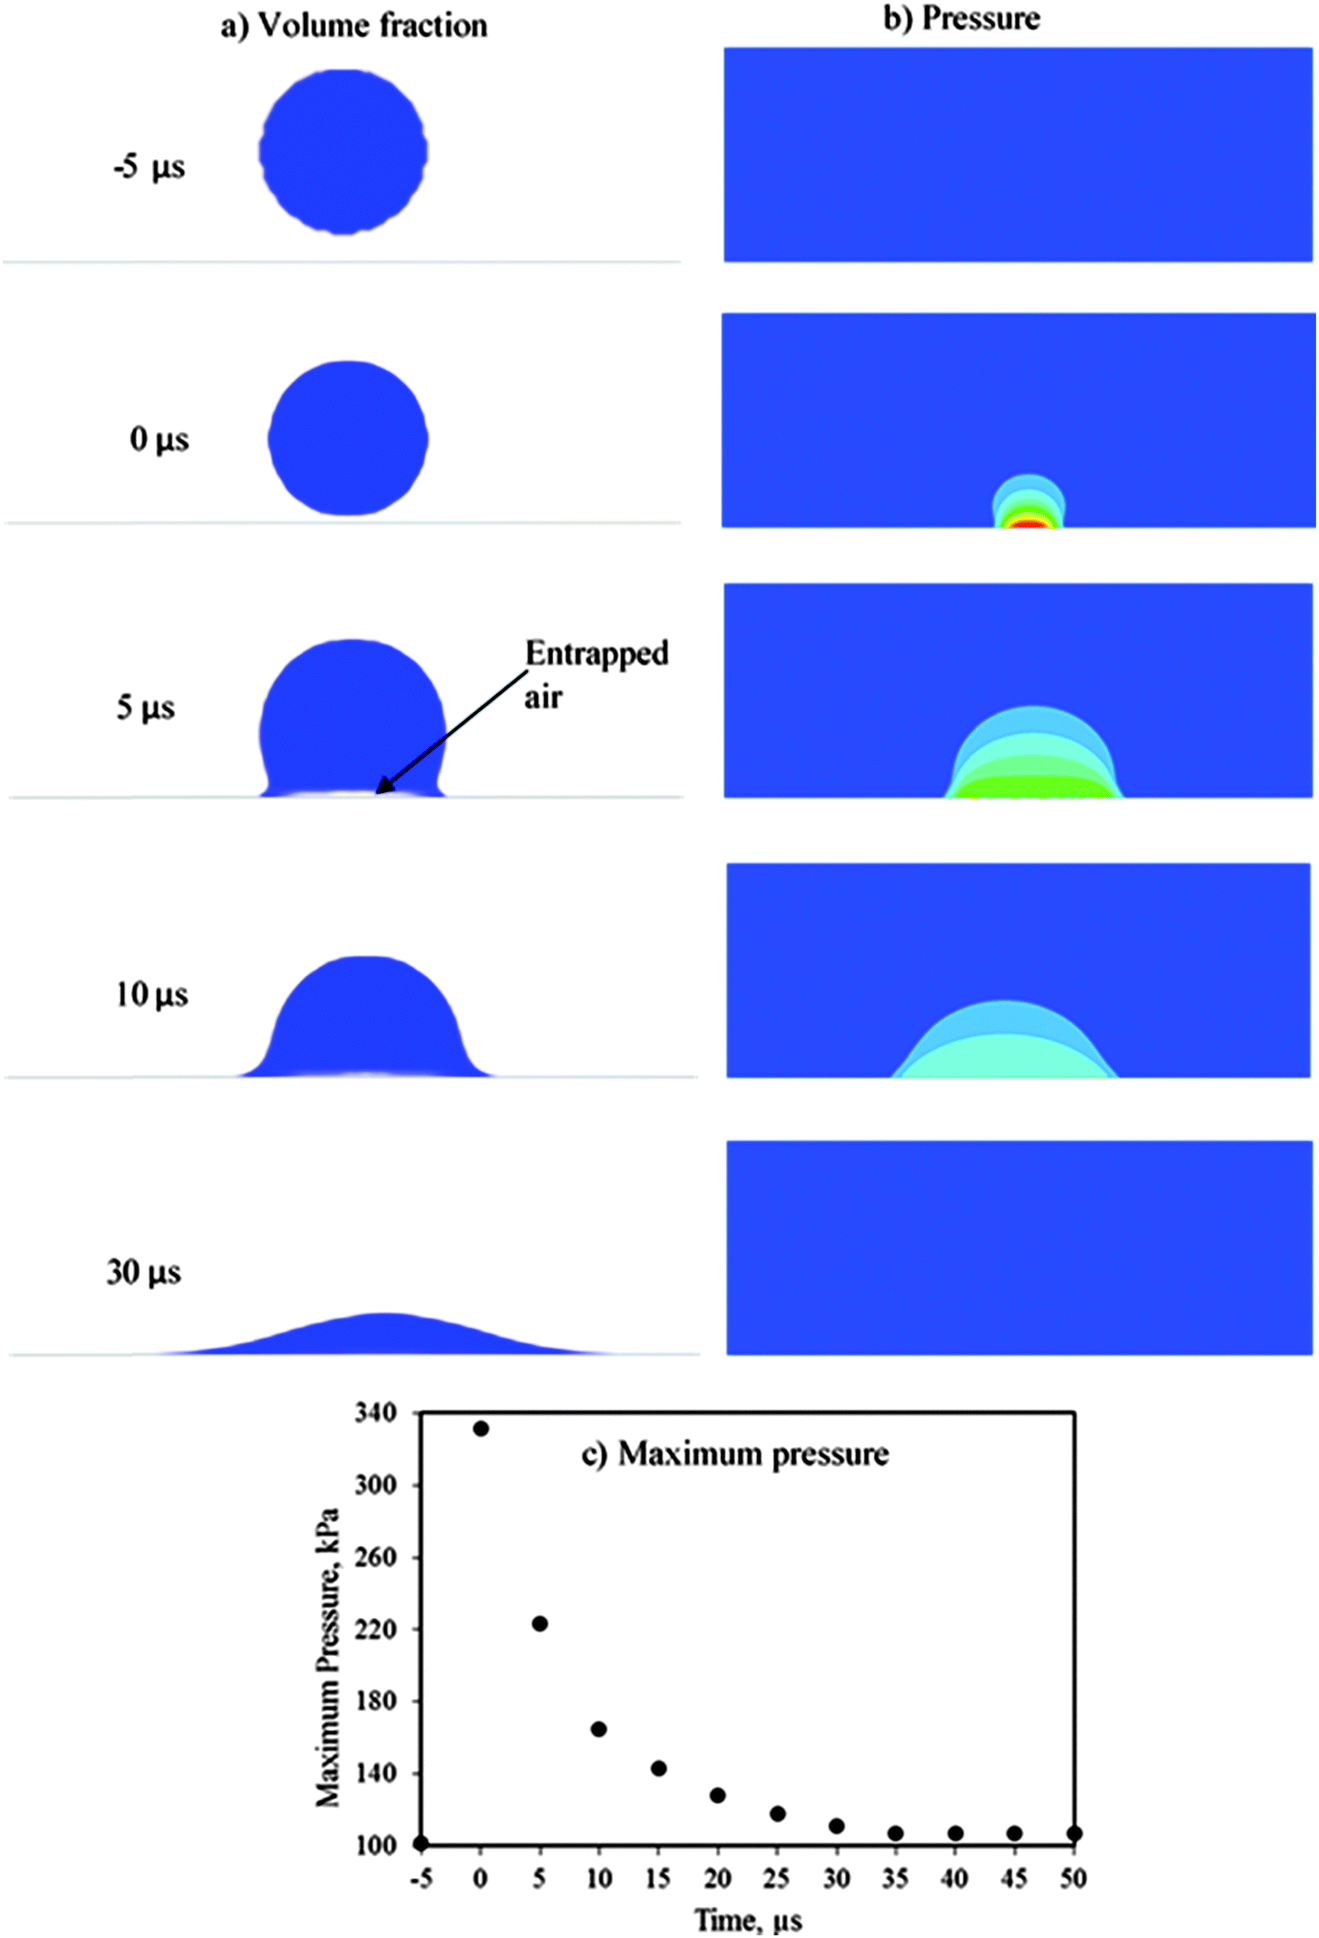
When the droplet impacted the surface, a certain amount of air was entrapped and generated a high pressure region around the centre of the impact (Fig. 5). The pressure of entrapped air caused a deformation on the air-liquid interface and formed a dimple on the droplet surface. It was reported that the change in droplet velocity from vertical to radial flow during the spreading phase was driven by the strong pressure gradient that was generated during the impact process.42,43 As the spread progressed, there was a decrease in radial velocity and pressure (Fig. 4 and 5). For the 300 μm droplet impacting at 2 m s−1, the entrapped air was shrinking with time and finally part of it was drained through the top surface of the spreading droplet. Thoroddsen et al.44 presented an experimental study of the contraction behaviour of the air disk that was caught under a drop impacting onto a solid surface for a wide range of impact We (20–1500) and Re (5–30000) numbers. The size of the initial air disk was affected by the curvature of the droplet at the initial contact and the contraction speed of the air disk was independent of the wettability of the liquid.
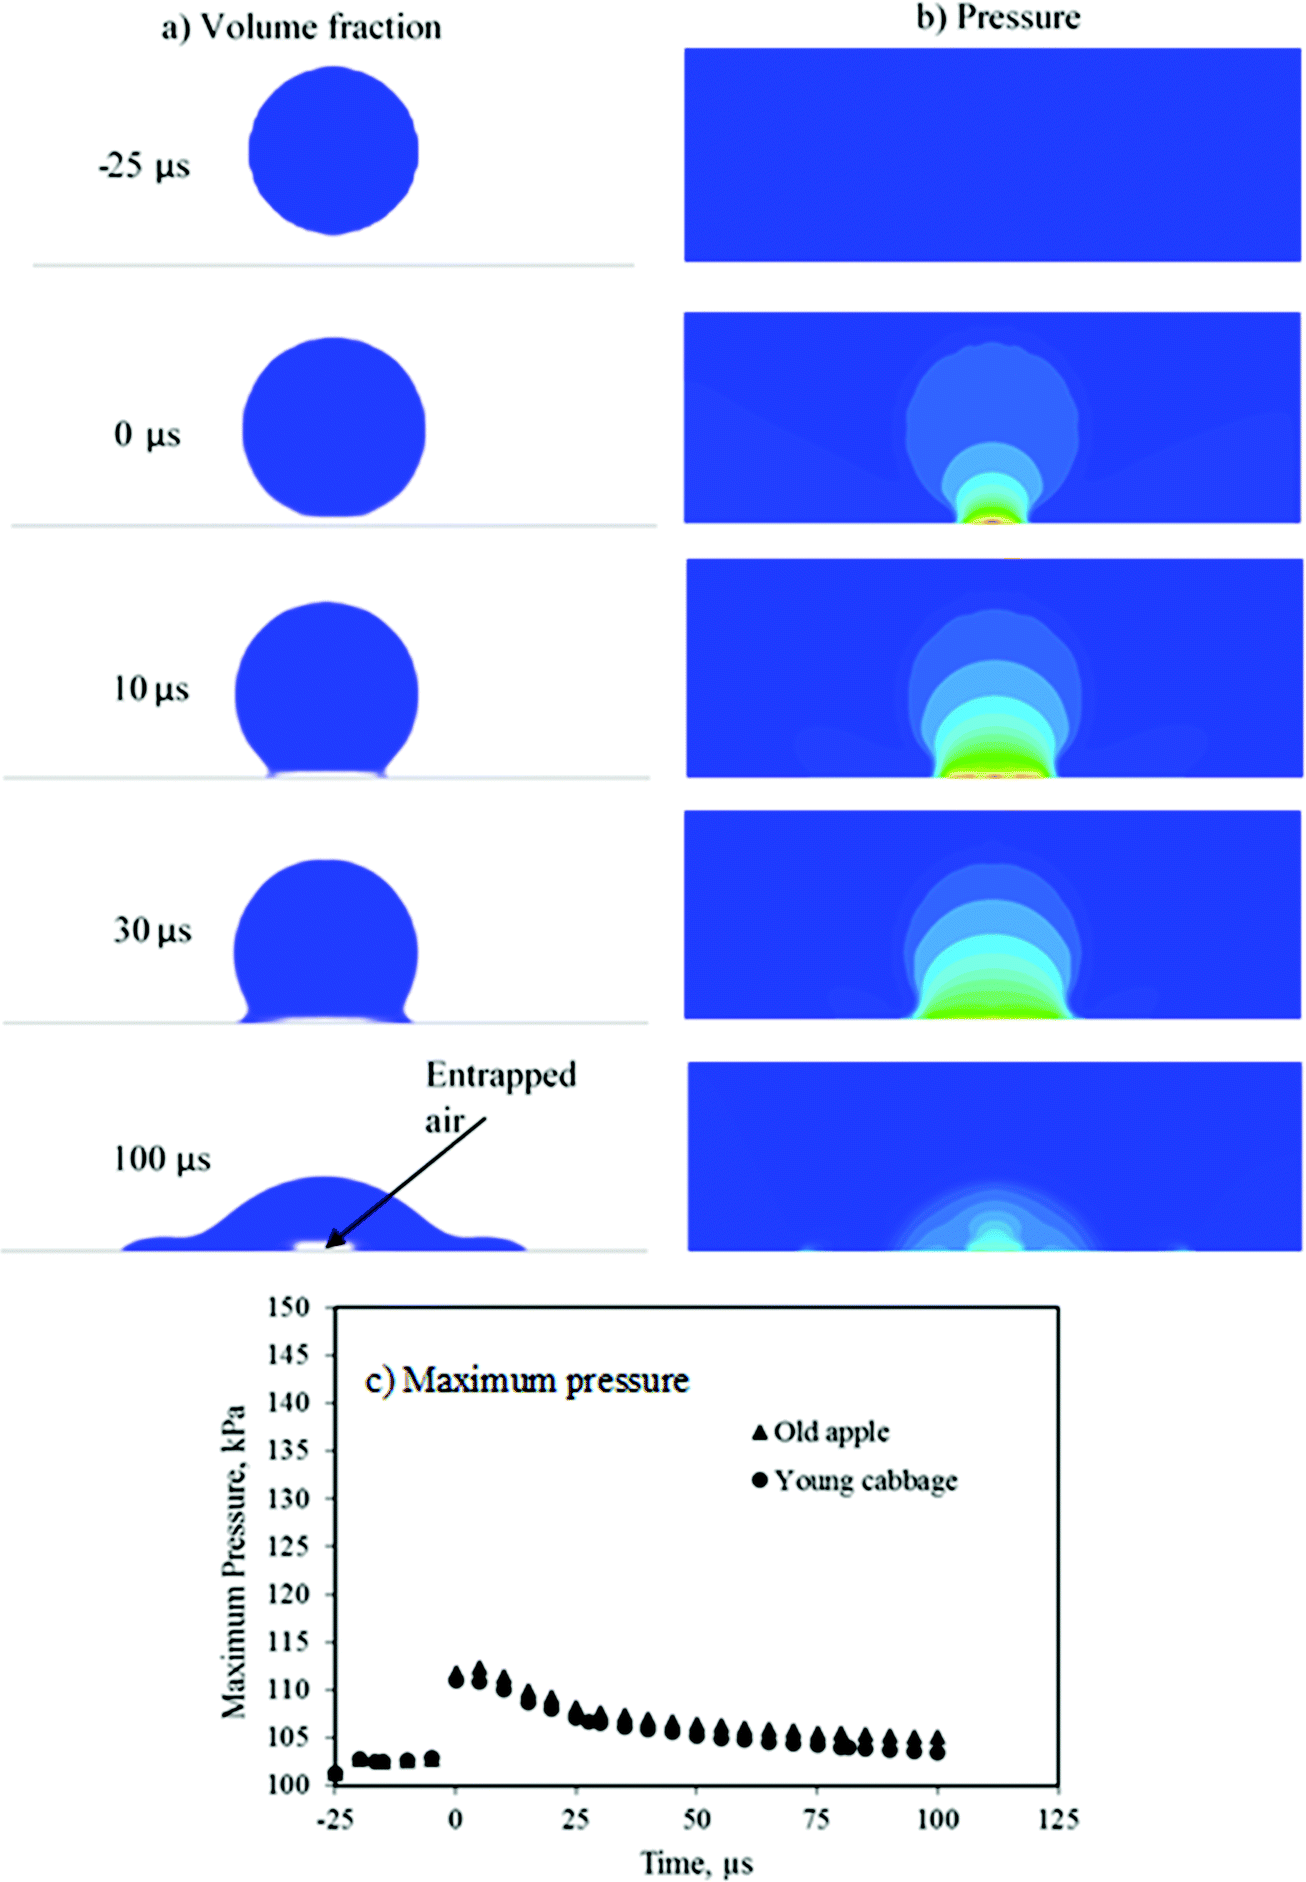 | ||
| Fig. 5 Predicted dynamic behavior of (a) air entrapment: blue represents liquid volume fraction of 1, (b) pressure distribution: blue and red represent pressure values of 101.3 kPa and 112.4 kPa, respectively, (c) maximum pressure; after the impact of a 300 μm water droplet on a horizontal leaf surface at a vertical velocity of 2 m s−1, 0 μs is the calculated collision time of the injected droplet to the surface (from the initial injection velocity and position). | ||
For this impact velocity and droplet diameter, there was a similar pressure decay profile between the old apple leaf and the young cabbage leaf; there was no significant difference (at 95% confidence interval) in the peak pressure value. It is known that this phase of the impact process is dominated by the inertial forces that are determined by the impact velocity and droplet diameter.42,43,45 van der Veen et al.46 experimentally studied the behaviour of the entrapped air between the impacting droplet and hydrophobic micropatterned surfaces. The presence of the protruding pillars increased the pressure and central dimple height; however, the height of the dimple was not affected by the pillar height. This shows that an explicit model of the surface structure of the rough leaves could produce a significantly different pressure profiles between the two types of leaves. But such an explicit model will increase the complexity of the model and computational time.
Fig. 6 presents dimensionless characteristics of the droplet flow for the two cases, with D being the initial droplet diameter, d being the droplet spread diameter at time t, h being the droplet height at the centre of the droplet at time t, and τ being the dimensionless time  with V the (initial) impact velocity of the droplet. The maximum spread area of the droplet after the impact was higher for the hydrophilic than the hydrophobic plant surface (compare Fig. 6a to Fig. 6b). For the 300 μm water droplet impacting at 2 m s−1, the maximum spread diameter on the old apple leaf surface was 1.46 times higher than that of the young cabbage surface (Table 2). It took longer time for the droplet to reach the maximum spread area on the hydrophilic surface than the hydrophobic surface. Until it reached the maximum spreading rate, the spread rate
  follows a power law relationship with the dimensionless time, with an exponent of 0.56 and 0.51 for old apple and young cabbage leaves, respectively (r2 > 0.98).
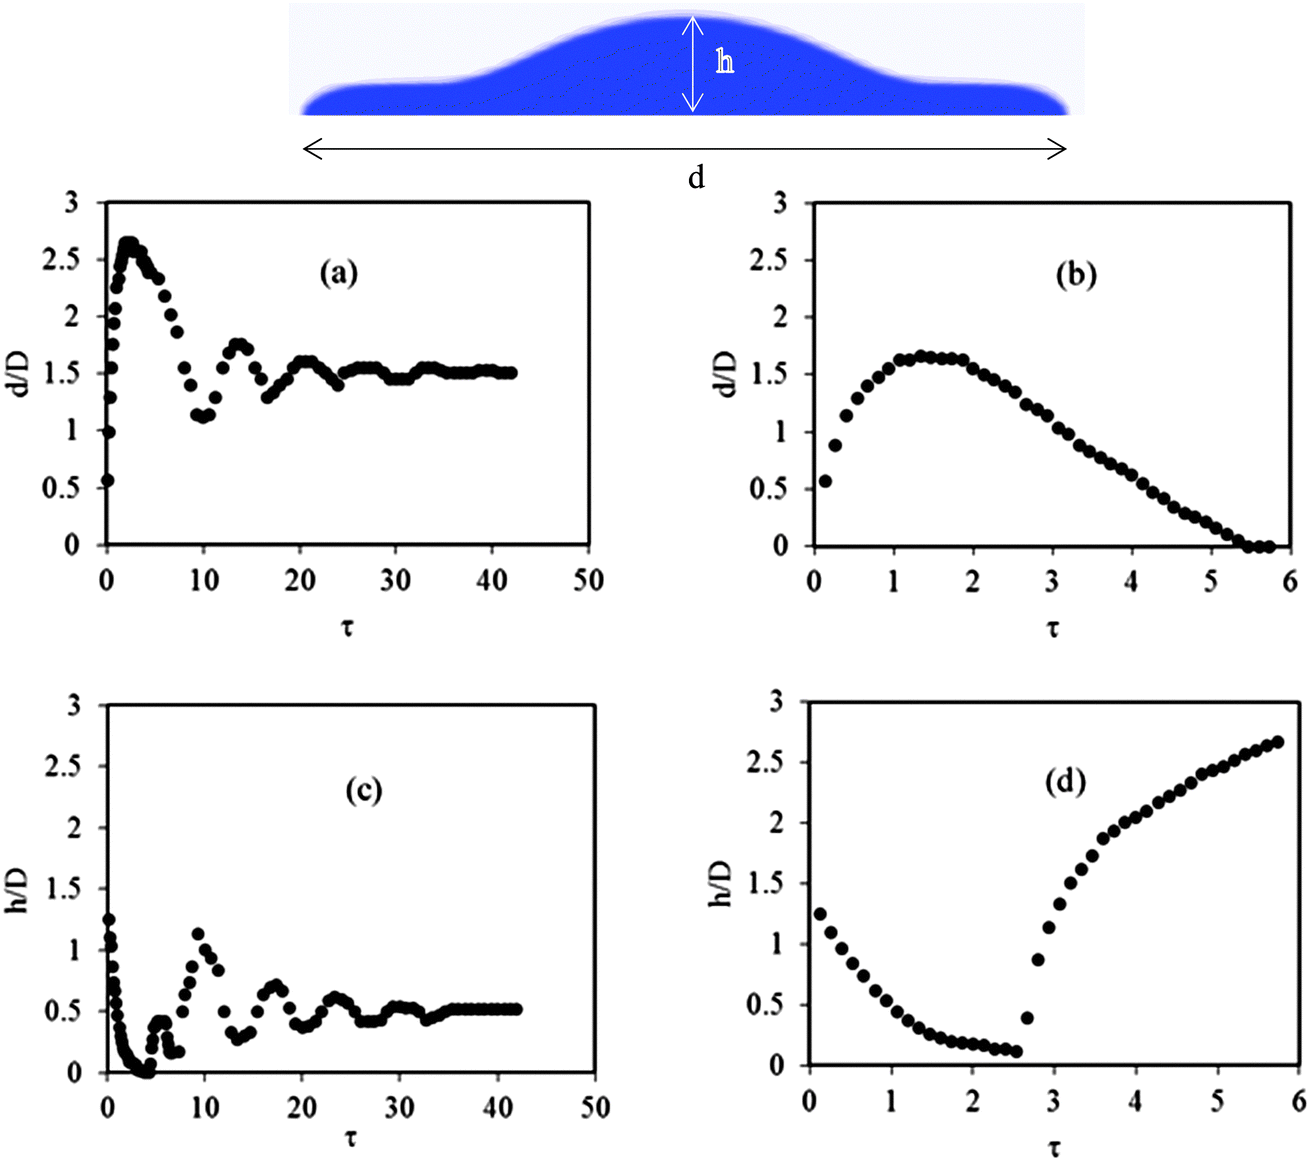 | ||
| Fig. 6 Predicted time evolution of the droplet spread diameter (d) and height (h) after the impact for a 300 μm water droplet at a vertical impact velocity of 2 m s−1 on a horizontally placed old apple (a and c) and young cabbage (b and d) leaf: (a) and (b) present the dimensionless droplet spread diameter; (c) and (d) the dimensionless droplet height (h/D) as a function of dimensionless time (τ). h represents the distance between the top of the drop and the solid surface. | ||
 of a 300 μm water droplet during the impact at 2 m s−1 on different leaf surfaces
| Leaf surface | Maximum spread factor
|
|
|---|---|---|
| CFD prediction | Eqn (4) | |
| Apple | 2.73 | 2.46 |
| Pear | 2.54 | 2.30 |
| Cabbage | 1.87 | 1.72 |
| Leek | 2.07 | 1.84 |

During the early stage of the impact process there was a linear decrease of the droplet height, and gradually it attained the minimum height (film thickness) of the droplet (Fig. 6c and d). This linear decrease in droplet height is due to the freefall of the top of the droplet.33 During the recoiling period the height of the droplet started to increase from its minimum value and on the hydrophilic surface it showed considerable oscillations and finally reached its equilibrium height (Fig. 6c). In the case of the hydrophobic surface, during the recoiling period the height of the droplet continuously increased till the droplets bounced back from the surface (Fig. 6d). The height of the droplet during bouncing from the hydrophobic young cabbage surface was 5.1 times higher than the height of the droplet that was deposited on the hydrophilic old apple leaf surface.
There was a good agreement between the maximum spread diameters that were calculated using eqn (4) and predicted using the CFD model of this study (Table 2). For a 300 μm water droplet impacting at 2 m s−1, the deviation of the CFD model prediction result relative to the result that was calculated using eqn (4) was 11.1, 8.5, 10.6 and 12.3% for the old apple, old pear and young cabbage and young leek leaf, respectively. The average deviation for wide ranges of impact velocity (0.1–5 m s−1) and diameter (50–800 μm) on an old apple and young cabbage surface that resulted in either deposition or rebound of the impacted droplets was 13.8 and 11.6%, respectively. Note that for lower impact Weber number (<2.7), eqn (4) does not give real solution for dm. Using eqn (4), it is thus possible to predict the maximum spread diameter for depositing and rebinding the droplets but it was impossible to know the dynamic behaviour and the result of the impact process that is rendered by the CFD simulations.
Table 2 shows that the maximum spread diameter of the droplet during the impact was affected by the wettability of the plant surface. Comparison was made between the results from two hydrophilic (old apple leaf and pear) and two hydrophobic (young cabbage and leek) plant surfaces. Within the hydrophilic plant surfaces, the relatively higher static contact angle decreased the maximum spread diameter of the droplet and increased the equilibrium adhesion height of the droplets (compare the maximum spread diameter on the apple and pear leaves). In the case of droplets bouncing from hydrophobic surfaces, decreasing the static contact angle increased the maximum spread diameter (compare the maximum spreading diameter on the young cabbage and leek leaves).
3.2. Impact dynamics of the droplet with shattering
The predicted dynamic behaviour of a 300 μm water droplet during the impact at a relatively high velocity (10 m s−1) on a horizontal young cabbage leaf is presented in Fig. 7. The corresponding Weber and Reynolds numbers were 411 and 3000, respectively. Upon impact the droplet flattened quickly, expanding radially in the form of a sheet and forming a lamella and a rim. Similar to the no splashing case, upon impact the entrapped air generated a dimple and high pressure region (Fig. 8). In this case, the peak pressure was 2.9 times higher than the no splashing case. During this relatively high impact velocity, the entrapped air was contracted and the pressure decayed faster than in the no splashing case. This was in agreement with the report of Thoroddsen et al.44 Mandre et al.47 reported that for a relatively high impact velocity the air dimple is responsible for the splashing of the droplet and the dimple height is affected by the pressure of the surrounding gas and the impact velocity. It has been reported that even at very high impact velocity, the combined action of the gas layer and liquid surface tension stops the droplet from contacting the solid surface, rather the droplet spreads on a very thin film of air and emits capillary waves.47,48 In this study due to the relatively coarse mesh size (relative to the thickness of the air film), it was not possible to distinguish the expected very thin air film. According to Xu et al.,49 it is possible to control the splashing process by controlling the pressure of the surrounding gas. For a given impact velocity, decreasing the pressure of the surrounding gas suppressed the splashing of the droplet and below a certain threshold pressure value the splashing was completely suppressed.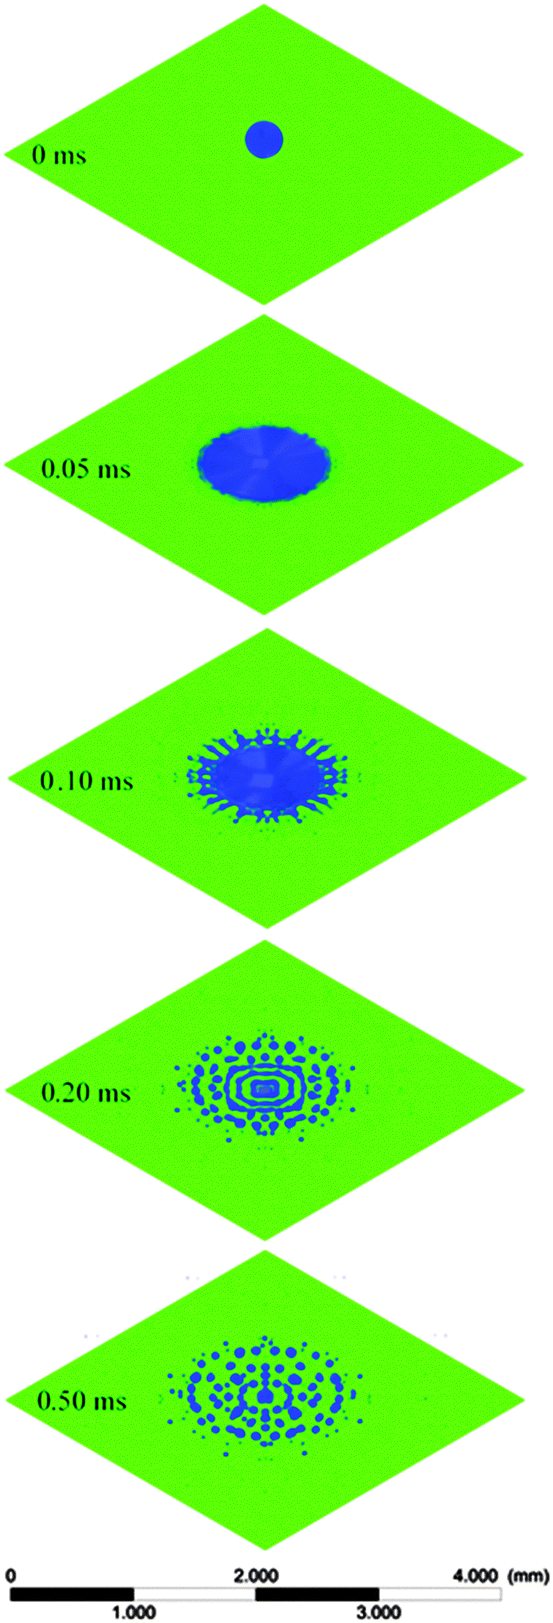 | ||
| Fig. 7 Predicted dynamic behavior of a 300 μm water droplet after impact on a horizontally placed young cabbage leaf at a vertical velocity of 10 m s−1; blue represents a liquid volume fraction of 1 and the time after the impact is given in milliseconds. | ||
 | ||
| Fig. 8 Predicted dynamic behavior of (a) air entrapment: blue represents liquid volume fraction of 1, (b) pressure distribution: blue and red represent pressure values of 101.3 kPa and 331.1 kPa, respectively, (c) maximum pressure; after the impact of a 300 μm water droplet on a horizontal young cabbage leaf surface at a vertical velocity of 10 m s−1, 0 μs is the calculated collision time of the injected droplet to the surface (from the initial injection velocity and position). | ||
The lamella near the edge of the expanding sheet lifted up off the plant surface and formed a crown type section. During the spreading process the sheet further thinned while the rim thickened. Villermaux and Bossa50 reported that the rim is gradually fed by incoming fluid from the sheet and is continuously stretched up to the equilibrium diameter. As the sheet expanded, perturbations were formed on the border, then the rim was destabilized and radial ligaments (fingers) were formed. The ligaments were detached and formed small droplets. Compared to the droplet that adhered to the surface without shatter, the shattered small droplets covered a relatively large area of the plant surface. Even for the hydrophobic plant surfaces most of these small droplets did not have the energy for bouncing rather adhered to the surface.12 This shattering of droplets could be beneficial for instance in crop spraying applications by increasing the coverage area and uniformity of the deposition of crop protection chemicals.
3.3. Comparison of the predicted and experimentally observed droplet impact
The predicted and measured shape changes of a water droplet with a diameter of 310 μm and an impact velocity of 2.8 m s−1 on a young cabbage leaf are presented in Fig. 9. The conditions corresponded to a Weber and Reynolds number of 33.3 and 868, respectively. There was a visually good agreement between the changes in the shape of the droplet during the spreading, recoiling and bouncing stages (compare Fig. 9a with Fig. 9b). In both cases, the maximum spreading and bouncing occurred at about 0.15 ms and 0.55 ms, respectively. There was also a good agreement between the measured and predicted dimensionless droplet spread diameter and droplet height (Fig. 9c and d). For a given time after impact, the predicted height of the droplets during the recoiling and bouncing period was slightly higher than the measured one. It was reported that the use of the dynamic contact angle instead of the static angle can improve the accuracy of the model during the receding phase.51 The dynamic contact angle takes into account the hysteresis effect (which is neglected when the static contact angle is assumed) that is often observed during the dynamic droplet impact process. The assumption of the static contact angle did not have any influence on the prediction during the spreading phase of the impacted droplet when the process is dominated by inertia, but mainly during the receding phase when the process is dominated by surface tension and viscous forces.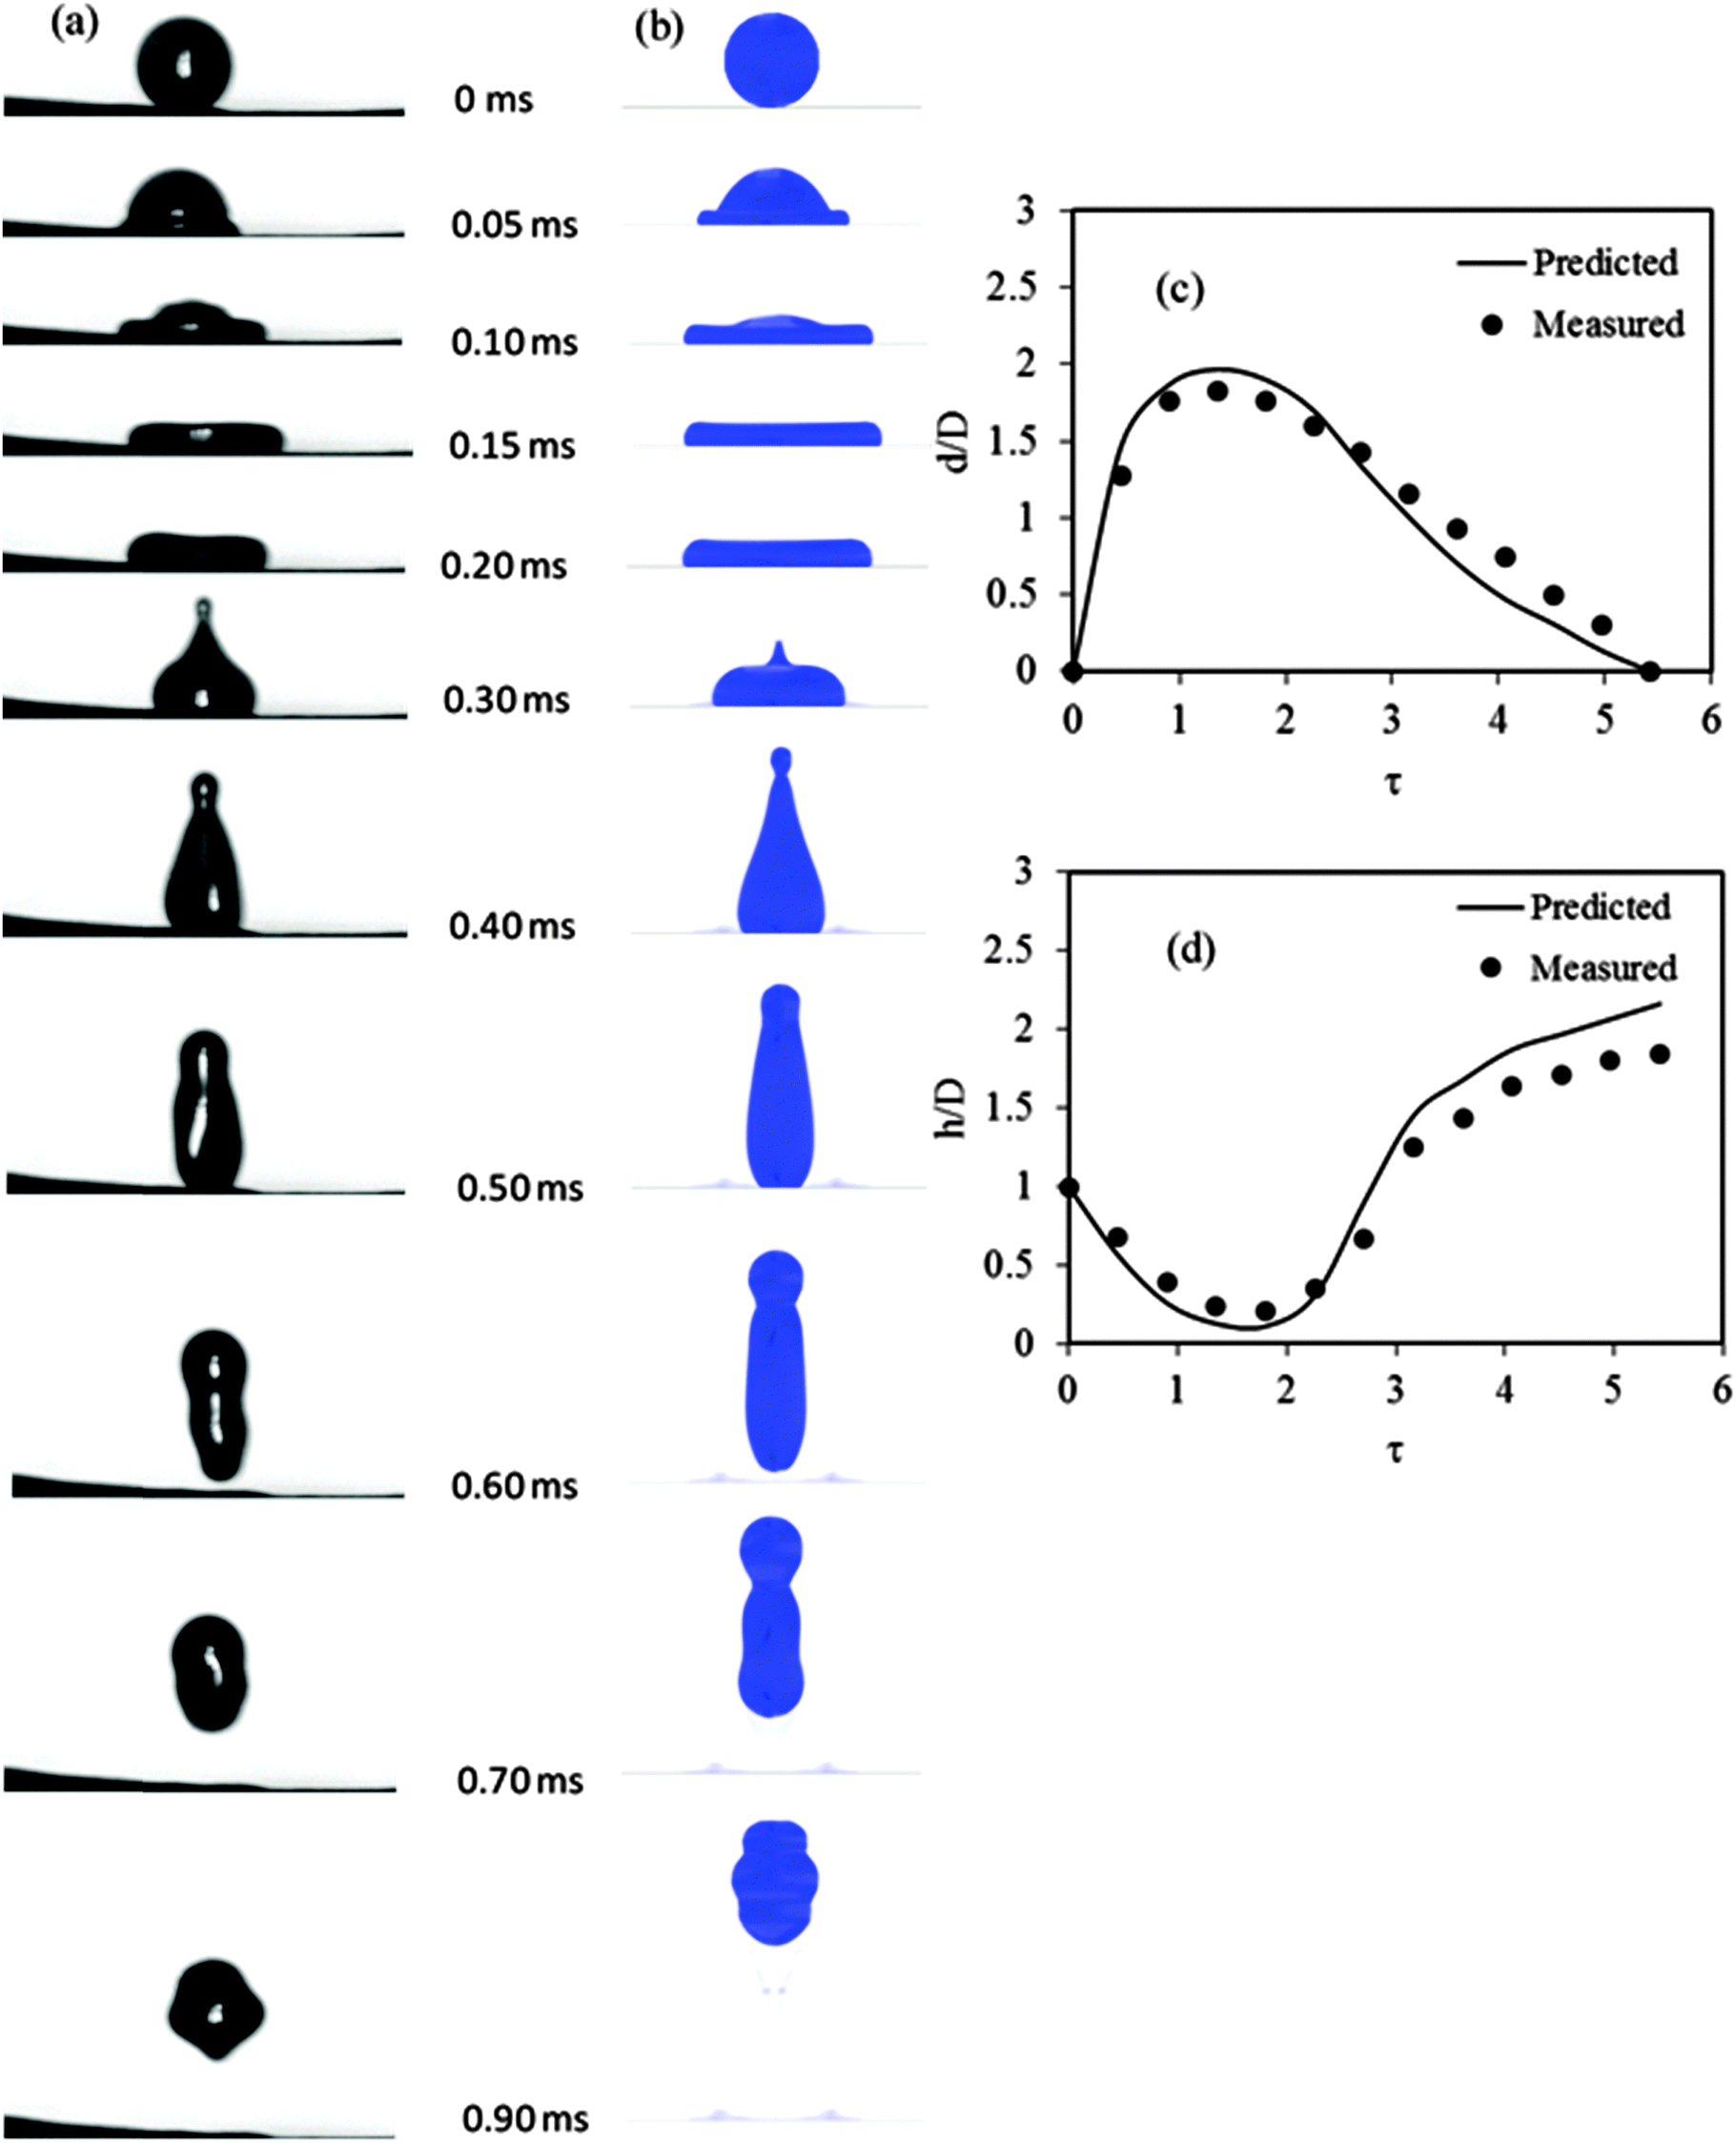 | ||
| Fig. 9 Comparison between the measured and predicted dynamic behavior of a 310 μm water droplet after the impact on a horizontal young cabbage leaf at a vertical velocity of 2.8 m s−1; (a) measured shape, (b) predicted shape, (c) predicted and measured dimensionless droplet spread diameter, (d) predicted and measured dimensionless droplet height; blue represents a liquid volume fraction of 1 and the time after the impact is given in milliseconds. | ||
The predicted and measured impact outcomes after the impact as a function of We and Re of the impacting droplet on cabbage and apple leaf surfaces are presented in Fig. 10. The model showed a clear transition from one impact behaviour to another, whereas there was some overlap in the measured results. This could be due to measurement errors on the exact droplet diameter, the inhomogeneous surface characteristics of the real leaf and impact velocity which was measured on 2D frames of an essentially 3D spray process. The measured and predicted critical Weber numbers for the transition from adhesion to bounce and from rebound to shatter for old apple, pear, leek and cabbage leaves are given in Table 3. The model slightly overpredicted the critical Weber number for the transition from adhesion to bounce/shatter, but slightly underpredicted the critical Weber number for the transition from bounce to shatter. The critical Weber number for transition from adhesion/bounce to shatter was higher in hydrophilic (old apple and pear leaves) than in hydrophobic (cabbage and leek leaves) plant surfaces, which was correctly predicted by the CFD model. From their study of the droplet impact on the surfaces of various wettabilities, Aboud and Kietzig52 observed a similar lower splashing threshold value for hydrophobic surfaces compared to hydrophilic surfaces.
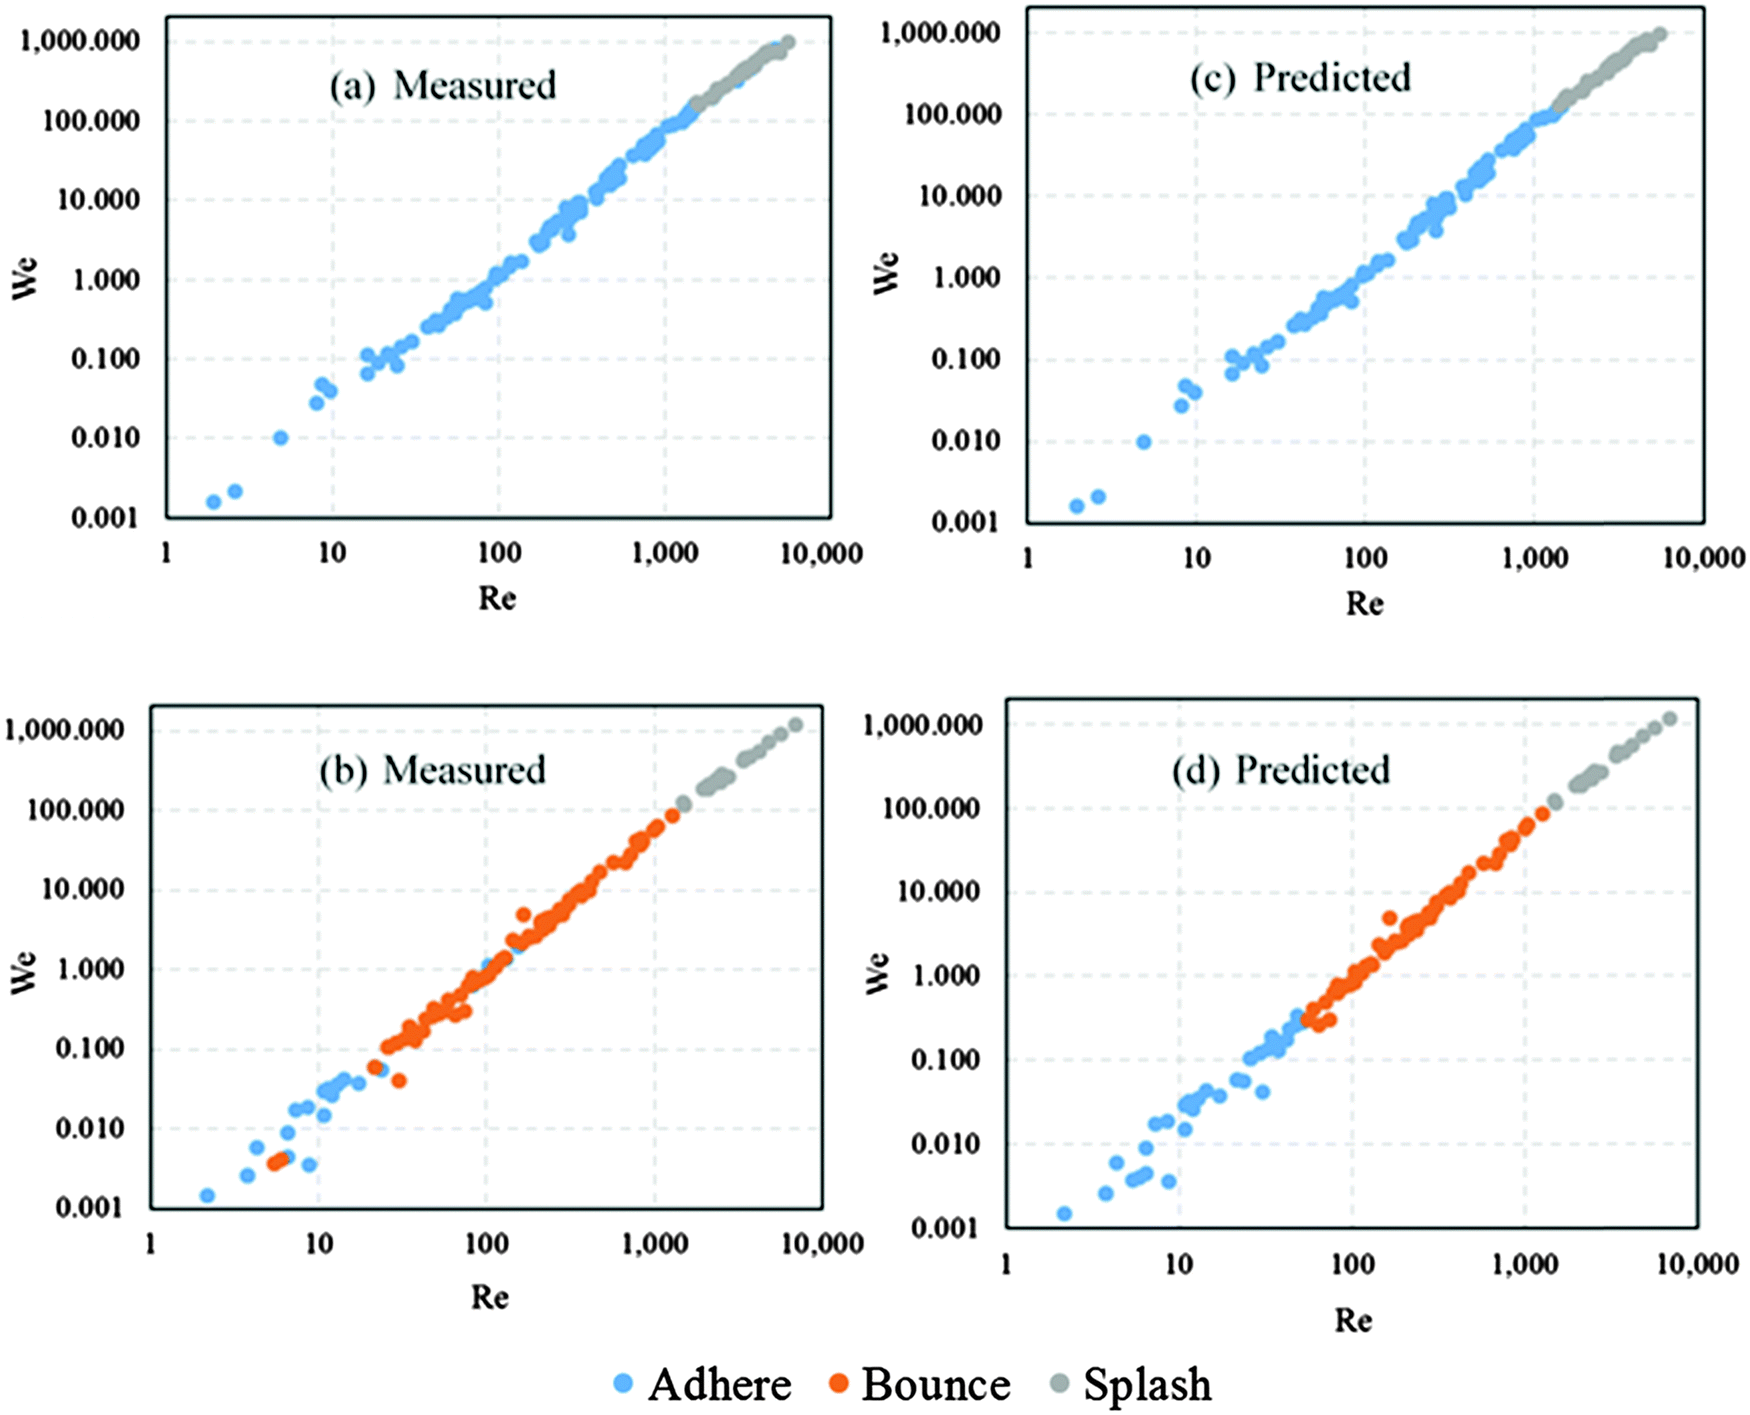 | ||
| Fig. 10 Measured and predicted outcomes and dynamics of water droplets with different diameters and impact velocities after the impact on horizontally placed leaf surfaces; old apple leaf: measured (a) and predicted (b), young cabbage leaf: measured (c) and predicted (d). | ||
| Impact transition behaviour | Plant surface | ||||
|---|---|---|---|---|---|
| Apple | Pear | Leek | Cabbage | ||
| Adherence to bounce | Measured | — | — | 1.01 | 0.07 |
| Predicted | — | — | 2.55 | 0.25 | |
| Adherence to splash/shatter | Measured | 159.2 | 166.7 | — | — |
| Predicted | 128.5 | 136.8 | — | — | |
| Bounce to splash/shatter | Measured | — | — | 108.1 | 116.0 |
| Predicted | — | — | 92.5 | 99.2 | |
3.4. Defining the impact characteristics using dimensionless numbers
The droplet impact characteristics on the plant surfaces were defined using We, Re and Oh numbers. In this study simulations were conducted for different droplet diameters and impact velocities that produced We in the range of 0.007 to 1096 and Re in the range of 5 to 8000. of the droplet as a function of We for adhered and rebounded droplets. The maximum spread factor of the droplet on the old apple leaf was higher than that of the young cabbage leaf. The trend followed a power law relationship (r2 = 0.92 for the apple leaf and r2 = 0.91 for the young cabbage leaf) with exponents of 0.12 and 0.15 for the hydrophilic old apple and hydrophobic young cabbage leaves, respectively. From their study of water and mercury droplet impact on a super hydrophobic surface (static contact angle of 170°), Clanet et al.53 found a similar power law relationship with an exponent of 0.25 between the droplet maximum spread factor and We. The result showed that the exponent of this power law relationship was affected by the properties of the impact surface.
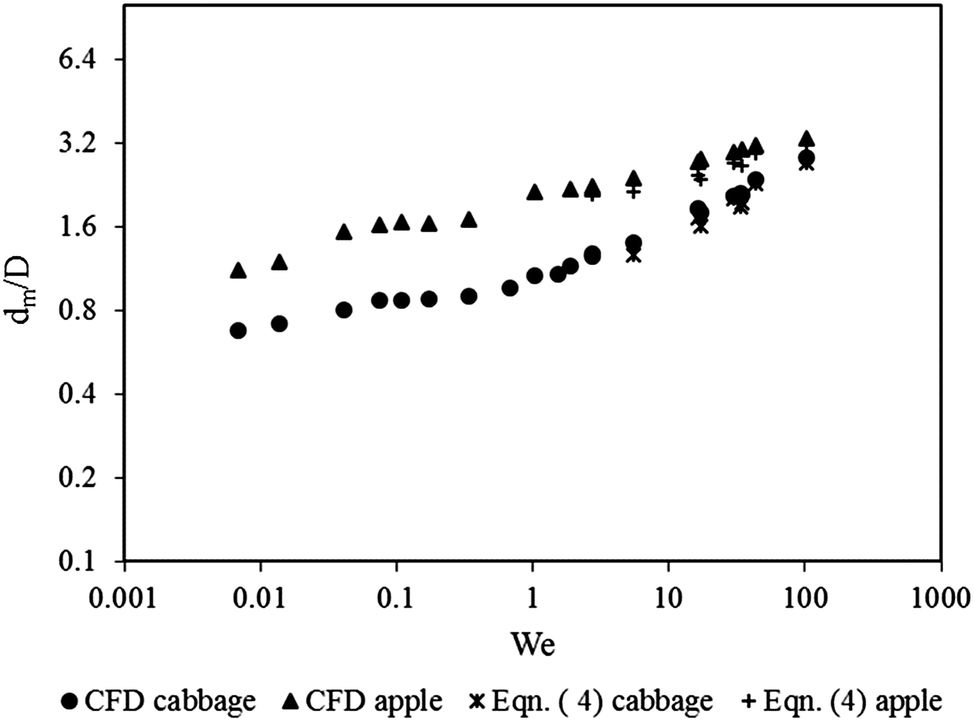 | ||
| Fig. 11 Predicted maximum spread factor (dm/D) as a function of the Weber number (We) for water droplets, using CFD or resulting from eqn (4) on young cabbage and old apple leaves. | ||
For this range of We values (droplet impact velocity of 1–7 m s−1 and diameter of 50–800 μm) CFD predicted maximum spread factors were compared to the results that were obtained from eqn (4)34 and on average there was a difference of 9.3% and 10.1% for the impact on old apple and young cabbage leaf surfaces, respectively. This relatively small difference showed that in addition to predicting the dynamic droplet impact behaviour the CFD model was also capable of predicting the maximum spread factor of water droplets on plant surfaces.
 . They stated that the number of fingers is weakly dependent on the surface tension and depends primarily on the inertial-viscous interaction. The result of this CFD study was fitted to this equation by assuming that this scaling relationship of droplet fingers may work for the secondary droplets. However, compared to the proposed relationship it showed a relatively weak correlation.
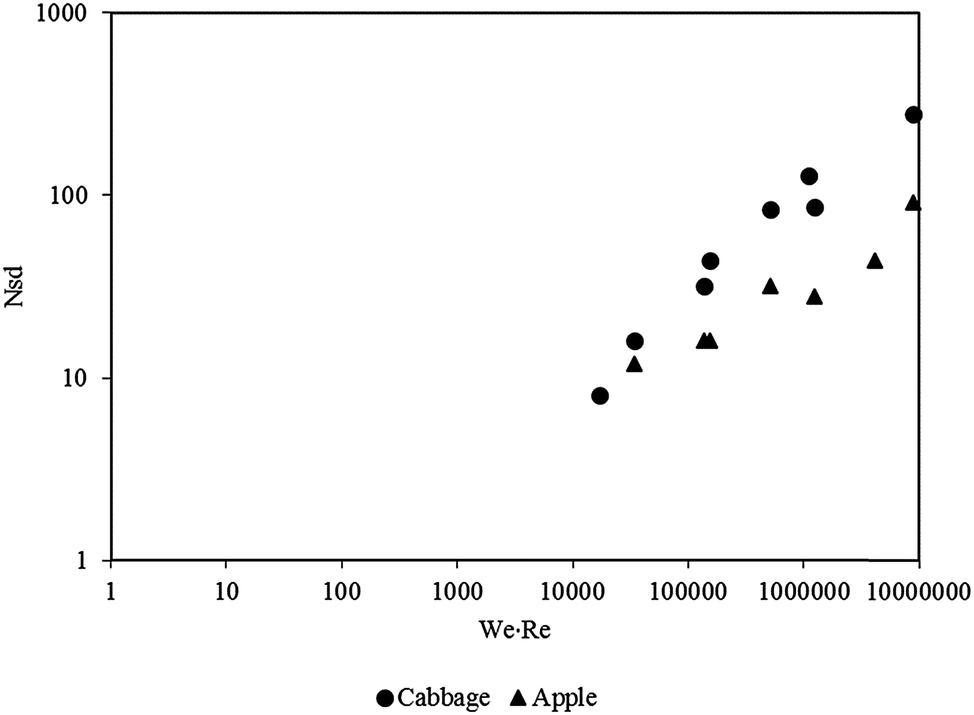 | ||
| Fig. 12 Predicted number of secondary droplets (Nsd) formed during splashing/shattering of the droplet on young cabbage and old apple leaves as a function of We·Re. | ||
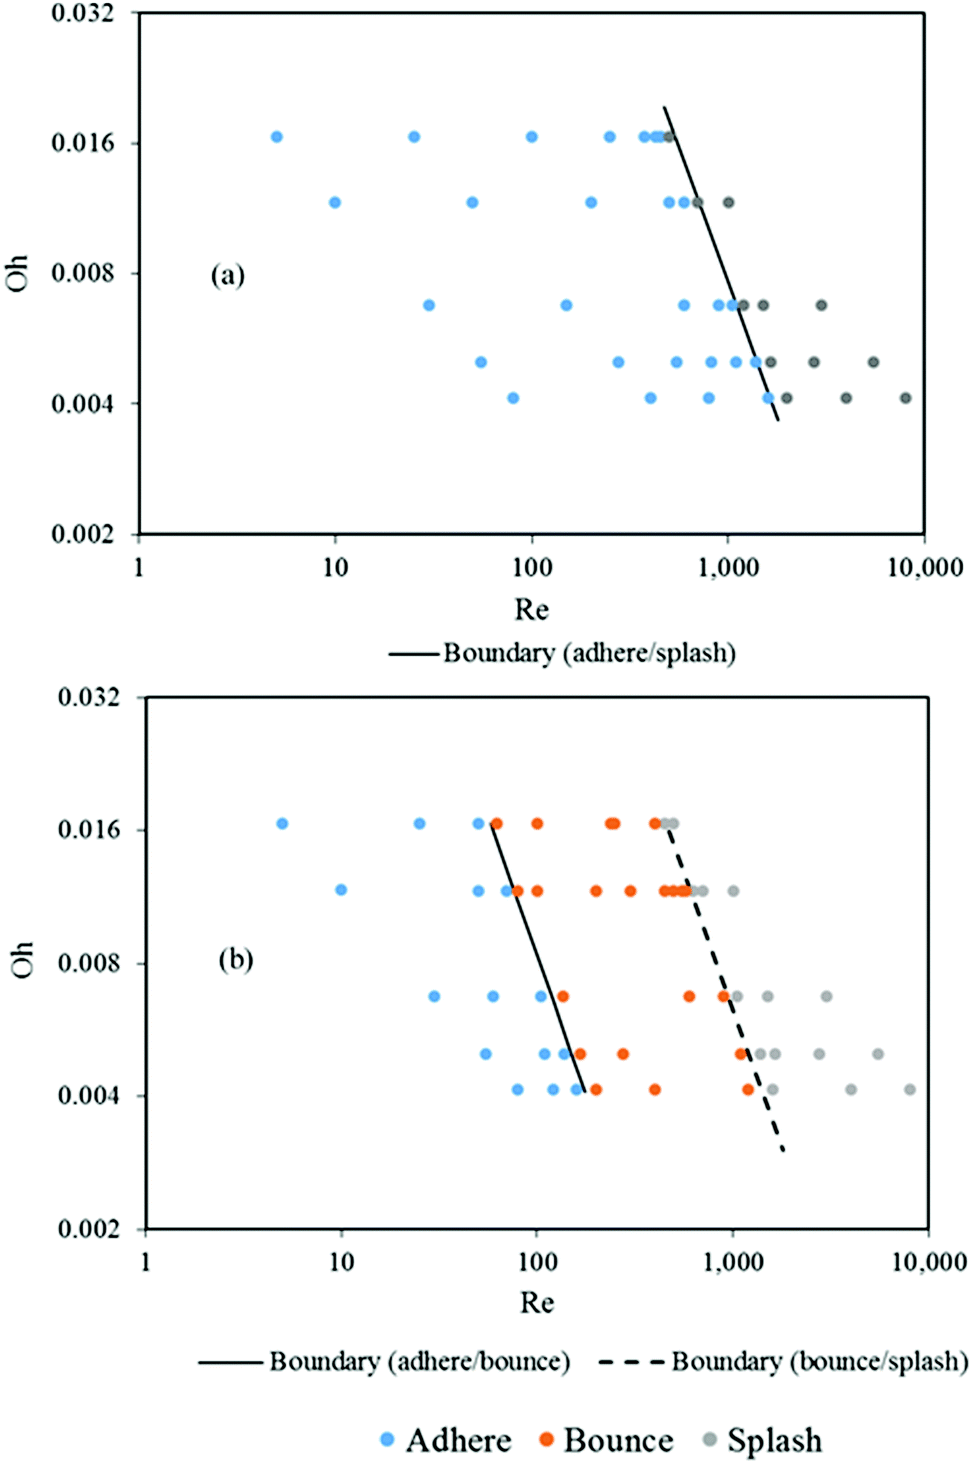 | ||
| Fig. 13 Predicted boundary line (OhRe1.25 = K) between the different droplet impact outputs (adhere, bounce and splash/shatter) on old apple (a) and young cabbage (b) leaves as a function of Reynolds (Re) and Ohnesorge (Oh) numbers. | ||
3.5. Relation between droplet impact characteristics and surface morphology of the leaves
The images of SEM showed that there is a large difference between surface morphology of the leaves of cabbage, leek, apple and pear (Fig. 14). The surface structure of the hydrophobic cabbage leaf consisted of a number of protrusions/bumps which are affecting the surface wettability by entrapping air between the droplet and the leaf surface. The presence of the grooves in the leek leaves could create a difference in the spreading behaviour and the contact angle of the droplet in the parallel and perpendicular directions. The height of the protrusions on the surfaces of the hydrophilic old apple and pear leaves was smaller than that of the cabbage leaf. Even within the same leaf, inhomogeneity in the surface structure was observed (it was more pronounced in the case of leek leaf). This variation in the surface structure could cause a variation in adherence/bounce behaviour on the leaf surface. The size of the grooves on the leek leaf was around 20 μm which was less than the minimum diameter (50 μm) of the droplet considered in this study. Similarly the size of the micro/nanoprotrusions on the other surfaces was lower than 50 μm.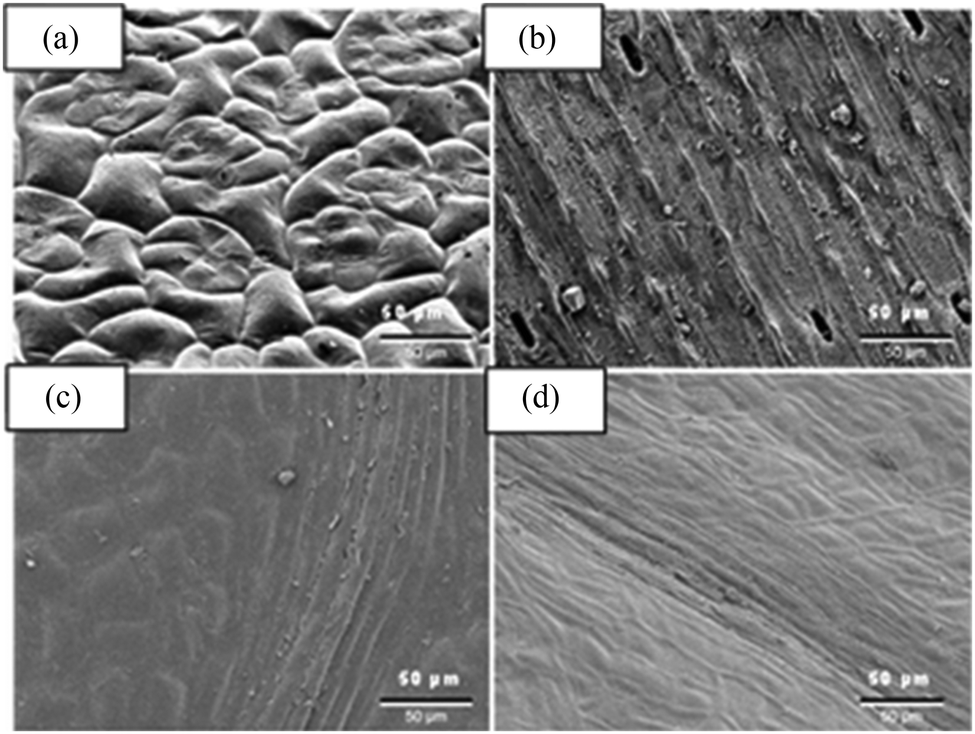 | ||
| Fig. 14 SEM images of different leaf surfaces: (a) cabbage (Brassica oleracea); (b) leek (Alium ampeloprasum var porrum); (c) apple (Malus domestica); (d) pear (Pyrus communis). | ||
This study showed that the VOF model using the measured static contact angle as an input parameter gives a reasonably accurate result. It is known that surface roughness is highly related to the contact angle and its hysteresis.56,57 For rough surfaces Wenzel57 presented an equation that relates the contact angle to surface roughness. This model did not use the detailed topology of the surfaces but the measured static contact angles are proved to be a good approximation of the surface structure. It was not possible to see the flow behaviour between protrusions/grooves but the model was capable of capturing the main flow behaviour.
The observed complexity in the structure of the leaves shows that an explicit geometrical model of the leaf structure could improve the accuracy of this model that mainly depended on the measured static contact angle. The detailed explicit geometric model of the surface can be developed from high resolution images of the leaves. There are some studies that used simpler geometric features of the surfaces for developing such a VOF model.58,59 However, such an explicit geometric model needs more computational resource and time. Introducing the dynamic contact angle instead of the static contact angle could further increase the model prediction accuracy. The method of calculating the dynamic contact angle from the measured static contact angle and contact line velocity can be found in the work of Šikalo et al.51
3.6. Relevance of this study for improving the performance of spraying systems
This study gives a better understanding about the dynamics and possible outcomes of the spray droplet impact on plant surfaces. It is observed that the impact behaviour of droplets on a plant surface is a complex process which is controlled by many parameters. It is impossible to get such a detailed information about the impact dynamics of an individual droplet in full scale spray applications where a large number of droplets are impacting on a plant surface within a short time. Understanding the physics at the droplet scale could help in maximizing the retention of spray droplets on plant surfaces, and improve the performance of spraying systems.3,12 Better knowledge of the impact dynamics of the droplets on plant surfaces is the basis for the development of precision spraying systems.Several previous studies reported the effect of different parameters on the impact behaviour of the droplet on solid surfaces. Courbin et al.60 stated that the dynamics of the wetting process depends on the droplet contact angle, droplet shape and surface roughness. Xu et al.61 conducted an experimental study of droplet splashing in relation to surface roughness, the surface texture pattern, the surrounding air pressure and liquid viscosity. Relatively low surrounding pressure suppressed the splashing tendency of the impacting droplet. Increasing the viscosity of the liquid delayed the splashing process. In a lower viscosity range (up to a kinematic viscosity of 0.0035 m2 s−1) increasing the viscosity favours splashing, whereas at higher viscosity increasing the viscosity retarded the splashing process. On the textured surfaces, the pillar height was the dominant parameter that affected the splashing behaviour. The study showed that for a lower pillar height range (<18 μm) there was a positive correlation between the roughness height and splashing. However for a higher height range, there was a negative correlation between the roughness height and the splashing tendency. Tsai et al.62 reported that for surfaces with micropatterns the splashing behaviour of the droplet was highly dependent on the arrangement of the pillars. It was also possible to control the direction of the splash using the arrangement of the pillars. The experimental result of Courbin et al.63 showed that it is possible to completely inhibit splashing by controlling the surface roughness.
The spreading and splashing behaviour of droplets with respect to surface inclination and motion was studied by Bird et al.64 and Courbin et al.63 The tangential part of the impact velocity created asymmetric splashing and either triggered or inhibited splashing on the portion of the droplet. Courbin et al.63 and Pepper et al.65 studied the effect of surface deflection upon droplet impact on the splashing behaviour. Reducing the tension in the surface suppressed the splashing behaviour of the droplet. Kwon et al.66 experimentally studied the wettability and impact dynamics of droplets on rice leaves, and the contact distance of bouncing droplets increased with an increase in the tangential Weber number. There was anisotropy in wettability between the longitudinal and transversal directions of the leaves. There was a difference in the contact distance, contact angle hysteresis, the run-off angle and the maximum spreading factor of the droplet between the longitudinal and transversal direction of the leaves. Dong et al.4 reported the effect of the surfactant on the dynamics of droplet–leaf surface interaction.
All the above studies showed the complexity of the impact process and the importance of the respective parameters in correctly determining the final fate of the droplet on the plant surface. The presented model can be used to study the effect of different relevant spraying parameters, such as droplet size and impact velocity, liquid formulation, the impact direction, surface orientation, surface wettability, the surface structure and surrounding air properties. To take into account the effect of surface deflection, this model should be coupled to the fluid-structure interaction model. Such a comprehensive study will give a better understanding about the interaction between spray droplets and plant surfaces and the respective results will be applied to improve the accuracy of the existing stochastic droplet retention and drift models.16–18
4. Conclusion
This paper presented a 3-D multiphase CFD model of the spray droplet impact on leaf surfaces using a Volume of Fluid (VOF) approach that was validated using high speed camera experiments. The model was capable of predicting successfully the dynamic impact behaviour for both hydrophilic and hydrophobic plant surfaces, and captured the spreading, recoiling, bouncing and shattering stages of the impact process of spray droplets from an agricultural spray nozzle under laboratory conditions. The accuracy of the model prediction can be improved by applying the apparent dynamic contact angle instead of the static angle.The boundary lines of the transition from one impact outcome to another (adhere to bounce, adhere to splash, adhere to bounce and bounce to splash) were expressed as a function of Re and Oh. The correlations were different for different plant surfaces. There is a need to formulate a more general model equation that takes into account the surface roughness and the contact angle.
The results demonstrated the capability of a VOF based 3-D CFD model in predicting the dynamics and outcomes of the vertical water droplet impact on horizontal plant surfaces. This model will be used to study the real condition during the impact of the droplet on plant surfaces. In reality, the droplets are impacting at an angle, the plant surfaces have some roughness, orientation and elasticity and the surrounding air is moving at a certain direction and magnitude. The results of such a comprehensive model will be applied to improve the accuracy of the commonly assumed stochastic droplet collection and drift models.
Acknowledgements
The author Mulugeta Admasu Delele kindly acknowledges funding from a Back to Belgium Grant of the Belgian Federal Science Policy (BELSPO).References
- P. Wagner, R. Fürstner, W. Barthlott and C. Neinhuis, J. Exp. Bot., 2003, 54, 1295–1303 CrossRef CAS PubMed.
- A. L. Yarin, Annu. Rev. Fluid Mech., 2006, 38, 159–192 CrossRef.
- M. Massinon and F. Lebeau, Biotechnol., Agron., Soc. Environ., 2013, 17, 494–504 Search PubMed.
- X. Dong, H. Zhu and X. Yang, Pest Manage. Sci., 2014, 71, 302–308 CrossRef PubMed.
- G. J. Dorr, D. M. Kempthorne, L. C. Mayo, W. A. Forster, J. A. Zabkiewicz, S. W. McCue, J. A. Belward, I. W. Turner and J. Hanan, Ecol. Modell., 2014, 290, 94–101 CrossRef.
- J. A. Tolk, T. A. Howell, J. L. Steiner, D. R. Krieg and A. D. Schneider, Irrig. Sci., 1995, 16, 89–95 CrossRef.
- J. Uddin, R. Smith, N. Hancock and J. Foley, in Australian Irrigation Conference and Exibition 2010: One Water Many Futures, Sydney, Australia, 2010, pp. 1–10.
- C. Bassette and F. Bussière, Agric. For. Meteorol., 2008, 148, 991–1004 CrossRef.
- E. Baker and G. M. G. Hunt, New Phytol., 1986, 102, 161–173 CrossRef.
- H. Wang, H. Shi, Y. Li and Y. Wang, PLoS One, 2014, 9, e107062 Search PubMed.
- I. K. Zwertvaegher, M. Verhaeghe, E. Brusselman, P. Verboven, F. Lebeau, M. Massinon, B. M. Nicolaï and D. Nuyttens, Biosyst. Eng., 2014, 126, 82–91 CrossRef.
- G. Mercer, W. L. Sweatman, A. Elvin, J. Caunce, G. Fulford, S. Harper and R. Pennifold, Proc. 2006 Math. Study Group., ed. G. Wake, 2007, pp. 57–85 Search PubMed.
- Y. Kang, Q. G. Wang and H. J. Liu, Agric. Water Manage., 2005, 74, 189–199 CrossRef.
- M. Massinon and F. Lebeau, Biosyst. Eng., 2012, 112, 56–64 CrossRef.
- G. Dorr, J. Hanan, S. Adkins, A. Hewitt and B. Noller, Funct. Plant Biol., 2008, 35, 988–996 CrossRef.
- A. T. Duga, D. Dekeyser, K. Ruysen, D. Bylemans, D. Nuyttens, B. M. Nicolai and P. Verboven, Boundary-Layer Meteorol., 2015, 157, 517–535 CrossRef.
- T. Duga, K. Ruysen, D. Dekeyser, D. Nuyttens, D. Bylemans, B. M. Nicolai and P. Verboven, Crop Prot., 2015, 67, 200–213 CrossRef.
- A. M. Endalew, C. Debaer, N. Rutten, J. Vercammen, M. A. Delele, H. Ramon, B. M. Nicolaï and P. Verboven, Agric. For. Meteorol., 2010, 150, 1383–1392 CrossRef.
- W. A. Forster, M. O. Kimberley and J. A. Zabkiewicz, Trans. Am. Soc. Agric. Eng., 2005, 48, 1321–1330 CrossRef.
- V. Bergeron, J. Y. Martin and L. Vovelle, Agro Food Ind. Hi-Tech, 1999, 10, 21–23 Search PubMed.
- W. C. Schou, W. A. Forster, G. N. Mercer, M. E. Teske and H. W. Thistle, Trans. ASABE, 2012, 55, 2059–2066 CrossRef.
- M. Massinon, B. Dumont, N. De Cock, S. O. T. Salah and F. Lebeau, Crop Prot., 2015, 78, 63–71 CrossRef.
- C. Richard Glass, K. F. A. Walters, P. H. Gaskell, Y. C. Lee, H. M. Thompson, D. R. Emerson and X. J. Gu, Pest Manage. Sci., 2010, 66, 2–9 CrossRef CAS PubMed.
- P. R. Gunjal, V. V. Ranade and R. V. Chaudhari, AIChE J., 2005, 51, 59–78 CrossRef CAS.
- G. Strotos, M. Gavaises, A. Theodorakakos and G. Bergeles, Int. J. Heat Mass Transfer, 2008, 51, 4728–4742 CrossRef CAS.
- I. Malgarinos, N. Nikolopoulos, M. Marengo, C. Antonini and M. Gavaises, Adv. Colloid Interface Sci., 2014, 212, 1–20 CrossRef CAS PubMed.
- S. F. Lunkad, V. V. Buwa and K. D. P. Nigam, Chem. Eng. Sci., 2007, 62, 7214–7224 CrossRef CAS.
- H. Fujimoto, Y. Shiotani, A. Y. Tong, T. Hama and H. Takuda, Int. J. Multiphase Flow, 2007, 33, 317–332 CrossRef CAS.
- H.-C. Wu, W.-S. Hwang and H.-J. Lin, Mater. Sci. Eng., A, 2004, 373, 268–278 CrossRef.
- J. Y. Li, Q. Han, Y. J. Zhao and X. F. Yuan, Adv. Mater. Res., 2011, 354–355, 579–584 CrossRef.
- S. V. Minov, F. Cointault, J. Vangeyte, J. G. Pieters and D. Nuyttens, Crop Prot., 2015, 69, 18–27 CrossRef.
- C. W. Visser, P. E. Frommhold, S. Wildeman, R. Mettin, D. Lohse and C. Sun, Soft Matter, 2015, 11, 1708–1722 RSC.
- G. Lagubeau, M. A. Fontelos, C. Josserand, A. Maurel, V. Pagneux and P. Petitjeans, J. Fluid Mech., 2012, 713, 50–60 CrossRef.
- T. Mao, D. Kuhn and H. Tran, AIChE J., 1997, 43, 2169–2179 CrossRef CAS.
- J. Fukai, Y. Shiiba, T. Yamamoto, O. Miyatake, D. Poulikakos, C. M. Megaridis and Z. Zhao, Phys. Fluids, 1995, 7, 236–247 CrossRef CAS.
- D. W. Scheller and B. L. Bousfield, AIChE J., 1995, 41, 1357–1367 CrossRef.
- A. Asai, M. Shioya, S. Hirasawa and T. Okazaki, J. Imaging Sci. Technol., 1993, 37, 205–207 CAS.
- C. Mundo, M. Sommerfeld and C. Tropea, Int. J. Multiphase Flow, 1995, 21, 151–173 CrossRef CAS.
- S. S. Yoon, P. E. Desjardin, C. Presser, J. C. Hewson and C. T. Avedisian, Int. J. Multiphase Flow, 2006, 32, 132–157 CrossRef CAS.
- R. L. Vander Wal, G. M. Berger and S. D. Mozes, Exp. Fluids, 2006, 40, 53–59 CrossRef.
- J. U. Brackbill, D. B. Kothe and C. Zamach, J. Comput. Phys., 1992, 100, 335–354 CrossRef CAS.
- J. Eggers, M. a. Fontelos, C. Josserand and S. Zaleski, Phys. Fluids, 2010, 22, 062101 CrossRef.
- R. Rioboo, M. Marengo and C. Tropea, Exp. Fluids, 2002, 33, 112–124 CrossRef.
- S. T. Thoroddsen, T. G. Etoh, K. Takehara, N. Ootsuka and Y. Hatsuki, J. Fluid Mech., 2005, 545, 203–212 CrossRef CAS.
- W. Bouwhuis, R. C. A. Van Der Veen, T. Tran, D. L. Keij, K. G. Winkels, I. R. Peters, D. Van Der Meer, C. Sun, J. H. Snoeijer and D. Lohse, Phys. Rev. Lett., 2012, 109, 2–5 CrossRef PubMed.
- R. C. A. van der Veen, M. H. W. Hendrix, T. Tran, C. Sun, P. A. Tsai and D. Lohse, Soft Matter, 2014, 10, 3703–3707 RSC.
- S. Mandre, M. Mani and M. P. Brenner, Phys. Rev. Lett., 2009, 102, 4–7 CrossRef PubMed.
- M. Mani, S. Mandre and M. P. Brenner, J. Fluid Mech., 2010, 647, 163–185 CrossRef CAS.
- L. Xu, W. W. Zhang and S. R. Nagel, Phys. Rev. Lett., 2005, 94, 1–4 CrossRef.
- E. Villermaux and B. Bossa, J. Fluid Mech., 2011, 668, 412–435 CrossRef.
- S. Šikalo, H.-D. Wilhelm, I. V. Roisman, S. Jakirlić and C. Tropea, Phys. Fluids, 2005, 17, 062103 CrossRef.
- D. G. K. Aboud and A.-M. Kietzig, Langmuir, 2015, 31, 10100–10111 CrossRef CAS PubMed.
- C. Clanet, C. Béguin, D. Richard and D. Quéré, J. Fluid Mech., 2004, 517, 199–208 CrossRef.
- M. Bussmann, S. Chandra and J. Mostaghimi, Phys. Fluids, 2000, 12, 3121–3132 CrossRef CAS.
- H. Marmanis and S. T. Thoroddsen, Phys. Fluids, 1996, 8, 1344–1346 CrossRef CAS.
- D. Quéré, Phys. A, 2002, 313, 32–46 CrossRef.
- R. N. Wenzel, Ind. Eng. Chem., 1936, 28, 988–994 CrossRef CAS.
- A. S. Ellis, F. T. Smith and A. H. White, Q. J. Mech. Appl. Math., 2011, 64, 107–139 CrossRef.
- H. B. Parizi, L. Rosenzweig, J. Mostaghimi, S. Chandra, T. Coyle, H. Salimi, L. Pershin, A. McDonald and C. Moreau, J. Therm. Spray Technol., 2007, 16, 713–721 CrossRef CAS.
- L. Courbin, J. C. Bird, M. Reyssat and H. A. Stone, J. Phys.: Condens. Matter, 2009, 21, 1–13 CrossRef PubMed.
- L. Xu, Phys. Rev. E: Stat., Nonlinear, Soft Matter Phys., 2007, 75, 1–8 Search PubMed.
- P. Tsai, R. C. A. Van Der Veen, M. Van De Raa and D. Lohse, Langmuir, 2010, 26, 16090–16095 CrossRef CAS PubMed.
- L. Courbin, J. C. Bird and H. A. Stone, Chaos, 2006, 16, 58–59 CrossRef PubMed.
- J. C. Bird, S. S. H. Tsai and H. A. Stone, New J. Phys., 2009, 11, 1–10 CrossRef.
- R. E. Pepper, L. Courbin and H. A. Stone, Phys. Fluids, 2008, 20, 1–8 Search PubMed.
- D. H. Kwon, H. K. Huh and S. J. Lee, Exp. Fluids, 2014, 55, 1691 CrossRef.
| This journal is © The Royal Society of Chemistry 2016 |