
 Open Access Article
 This Open Access Article is licensed under a
 Creative Commons Attribution 3.0 Unported Licence
Substituent interference on supramolecular assembly in urea gelators: synthesis, structure prediction and NMR†
Francesca
Piana
a,
David H.
Case‡
a,
Susana M.
Ramalhete‡
b,
Giuseppe
Pileio
a,
Marco
Facciotti
a,
Graeme M.
Day
 *a,
Yaroslav Z.
Khimyak
*b,
Jesús
Angulo
b,
Richard C. D.
Brown
a and
Philip A.
Gale
*a
*a,
Yaroslav Z.
Khimyak
*b,
Jesús
Angulo
b,
Richard C. D.
Brown
a and
Philip A.
Gale
*a
aChemistry, University of Southampton, Southampton, SO17 1BJ, UK. E-mail: g.m.day@soton.ac.uk; philip.gale@soton.ac.uk
bSchool of Pharmacy, University of East Anglia, Norwich Research Park, Norwich, NR4 7TJ, UK. E-mail: y.khimyak@uea.ac.uk
First published on 29th March 2016
Abstract
Eighteen N-aryl-N′-alkyl urea gelators were synthesised in order to understand the effect of head substituents on gelation performance. Minimum gelation concentration values obtained from gel formation studies were used to rank the compounds and revealed the remarkable performance of 4-methoxyphenyl urea gelator 15 in comparison to 4-nitrophenyl analogue 14, which could not be simply ascribed to substituent effects on the hydrogen bonding capabilities of the urea protons. Crystal structure prediction calculations indicated alternative low energy hydrogen bonding arrangements between the nitro group and urea protons in gelator 14, which were supported experimentally by NMR spectroscopy. As a consequence, it was possible to relate the observed differences to interference of the head substituents with the urea tape motif, disrupting the order of supramolecular packing. The combination of unbiased structure prediction calculations with NMR is proposed as a powerful approach to investigate the supramolecular arrangement in gel fibres and help understand the relationships between molecular structure and gel formation.
Introduction
Supramolecular gels, formed by the self-assembly of molecular-scale building blocks, have a wide range of applications.1 Recently, low molecular weight (<2 kDa) organogelators have attracted attention following the development of polymer gels.2–4 The late development of this area can be explained by the serendipitous nature of the discovery of new gelators.5,6 Despite much effort, the gelation process of low molecular weight organogelators is still not fully understood.7 In particular, the correlation between precursor composition, assembly conditions and self-assembled structure remains unclear. As a consequence, many researchers have identified new gelators simply by modifying known scaffolds.8,9 However, the approach of taking known gelators and tuning them for a specific purpose is limited by the systems available and solvents required for effective gelation, which may further limit the scope of application.5 An increased understanding of the relationship between molecular and self-assembled structure would not only represent a significant scientific advance, but also enable the design of new gel-based materials.10At around the same time, Hanabusa,11 van Esch and Kellogg7,12–14 have independently exploited urea derivatives to obtain new gelators, where the urea motif represents the molecular equivalent of a Velcro® type hook-and-loop.15 This enabled molecular unidirectional self-association and, for this reason, the urea motif has been extensively used to form supramolecular assemblies. Further developments followed with the increasing awareness that gelation can be considered a kinetically-trapped phase of matter, even in molecular modelling, when compared with the thermodynamic crystalline phase.16–18 With this knowledge, functional groups began to be used as a means to manipulate the solubility parameters of gelators (e.g. long alkyl chain in polar solvents), allowing access to this metastable state and taking advantage of the modified solute–solvent interactions.19 These and many other studies during the past twenty years contributed to the formulation of three basic rules1 for designing low molecular weight gelators: (1) the existence of unidirectional intermolecular interactions to favour one-dimensional self-assembly, (2) intertwining of the aggregates for network formation, and (3) the control of fibre/solvent interfacial energy to manipulate solubility and prevent the crystallisation of the metastable gel.
The original aim of this work was to extend the understanding of molecular structure–gelation relationships by systematically varying some molecular features of a common scaffold, as exemplified in Fig. 1, in order to isolate the contribution of –NO2 and –OCH3 head substituents on a phenyl ring. Gelation test outcomes have driven the series of structural modifications that led to the synthesis of a total of eighteen analogues. As a consequence of the unusual observations made and in an effort to understand them, two representative gelators (14 and 15) underwent more comprehensive thermo-mechanical characterisation, molecular modelling and NMR studies.
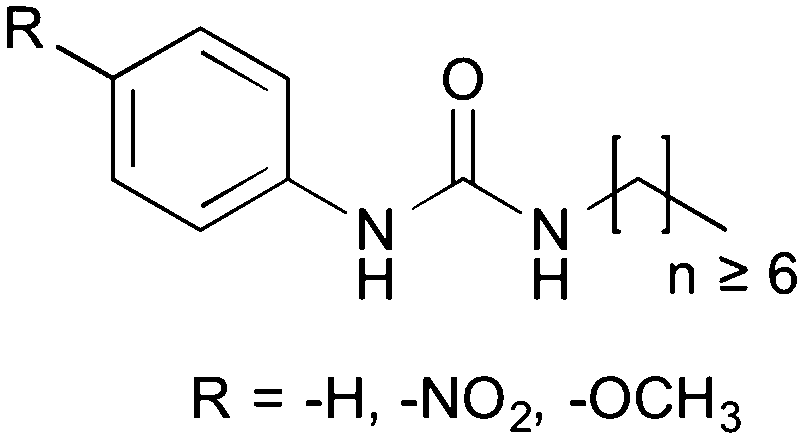 | ||
| Fig. 1 Schematic representation of the urea scaffold investigated. | ||
Results and discussion
Synthesis of the gelators
Compounds 1–18 were synthesised and all products precipitated as solids and were isolated in moderate to good yields, ESI.†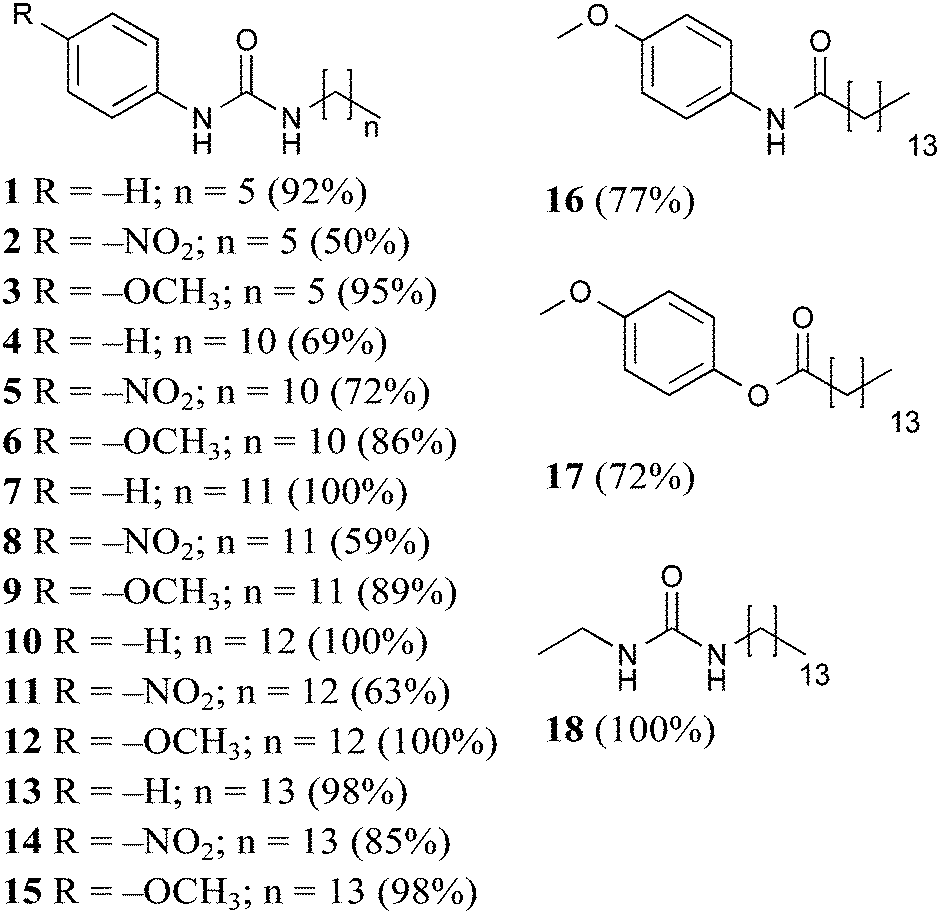
Gelation studies
Gel formation studies were performed in fifteen solvents, chosen in order to cover a wide range of polarities from hexane to water. Gelators were tested at nine different concentrations (5, 10, 15, 20, 30, 40, 50, 100, 150 mg mL−1). The threshold concentration of 20 mg mL−1 was that from which all gel formation studies commenced. If a gel was formed at this concentration, further tests at lower concentration (15, 10, 5 mg mL−1) were performed. If the result was the formation of a partial gel, more tests were conducted at higher concentrations (30, 40, 50, 100, 150 mg mL−1) in an attempt to form a gel. No further tests were carried out when no gel or insolubility was observed (ESI†). Although a wide range of solvents were tested, solvent polarity was found not to directly affect (or at least straightforwardly) gelation performance, despite reported evidence on other systems.20 For this reason, it was decided to focus on three solvents: toluene, tetralin and dimethyl sulfoxide (DMSO). Gelation performances of 1–18 were then ranked with respect to the minimum gelation concentration (MGC) values in these three solvents (Table 1).| MGC (mg mL−1) | |||
|---|---|---|---|
| Gelator | Toluene | Tetralin | Dimethyl sulfoxide |
| n.g. stands for “no gel” and i. “insoluble” results (ESI). | |||
| 1 | n.g. | n.g. | n.g. |
| 2 | n.g. | n.g. | n.g. |
| 3 | n.g. | n.g. | n.g. |
| 4 | i. | >150 | n.g. |
| 5 | i. | 20 | n.g. |
| 6 | 30 | 30 | n.g. |
| 7 | 100 | 100 | n.g. |
| 8 | 30 | i. | n.g. |
| 9 | i. | 15 | 30 |
| 10 | i. | 40 | n.g. |
| 11 | i. | 30 | n.g. |
| 12 | 20 | 15 | 100 |
| 13 | 10 | 15 | 30 |
| 14 | 20 | 20 | 50 |
| 15 | 5 | 5 | 50 |
| 16 | i. | i. | 40 |
| 17 | n.g. | n.g. | i. |
| 18 | 20 | 15 | 20 |
Gelators 1–3 bearing short alkyl chains did not form any gels due to their high solubility, indicating that solute–solvent interactions prevailed over the solute–solute interactions.21,22 Evidently, the relatively short alkyl chain (C6) was insufficient to provide enough solvophobic drive, with a weak contribution to chain packing through van der Waals interactions.
In an effort to optimise gelation performance, the number of carbon atoms in the chain was increased (C11–C14) in 4–15. Notably, it was more difficult to obtain gels in toluene in the presence of an odd numbered alkyl chain, while the presence of the even numbered C14 chain yielded the best performance in both toluene and tetralin. Additionally, no gels were formed in dimethyl sulfoxide until the alkyl chain was sufficiently long. Consequently, C14 alkyl chain analogues were chosen to study the substituent interference on the self-assembly of the class of molecules investigated in this work.
Since the inclusion of the C14 apolar moiety in 13–15 was shown to be sufficient to promote either gelation or lower MGC values and literature reports show that long n-alkanes can provide gels of remarkable stability in organic solvents,23 gelator 18 was designed and found to exhibit low MGC values (15–20 mg mL−1).
Finally, to confirm the importance of the urea hydrogen bonding motif for this scaffold, one or both urea hydrogen bonding donor sites were removed in 16 (amide) and 17 (ester). Poor gelation observed was attributed to the either extremely low or high solubility of 16 and 17, respectively, incompatible with the required balance between solute–solute and solute–solvent interactions.21
Inspection of the MCG values for gelators 13–15 indicated that the presence of the head substituent –OCH3 led to better performance (5 mg mL−1) than –NO2 (20 mg mL−1). Gelation driven by cooperative hydrogen bonding between urea functional groups in gelators 13–15 was expected to be reinforced by electron-withdrawing substitution of the aromatic head group leading to more acidic NH groups and consequently stronger hydrogen bonding interactions, with improved gelation. However, the reverse was found and gel formation studies on gelators 14 and 15 showed that the presence of electron donating –OCH3 could improve the gelation performances in two of the three selected solvents. We note that the same effect is seen in comparing 11 to 12, while with shorter chain lengths (5vs.6) there is some evidence that the –NO2 substituent improves gelation (Table 1). These observations indicate that there must be a balance of effects that influence the gelation behaviour, related to alkyl chain length, substituent electron donating or withdrawing ability, and perhaps other, less intuitive, substituent effects.
Thermo-mechanical and morphological characterisation of the gels
Studies were conducted to explore whether a simple correlation existed between the gelation performance of a compound and the thermo-mechanical characteristics of the resulting gel. The gels derived from 14 (–NO2) and 15 (–OCH3) in toluene were selected for more detailed studies.The gel–sol transition temperatures (Tgel) were obtained by differential scanning calorimetry (DSC) measurements (ESI†). Each gel sample (≈20 mg of gels at 20 mg mL−1) underwent a heating–cooling–heating cycle from 30 to 180 °C at a rate of 10 °C min−1 in sealed aluminium pans. In both samples, characteristic thermal events were only present in the first heating ramp. Their Tgel were found to be 75 °C for gel 14 and 86 °C for gel 15.
Rheological tests were performed (ESI†) with both gels showing a solid-like behaviour, where the storage modulus (G′, ≈103 Pa) was systematically larger than the loss modulus (G′′, ≈102 Pa) by roughly one order of magnitude and parallel to each other with respect to the angular frequency. Their rigid behaviour was further proved in oscillation sweep experiments, where the phase angle δ, that measures the delay between stress and strain, was found always around 10° (an ideal elastic solid has δ = 0°). Additionally, the phase angle showed no significant variation across the frequency range investigated, indicating the ability of all gels to withstand stresses below their yield stress value without showing signs of mechanical fatigue.24,25 The oscillation stress sweep experiments demonstrated that the strength of the material was increasing from gel 14 to gel 15, as confirmed by both relative order and position of the curves. It was not possible to extrapolate the yield stress values at δ = 45° since G′ and G′′ data sets never crossed each other, as the structure broke down suddenly before the final data point could be collected.
Rheology measurements, in accordance with DSC outcomes, showed the existence of a correlation between the gelation performance and the thermo-mechanical characteristics of the gel materials. 4-Nitrophenyl urea 14, a gelator with higher MGC values and therefore poorer tendency to self-assemble, also resulted in a less stable network and consequently in a weaker material when compared to 4-methoxy phenyl urea derived gel 15.
Furthermore, environmental scanning electron microscopy (ESEM) was used to investigate morphological differences in dried gel samples, defined as xerogels, obtained from gels 14 and 15 in toluene (ESI†). Two kinds of morphologies were observed in Fig. 2, possibly reflecting the head groups' influence in the supramolecular packing of the corresponding gelators during the formation of the network. Interestingly, xerogel 15 presented a more fibrillar network, when compared to xerogel 14.
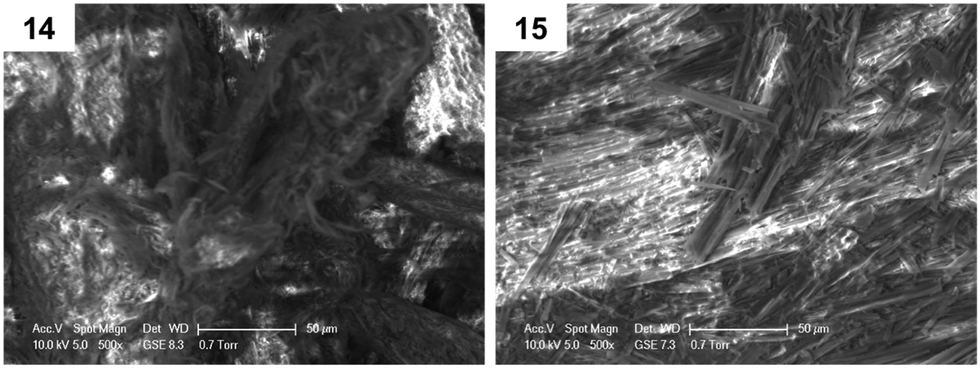 | ||
| Fig. 2 ESEM images at 500× magnification for xerogels 14 and 15. | ||
Molecular modelling
To help interpret the observed differences in gelation between 14 and 15, electronic-structure calculations were performed on both isolated molecules, as well as crystal structure prediction (CSP) calculations. We applied CSP methods here to take advantage of the developments that have been made in this area over the past few years26–29 in predicting the preferred solid-state assembly of organic molecules using a global search of the lattice energy surface. This global optimisation approach provides an unbiased assessment of molecular packing possibilities in a solid state environment, unlike other recent molecular modelling studies of gel structure based on assumed supramolecular arrangements30,31 conformational sampling of small molecular clusters,32 or dynamical simulations of pre-arranged fibre models.33,34While CSP calculations have been applied to fairly challenging molecules,35,36 due to the size and possible conformational flexibility of these molecules, the extent to which their crystal packing possibilities could be sampled is limited. Moreover, CSP generates perfect crystalline arrangements of the molecules, which might not correspond to the packing that is present in gel fibres. Therefore, the realistic goal of this study was not to determine the packing of molecules in the gel fibres, but to understand the molecules' preferred intermolecular arrangements, and the influence on solid-state packing of changing the substitution of the aromatic ring.
The initial motivation for investigating different aromatic substitutions stemmed from the potential ability of electron withdrawing or donating substituents to tune the acidity of the urea group. To investigate this inductive effect, single molecule density functional theory (DFT) calculations were performed using DMol337 at the B3LYP/DNP level of theory to investigate the electrostatic potential around 14 and 15. These calculations revealed a slightly more positive electrostatic potential at the polar hydrogen atoms of the urea in 14 compared to 15, as shown in Fig. 3, and a more negative electrostatic potential in the π-electron region of the aromatic ring for 15. These differences reflect the expected influence of the electron withdrawing and donating substituents. However, the more conspicuous difference between the molecules was the introduction of a region of negative charge at the –NO2 substituent in 14. The oxygen atoms in the –NO2 group of 14 are particularly accessible, so are positioned to easily compete with the urea oxygen as hydrogen bond acceptors for the protons of the urea group. Similarly, the oxygen of the –OCH3 substituent in gelator 15 also introduced a region of negative charge, but one that was much less strong and was shielded to some extent by the steric bulk of the methyl. These details of the electrostatic potential are significant, as they could affect the disruption of the urea “zipping”, which was associated with good gelation properties.15
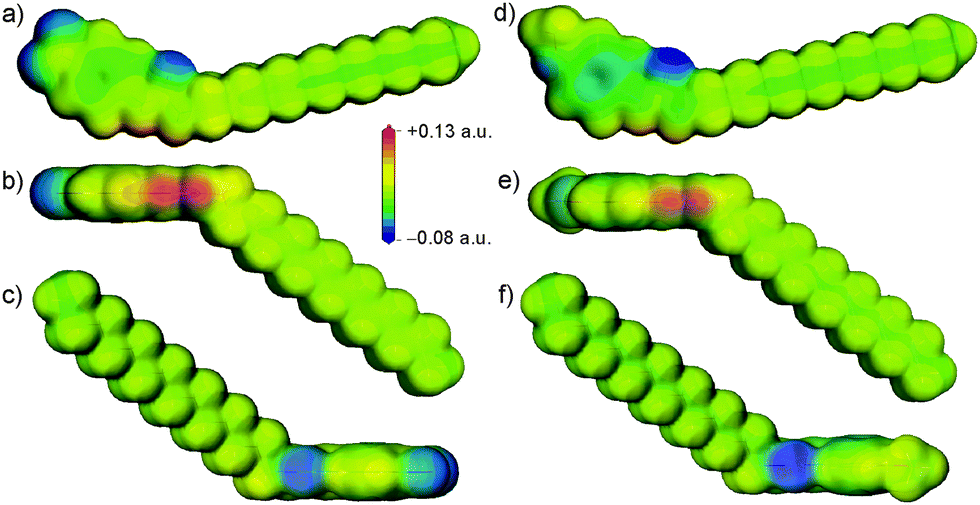 | ||
| Fig. 3 Calculated molecular electrostatic potentials of 14 (a–c) and 15 (d–f). The potentials are plotted on the 0.02 a.u. electronic isodensity surface. The red patches of positive electrostatic potential in (b) and (e) correspond to the urea hydrogen atom positions. (c and f) Show the view down the urea oxygen atom, highlighting its negative electrostatic potential. | ||
In a study of the effects of anions on urea gelators, Steed et al. has reported that only anions of sufficient hardness can disrupt this pattern.38 In comparing 14 to 15, the increased acidity of the urea hydrogen atoms could enhance the formation of urea tapes in 14, while the presence of competing hydrogen bond acceptors might have disrupted their formation. The purpose of performing CSP calculations was to explore the balance of these competing effects and the overall influence of the aromatic substituents on the preferred arrangement of these molecules.
Putative crystal structures were generated using the Global Lattice Energy Explorer software,39,40 performing quasi-random crystal structure generation, followed by lattice energy minimisation. An initial study was performed with rigid, gas phase molecular geometries, generating 5000 crystal structures in each of 16 common space groups for organic molecules, for both 14 and 15 (rigid searches were performed with two orientations of the –OCH3 group on 15, which differed by only 1.2 kJ mol−1). All crystal structures were lattice energy minimised using a force field model combining an empirically parameterised model of exchange-repulsion and dispersion interactions with an accurate atomic multipole model for intermolecular electrostatics.41 This rigid molecule approach allowed a fairly rapid exploration of crystal packing phase space, due to the reduced dimensionality of the search space and requirement only to consider intermolecular interactions in assessing the relative stabilities of the predicted structures.
These initial calculations displayed a clear difference in the predicted crystal packing behaviours of gelators 14 and 15. The low energy predicted structures of gelator 15 displayed hydrogen bonding between urea groups, predominantly forming the one-dimensional urea chains or tapes (Fig. 4d and f) that were associated with gel fibre formation. The –OCH3 did not participate in hydrogen bonding. In contrast, the low energy structures of 14 lacked the N–H⋯Ourea hydrogen bonding linking urea into one-dimensional chains or tapes; the CSP results suggested that the urea tape formation was disrupted by the presence of the –NO2 group, which preferentially acted as a hydrogen bond acceptor amongst the low energy predicted crystal structures (Fig. 4b).
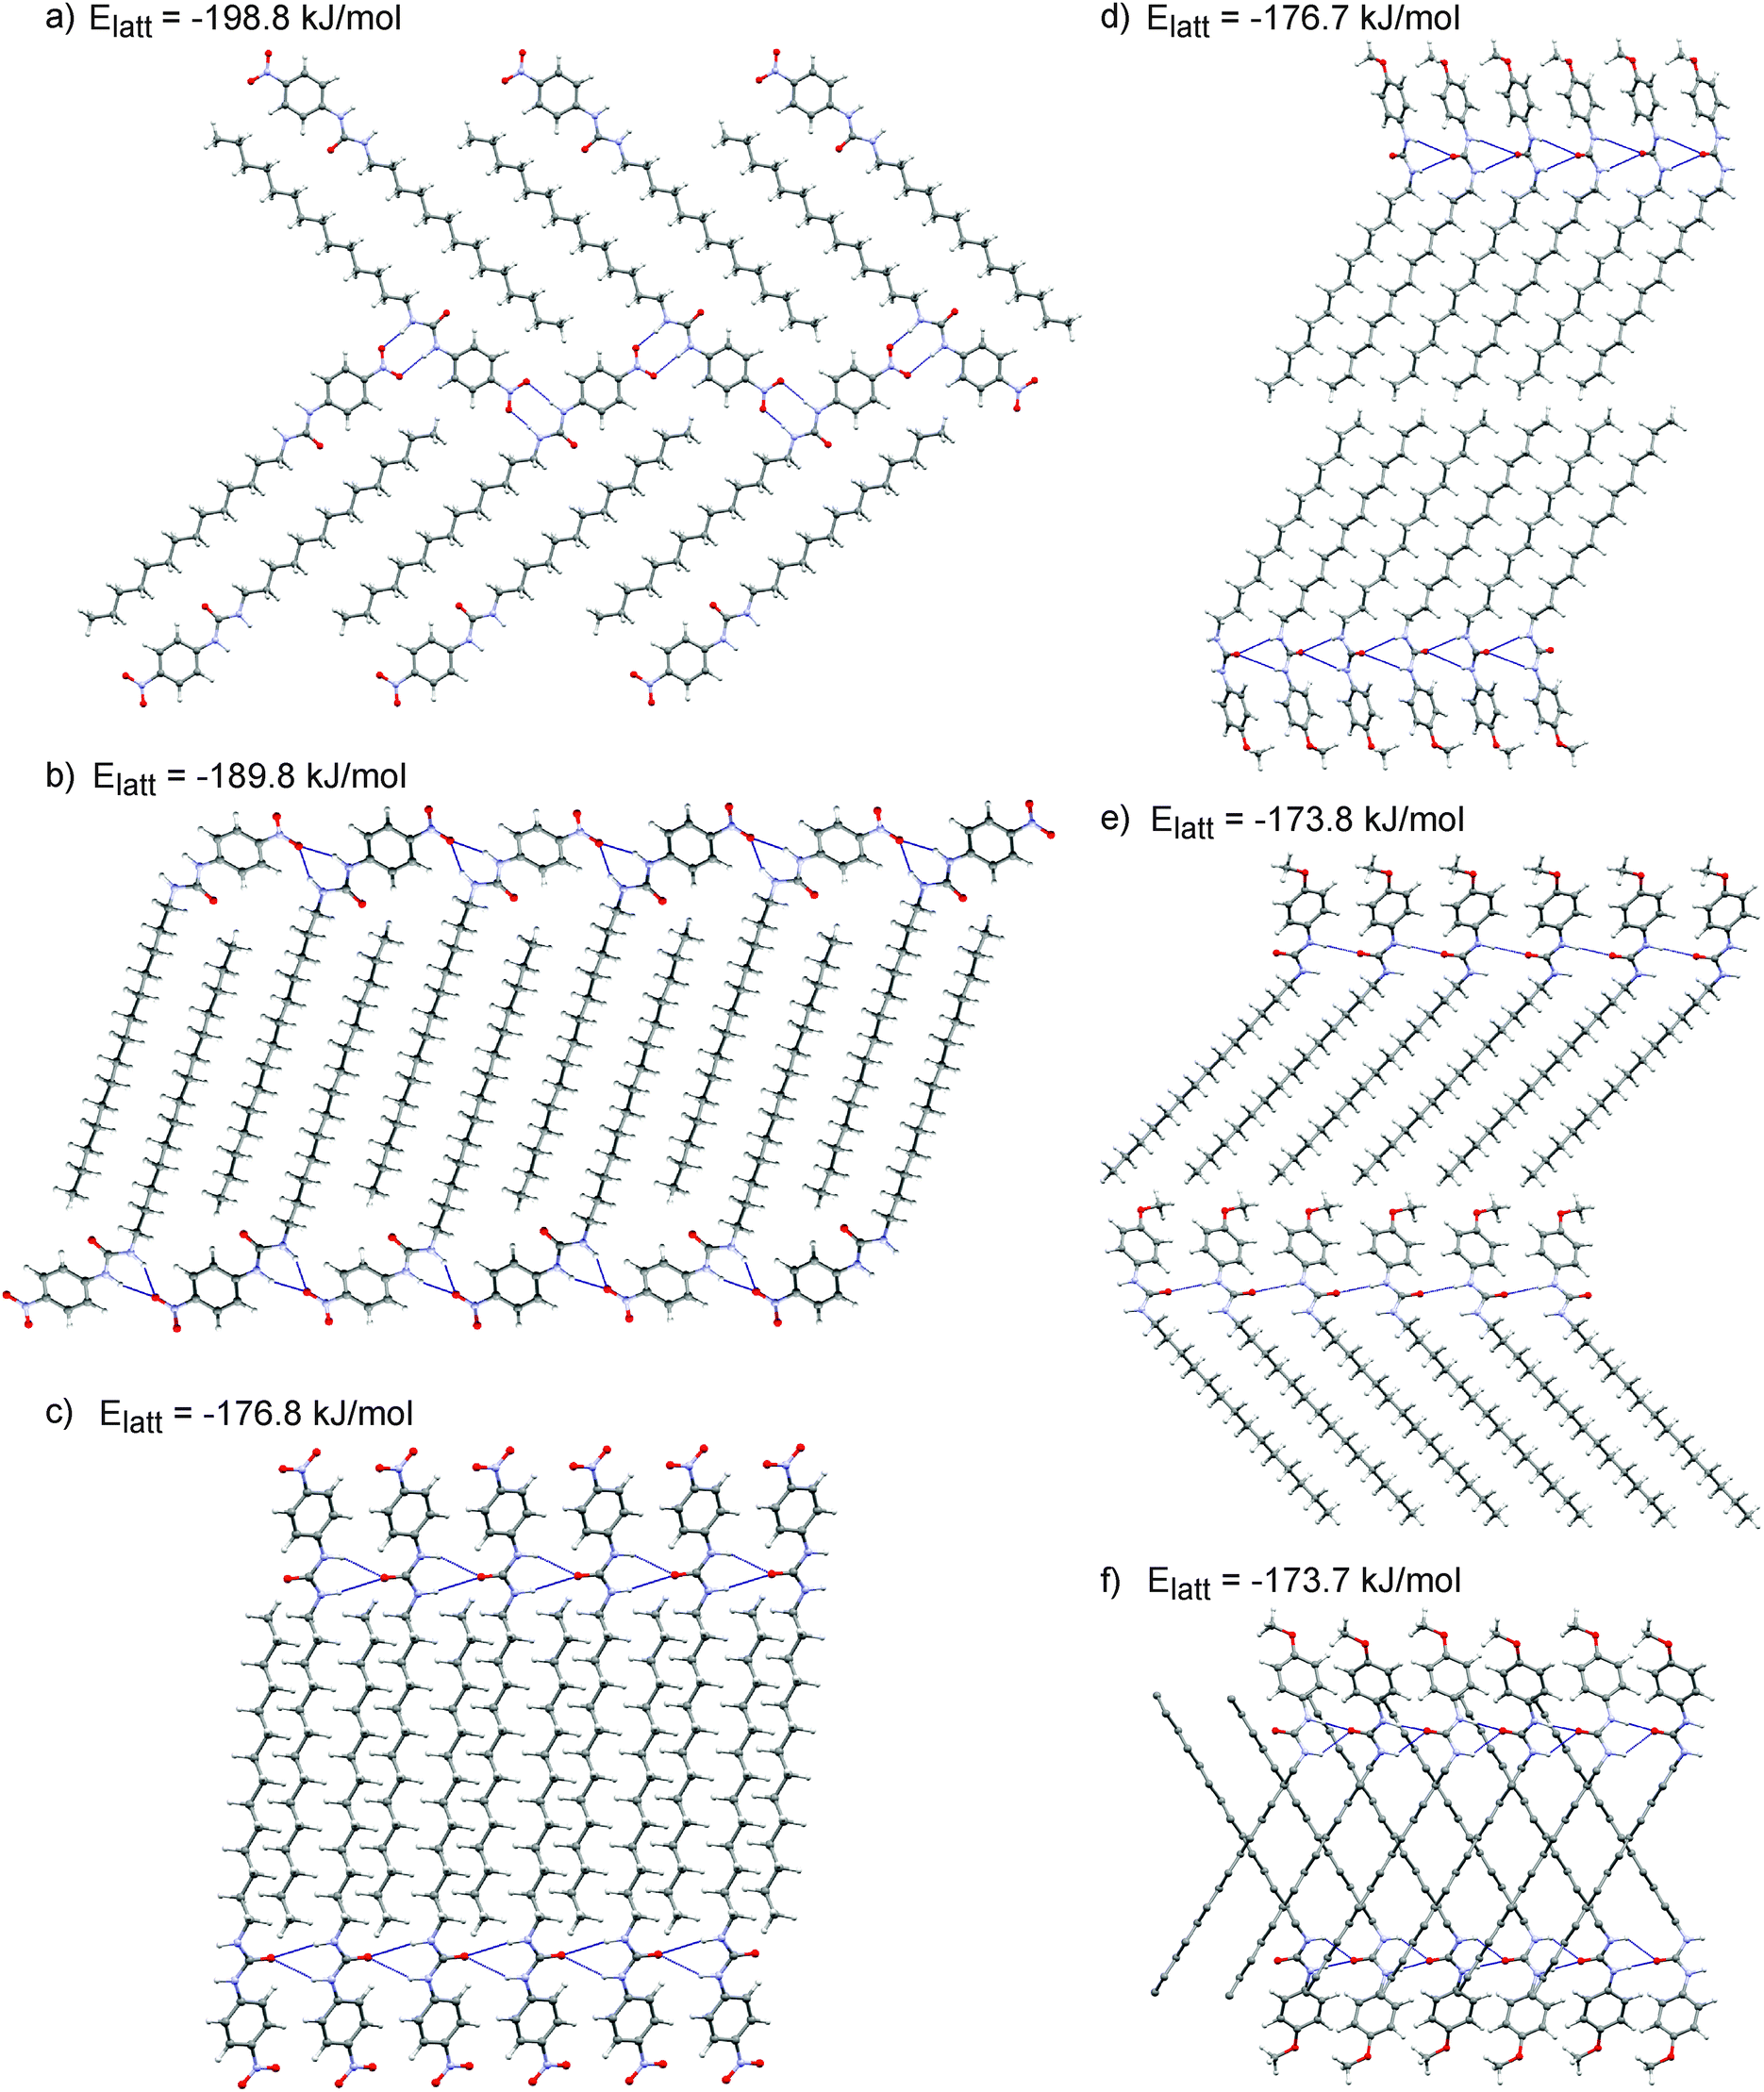 | ||
| Fig. 4 Molecular packing in representative low energy predicted crystal structures of 14 (a–c) and 15 (d–f). (a and d) Are the global minimum energy crystal structures that have been located for each molecule. Calculated lattice energies of each structure are shown. Hydrogen bonds are shown as dashed blue lines. Hydrogen atoms on the alkyl chains are hidden in (f) for clarity. | ||
To verify that these findings were not biased by the simplification of using rigid molecular geometries in the crystal structure search, further CSP calculations were performed with flexibility of the molecular geometry allowed during structure generation and lattice energy minimisation. These more demanding calculations provide the opportunity for molecules to explore packing arrangements that are inaccessible to the molecules in their gas phase geometries, as well as to optimise their hydrogen bonding networks, which can be very sensitive to small changes in molecular geometry. A further 5000 crystal structures were generated and minimised in each of the same 16 space groups for each molecule, with flexibility in the two dihedral angles around N–C bonds connecting the urea to the aromatic ring and alkyl chain. Flexibility of the dihedral connecting the –NO2 or –OCH3 group to the aromatic ring was also included. Molecular distortion corresponding to up 22 kJ mol−1 was allowed during the search, as this is the largest intramolecular strain seen in crystalline molecular geometries of small organic molecules.42
Unlike intermolecular interactions, atom–atom force fields to describe intramolecular energies lack the accuracy required for CSP. Modern methods combine atom–atom intermolecular models with a DFT description of intramolecular geometry and energy.27 Here, we applied a newly developed method in which the intramolecular energies and atomic partial charges were modelled with a Gaussian process regression model fitted to DFT data.43 Details of the model, structure generation and energy minimisation are provided as ESI.† All structures generated with the flexible search had their final energies calculated with the same anisotropic atom–atom force field intermolecular energy model used in the rigid structure search.
These flexible-molecule calculations did not change the overall conclusions from the initial calculations: hydrogen bonded urea tapes dominate the low energy structures of 15, while the low energy structures of 14 are dominated by urea hydrogen bonded to –NO2. However, the details of these interactions were modified by giving the molecule freedom to distort from its ideal geometry. For 14, a slight reorientation of the alkyl chain allowed the alignment of both –NO2 oxygen atoms with urea hydrogen atoms, forming a double hydrogen bond, as shown in Fig. 4a. This interaction was found in the overall lowest energy predicted structures of 14 and provided a significant stabilisation. The total energy of the best structure involving the double hydrogen bond (Fig. 4a) is 9 kJ mol−1 more stable than the lowest energy structure involving only one –NO2 oxygen in hydrogen bonding (Fig. 4b). The lowest energy predicted crystal structure of 14 that displayed the urea hydrogen bond tape motif was a further 13 kJ mol−1 higher in energy (Fig. 4c), outside the energetic range that would be observable in small molecule crystal structures.44 This gives an indication of the strength of the ability of the oxygen atoms on the –NO2 group to interfere with the urea-tape packing motif.
For gelator 15, the influence of molecular flexibility on the predictions was subtler; here, freedom of the molecule to distort from its gas phase geometry led to some low energy structures with planar urea tapes (Fig. 4e), whereas these interactions were twisted or buckled in the best structures generated with the rigid gas phase geometry, as per Fig. 4d and f. The difference in lattice energies of the most stable predicted structures of each (−198.8 kJ mol−1 for 14vs. −176.7 kJ mol−1 for 15) further highlighted the strength of the urea⋯O2N interaction. The calculated lattice energies of the lowest energy urea-tape structures of each molecule, as shown in Fig. 4cvs.Fig. 4d, were remarkably similar.
There are various types of interactions in these systems, including hydrogen bonding and van der Waals interactions, which can be maximised by stacking of the aromatic rings and aligning molecular tails. All of the low energy structures in the CSP were densely packed. It was seen, though, that in the systems of gelator 15 all of the types of interactions were associated within a pair of neighbouring molecules, i.e. they had a tendency to align tails, urea groups, and aromatic groups in series, a behaviour that is thought to be associated with the formation of a self-assembled fibrillar network (SAFIN) in gels.4,45 For gelator 14, there was instead a strong interaction between the urea and the –NO2 group of molecules, but these two molecules could not then align their tails and arrange aromatic groups into π-stack (Fig. 4a and b). These CSP results suggested that, rather than the acidity of the urea group determining the difference in behaviour of 14 and 15, it was such compromises between sources of strong interaction that may cause the differing observations in the gel formation experiments.
Powder X-ray diffraction
Semicrystalline structures attributed to the gel fibres were verified by the presence of diffraction peaks PXRD patterns (ESI†) acquired on gel samples without the need to remove any amount of solvent.Comparison between the simulated and observed diffraction patterns must take into account the expected discrepancies between the lattice parameters of modelled structures and packing in the gel fibres, which are usually a few percent in lattice parameters, as well as differences in reflection intensities caused by orientation of the gel fibres. Nevertheless, several of the predicted crystal structures for each molecule were identified as giving similar simulated diffraction patterns to those observed from the gels (Fig. 5). These comparisons support the conclusions from the structure prediction: for 15, those structures that give similar PXRD patterns all include the hydrogen bond urea tapes, while urea–nitro hydrogen bonding is present in all structures of 14 that give good agreement with the observed diffraction pattern. The structures that give good agreement with the experimental PXRD patterns include some of the lowest energy predicted structures of each molecule (Fig. 4a and e, −198.8 kJ mol−1 for 14 and −176.8 kJ mol−1 for 15).
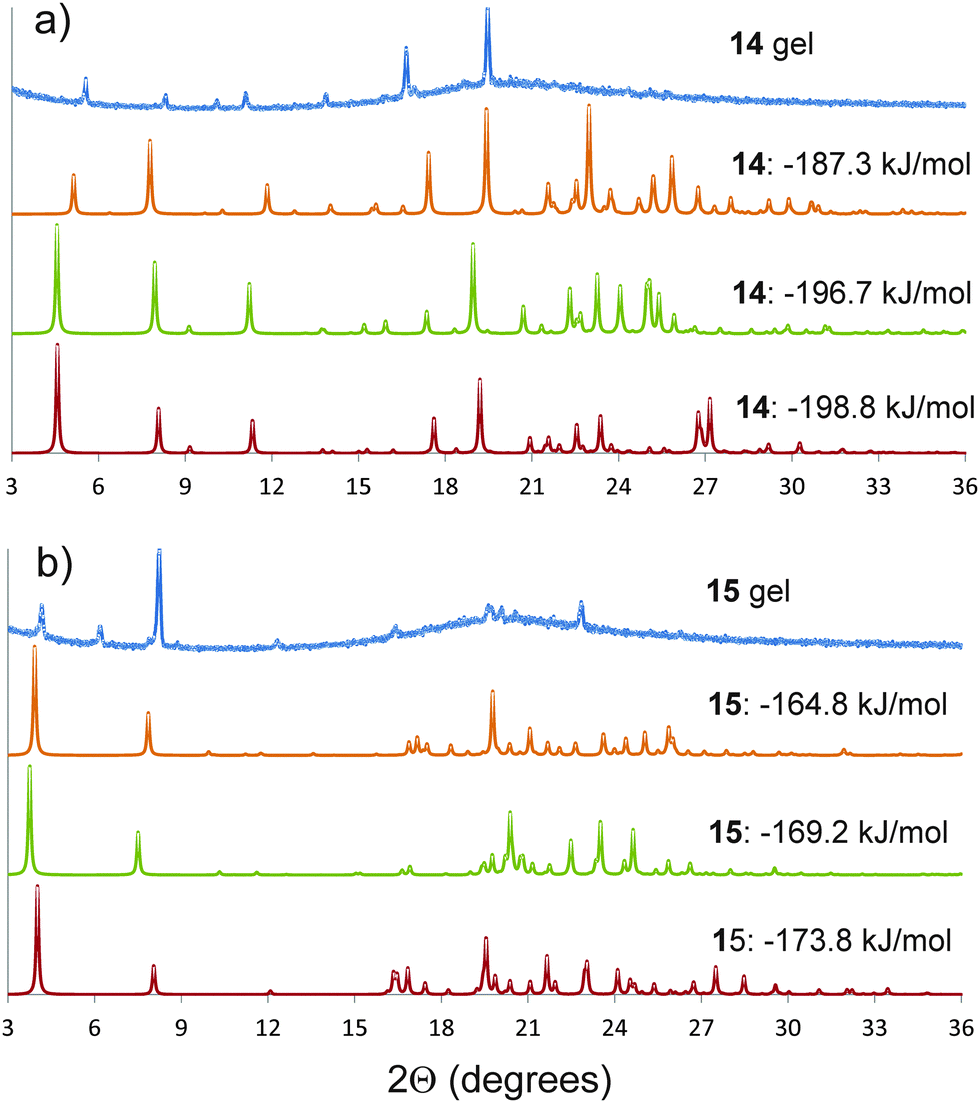 | ||
| Fig. 5 Powder X-ray diffraction patterns of the gels (a) 14 and (b) 15 in DMSO, compared to simulated diffraction patterns from low energy predicted structures that give similar diffraction patterns to the gels. The simulated patterns from the predicted structures are labelled by their calculated lattice energies. The simulated diffraction patterns of 14 and 15 with lattice energies of −198.8 and −173.8 kJ mol−1 correspond to the predicted crystal structures reported in Fig. 4a and e, respectively. A larger set of comparisons is provided in the ESI.† | ||
NMR chemical shielding calculations were performed on all of the predicted structures that gave good agreement with gel PXRD patterns, vide infra.
NMR spectroscopy
NMR spectroscopy enabled us to get further insight into the molecular level organisation of the gels. This technique has already proven its potential in characterising structure and dynamics of soft materials.46,47 These multiphasic materials required both solution and solid-state NMR spectroscopy to probe mobile entities and rigid components of the gel network, respectively. NMR studies were conducted with gels prepared from dimethyl sulfoxide to avoid overlapping of aromatic peaks with solvent peaks from toluene and tetralin. NOESY solution-state NMR experiments provided information on spatial connectivity between molecular regions in aggregated states.7 Cross-peaks in 2D 1H–1H NOESY (ESI†) spectra of gels 14 and 15 displayed the same phase as the diagonal peaks, as shown in Fig. 6, indicative of negative NOE enhancements, which are characteristic of large molecules. Since these systems are exclusively formed of small gelator molecules (<600 Da), these negative enhancements can be attributed to medium-large supramolecular aggregates, which are the building blocks required for gel formation. Therefore, NOESY experiments allowed probing interactions originating the gel network.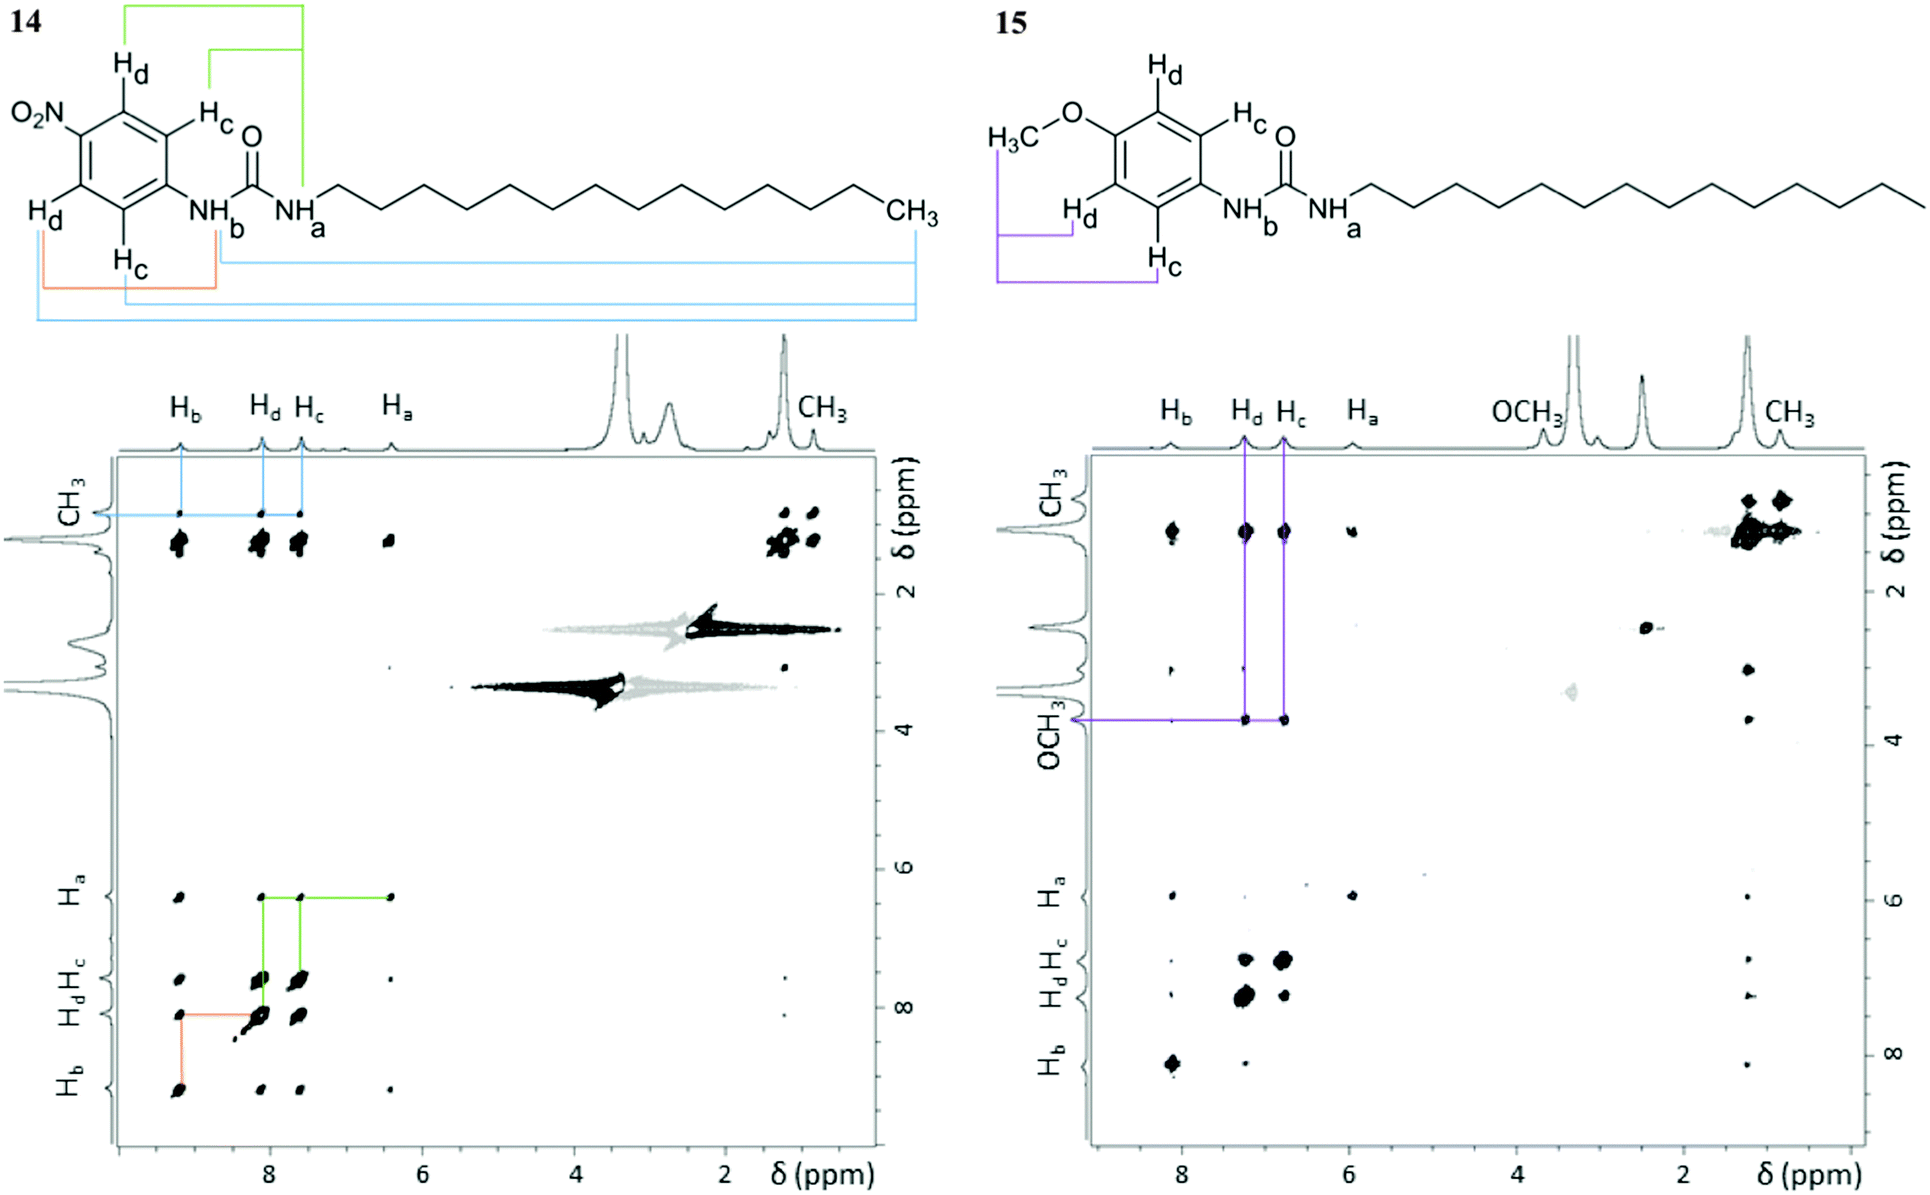 | ||
| Fig. 6 2D 1H–1H NOESY spectra of gels 14 and 15 (60 mg mL−1 in DMSO-d6) acquired at 25 °C with a mixing time of 0.5 s using a 800.23 MHz spectrometer. Relevant cross-peaks have the corresponding spatial connectivity assigned (coloured lines). The cross-peaks observed between the –CH2 and the aromatic protons in gel 15 do not contain structural information, as they result from indirect NOE enhancements, only observable at long mixing times (ESI†). | ||
As shown in Fig. 6, cross-peaks between the –CH3 protons of the alkyl chain and the aromatic and urea ones were identified in gel 14, whereas they were not detected for gel 15. The presence of such cross-peaks in gel 14 revealed close proximity between the end of the aliphatic chain, the benzene ring and the urea moiety (Table 2), belonging either to the same or to surrounding molecules. Such an arrangement was suggested by the CSP calculations, whose results showed that the urea H⋯O2N interaction leads to interdigitation of the aliphatic chains, as shown in Fig. 4a and b, which places the end of the chain near to the aromatic rings of neighbouring molecules. Furthermore, intermolecular cross-peaks between distant NHa and Hc or Hd (Fig. 6) suggested proximity of the aromatic ring to another molecule with a different orientation. Conversely, the absence of cross-peaks between the alkylic –CH3 protons, the aromatic, the urea and the –OCH3 sites in gel 15 suggested a well-aligned network in which the long aliphatic chains are positioned separately from aromatic and urea groups. In addition, the absence of cross-peaks between NHa and Hc or Hd (Fig. 6) was also in agreement with the predicted well defined stacking of the aromatic rings in the 3D network of gel 15.
| Pair of protons | r (Å) | |
|---|---|---|
| Gel 14 | Gel 15 | |
| a Pairs of protons for which cross-peaks were observed only at mixing times longer than 0.25 s, thus preventing accurate calculations of distances. | ||
| Hc/Hd (ref) | 2.49 | 2.47 |
| NHa/NHb | 2.85 | 2.50 |
| CH3/Hc | 4.24 | n/a |
| CH3/Hd | 4.11 | n/a |
| CH3/NHa | 4.03 | n/a |
| CH3/NHb | 4.31 | n/a |
| NHa/Hc | 3.74 | n/a |
| NHa/Hd | 3.58 | n/a |
| NHb/Hc | 3.16 | |
| NHb/Hd | 3.40 | |
1H–13C CP/MAS NMR experiments48 can probe rigid components of the gel samples and were therefore used to study the molecular packing of the gel fibres. Despite the presence of high contents of solvent which was expected to lead to an increased mobility and a reduced efficiency of polarisation transfer, we were able to acquire 1H–13C CP/MAS NMR spectra of gels 14 and 15. The detection of peaks in 1H–13C CP/MAS NMR spectra of these gels was indicative of a rigid 3D fibrous network, with densely packed molecules as predicted by molecular modelling studies. To the best of our knowledge, this is the first example of supramolecular gels in which 1H–13C CP/MAS NMR peaks were detectable without any physical modification of the gel samples, i.e. removing any amount of the solvent or lowering the temperature.49
For gels 14 and 15, aliphatic carbons appeared as sharp resonances, while low intensity peaks were observed for the aromatic and carbonyl carbons (and –OCH3 carbon in gel 15) in spectra acquired at 25 °C and 1 kHz MAS rate, as shown in Fig. 7a (the assignment is provided separately, ESI†). The presence of sharp peaks is in agreement with the semicrystalline gel fibres identified in PXRD experiments. Lowering the temperature to 15, 10, 5 and 0 °C enabled us to record 1H–13C CP/MAS NMR spectra at higher MAS rates, as shown in Fig. 7b–g. This led to significant narrowing of the aromatic and carbonyl carbons (and –OCH3 carbon in gel 15), with spinning sidebands present in accordance with the specific MAS rate. No significant differences were observed for the chemical shift values in the spectra acquired at lower temperatures.
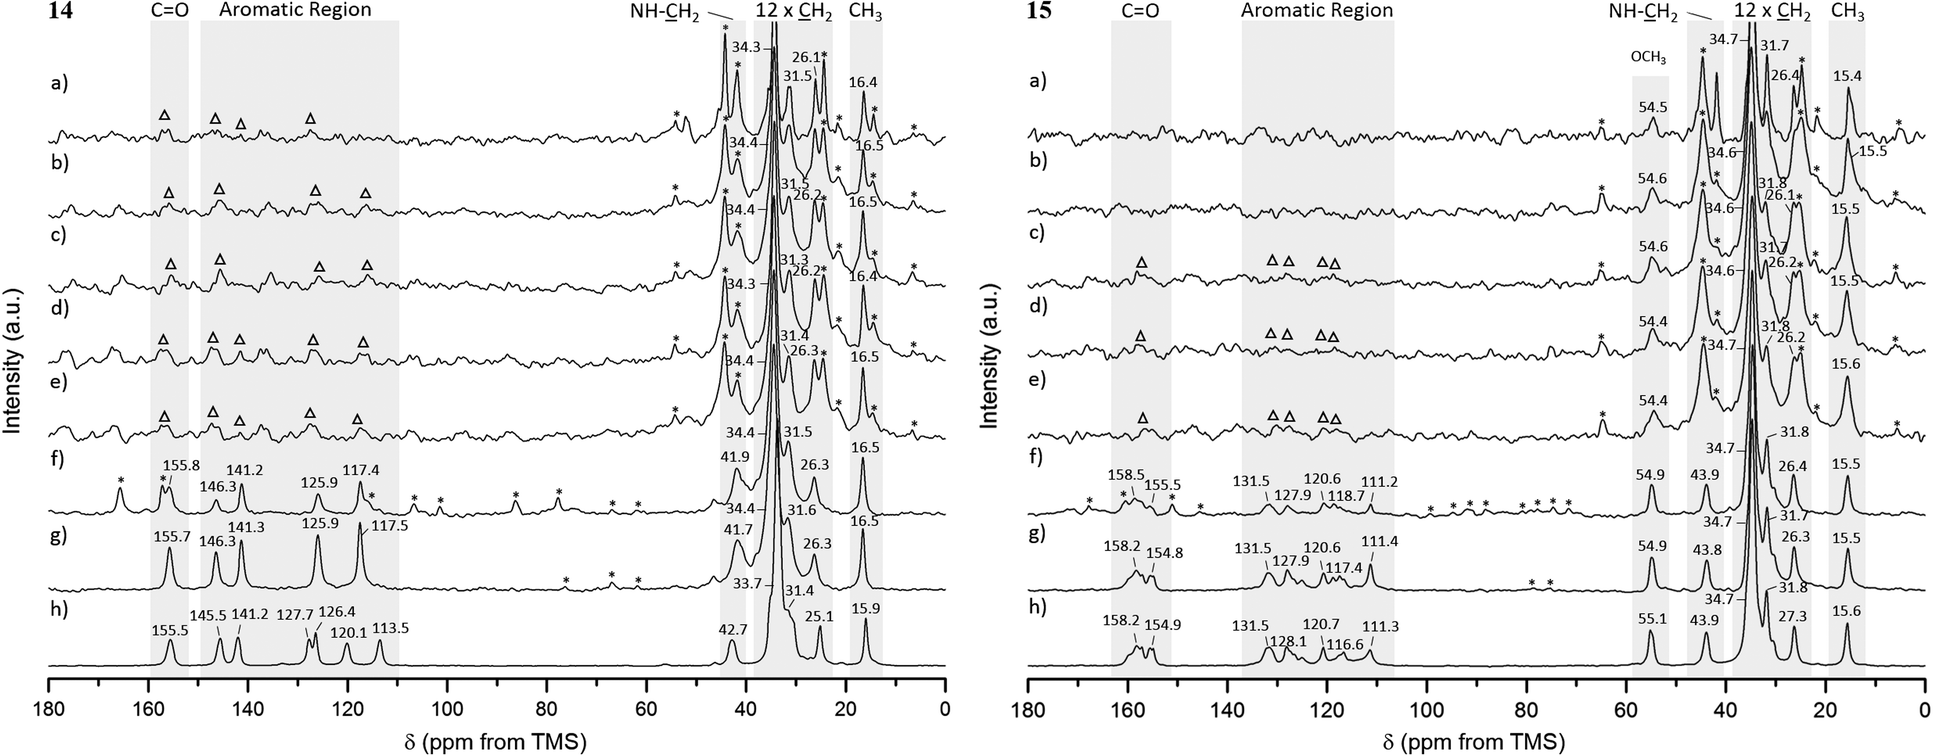 | ||
| Fig. 7 1H–13C CP/MAS NMR spectra of gel samples (60 mg mL−1 in DMSO-d6) acquired at 25 °C and 1 kHz MAS rate (a), frozen gel samples acquired at 15 °C (b), 10 °C (c) and 5 °C (d) and 1 kHz MAS rate; frozen gel samples acquired at 0 °C and 1 kHz (e), 4 kHz (f) and 8 kHz (g) MAS rates, and reference solid powders acquired at 25 °C and 10 kHz MAS rate (h) for 14 and 15. Low-resolution aromatic peaks are highlighted with triangles (△) and spinning sidebands with asterisks (*). | ||
The 1H–13C CP/MAS NMR spectrum of frozen gel 14 acquired at an MAS rate of 8 kHz (Fig. 7g) presented a single peak per carbon, indicative of one magnetic environment for each carbon site. Peaks at 125.7 and 117.2 ppm resulted from overlapped resonances of carbons C2 and C6, and C3 and C5, respectively (Fig. 8), as predicted by solid-state DFT calculations. The variation of chemical shift values between the reference solid powder 14 (Fig. 7h) and the resulting gel suggested the molecular organisation of the gel fibres was different from the reference solid powder.
 | ||
| Fig. 8 Aromatic carbon labels for gelator 14. | ||
In contrast to gel 14, frozen gel 15 acquired at an MAS rate of 8 kHz (Fig. 7g) showed several peaks per carbon in the aromatic region, indicating the same carbon can experience different magnetic environments in different molecules. These results suggested the presence of multiple symmetrically independent gel molecules in the structure. Structures with multiple independent molecules (Z′ > 1) are not uncommon in molecular crystals and it is not surprising that this phenomenon carries over to gel fibre packing.50 This observation reflects the symmetry of molecular packing and does not imply a less organised structure. However, this finding does mean that the packing in the gel 15 fibres cannot be perfectly described by any one of the predicted crystal structures, since the molecular modelling studies were conducted considering only one molecule in the asymmetric unit (Z′ = 1). Furthermore, the similarity in chemical shift values of the reference solid powder 15 (Fig. 7h) and the resulting gel pointed towards a self-assembled network with a 3D organisation similar to that of the crystalline powder.
For comparison, NMR chemical shielding calculations were performed for the predicted crystal structures of gelators 14 and 15 and gave reasonable agreement with the gel X-ray diffraction pattern, ESI† (Fig. 5), using DFT calculations (with the PBE functional and a plane wave basis set, ESI†) and the GIPAW51 methodology. Despite the similarities in intermolecular interactions, we found a reasonable variation in predicted chemical shifts from the selected structures (see ESI†). Amongst these structures, the simulated 13C chemical shifts for the lowest energy predicted structures (−198.8 kJ mol−1 for 14, reported in Fig. 4a, and −173.8 kJ mol−1 for 15, reported in Fig. 4e) were found to be in best agreement with the 13C chemical shift values observed for gel fibres (Fig. 9), with RMSD (predicted – observed) of 1.8 ppm for 14 and 1.4 ppm for 15. These deviations are as low as those seen in comparing observed 13C chemical shifts with those predicted from known single crystal structures of small organic molecules.52 These results strongly support the relevance of the predicted structures in interpreting the properties of the two gelators.
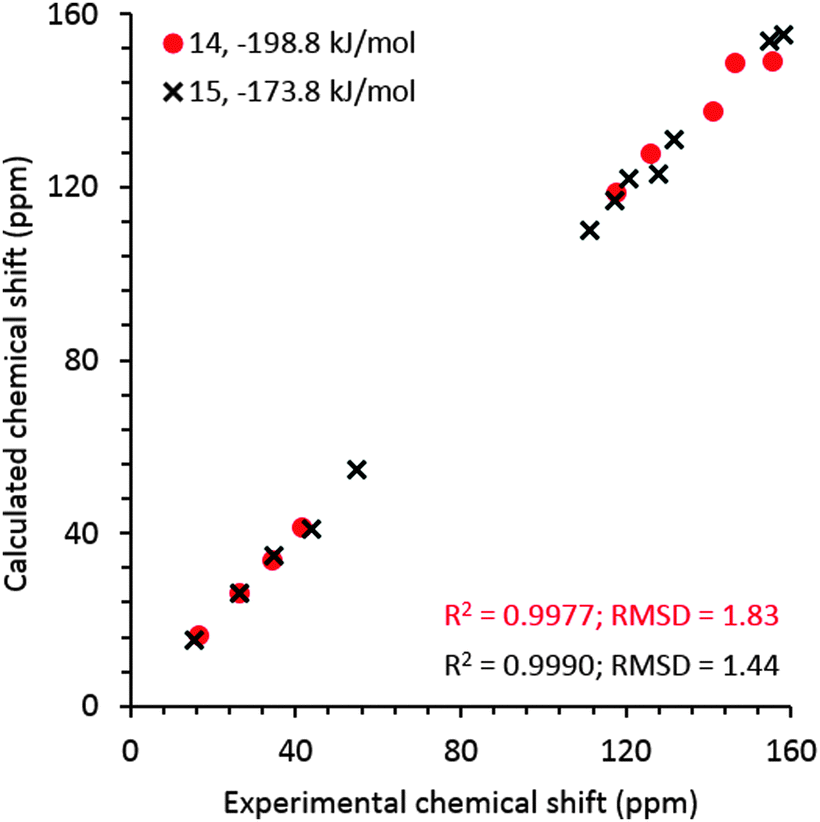 | ||
| Fig. 9 Experimental 13C chemical shift values for frozen gels 14 and 15 derived from the spectra acquired at 0 °C and an MAS rate of 8 kHz vs. calculated values for the predicted structures that give best agreement with both NMR and PXRD from the gel. Calculated isotropic chemical shieldings were converted to chemical shifts by matching the calculated and observed chemical shift of the CH3 carbon in gel. The structures for gelators 14 and 15 correspond to those reported in Fig. 4a and e, respectively. | ||
The increased resolution obtained for the aromatic and carbonyl carbons (and –OCH3 carbon in gel 15) upon spinning at higher MAS rates, with no significant changes for the aliphatic carbons, strongly indicated that chemical shift anisotropy is considerable for the aromatic and carbonyl carbons (and –OCH3 carbon in gel 15), even in the gel state. The solid-state DFT calculations of NMR properties (ESI†) performed for the low energy predicted crystal structures confirmed that the anisotropy of the shielding tensors for the aromatic and carbonyl carbon atoms was much larger (in the range from 108 to 192 ppm) than for the aliphatic carbons (in the range from 19 to 43 ppm) for both gelators, supporting the previous conclusions. The –OCH3 carbon in gel 15 was narrower than the aromatic carbons, but the peak sharpened as a result of spinning faster, in agreement with the DFT calculated intermediate anisotropy of the shielding tensor (ca. 70 ppm). Hence, the significantly broadened peaks detected for aromatic and carbonyl carbons at low MAS rates in 1H–13C CP/MAS NMR spectra of gels 14 and 15 were most likely due to the high values of chemical shift anisotropy for these carbon sites.
Overall, the combination of calculation, diffraction and NMR studies provides valuable insight into the molecular level organisation, offering likely motifs of intermolecular packing and local structure in the gels.
Conclusions
The aim of this work was to study the influence of the electron-withdrawing (–NO2) and electron-donating (–OCH3) head substituents on the gelation performances of urea gelators. The thermo-mechanical characterisation of gels 14 (20 mg mL−1) and 15 (5 mg mL−1) confirmed the latter to be a stronger material, expressing higher Tgel and more solid-like rheological behaviour. The results of the crystal structure prediction calculations suggested that, rather than changes in the acidity of the urea group, the differences observed in their gelation performance is due to the presence of strong competing interactions between the –NO2 head substituent and the urea. The computational studies of ideal crystals quantified these interactions, and we therefore suggest that the availability of substituent groups to form competing interactions must be considered in any programme of rationally designed self-assembling systems. The crystalline arrangements produced by the modelling studies and their molecular contacts detected by NOESY solution-state NMR experiments showed that gelator 15 has a tendency to align tails, urea groups, and aromatic rings in series. Conversely, such well stacked supramolecular assemblies were not observed in gelator 14, due to the perturbing influence of the –NO2 group on the formation of the urea tape motif. These materials were proven to be rigid by 1H–13C CP/MAS solid-state NMR studies and therefore some insight into preferred molecular arrangements was gained, particularly through comparison with simulated chemical shifts of the predicted structures. Despite the limitations of molecular modelling studies of gels, when validated by solid-state NMR experiments, these have a great potential in unravelling structure of supramolecular gels.Acknowledgements
FP, PAG and RCDB thank the A-I Chem Channel project, an European INTERREG IV A France (Channel) – England Cross border cooperation programme, co-financed by ERDF. FP thanks Dr A. I. Pop for practical advice in the synthesis of some of the molecules. PAG and RCDB thank EPSRC EP/K039466/1 (Core Capability for Chemistry Research in Southampton). PAG thanks the Royal Society and the Wolfson Foundation for a Research Merit Award. DHC and GMD thank the European Research Council for funding under the European Union's Seventh Framework Programme (FP/2007–2013)/ERC Grant Agreement no. 307358 (ERC-StG-2012-ANGLE). We acknowledge the use of the IRIDIS High Performance Computing Facility at the University of Southampton for CSP calculations, and via our membership of the UK's HEC Materials Chemistry Consortium, which is funded by EPSRC (EP/L000202), the NMR modelling work used the ARCHER UK National Supercomputing Service. SMR thanks UEA for a postgraduate studentship.Notes and references
- N. Zweep and J. H. van Esch, in The Design of Molecular Gelators, Functional Molecular Gels – RSC Soft Matter Series, ed. B. Escuder and J. F. Miravet, The Royal Society of Chemistry, 2014, pp. 1–26 Search PubMed.
- P. Terech and R. G. Weiss, Chem. Rev., 1997, 97, 3133–3160 CrossRef CAS PubMed.
- J. H. van Esch, Langmuir, 2009, 25, 8392–8394 CrossRef CAS PubMed.
- N. M. Sangeetha and U. Maitra, Chem. Soc. Rev., 2005, 34, 821–836 RSC.
- D. M. Zurcher and A. J. McNeil, J. Org. Chem., 2015, 80, 2473–2478 CrossRef CAS PubMed.
- R. G. Weiss, J. Am. Chem. Soc., 2014, 136, 7519–7530 CrossRef CAS PubMed.
- F. S. Schoonbeek, J. H. van Esch, R. Hulst, R. M. Kellogg and B. L. Feringa, Chem. – Eur. J., 2000, 6, 2633–2643 CrossRef CAS.
- N. A. Dudukovic and C. F. Zukoski, Soft Matter, 2014, 10, 7849–7856 RSC.
- H. Sato, E. Nogami, T. Yajima and A. Yamagishi, RSC Adv., 2014, 4, 1659–1665 RSC.
- K. L. Morris, L. Chen, A. Rodger, D. J. Adams and L. C. Serpell, Soft Matter, 2015, 11, 1174–1181 RSC.
- K. Hanabusa, K. Shimura, K. Hirose, M. Kimura and H. Shirai, Chem. Lett., 1996, 885–886 CrossRef CAS.
- J. van Esch, R. M. Kellogg and B. L. Feringa, Tetrahedron Lett., 1997, 38, 281–284 CrossRef CAS.
- J. van Esch, S. De Feyter, R. M. Kellogg, F. De Schryver and B. L. Feringa, Chem. – Eur. J., 1997, 3, 1238–1243 CrossRef CAS.
- J. H. van Esch, F. Schoonbeek, M. de Loos, H. Kooijman, A. L. Spek, R. M. Kellogg and B. L. Feringa, Chem. – Eur. J., 1999, 5, 937–950 CrossRef CAS.
- J. W. Steed, Chem. Soc. Rev., 2010, 39, 3686–3699 RSC.
- D. J. Adams, K. Morris, L. Chen, L. C. Serpell, J. Bacsa and G. M. Day, Soft Matter, 2010, 6, 4144–4156 RSC.
- K. M. Anderson, G. M. Day, M. J. Paterson, P. Byrne, N. Clarke and J. W. Steed, Angew. Chem., Int. Ed., 2008, 47, 1058–1062 CrossRef CAS PubMed.
- B. Escuder, S. Martí and J. F. Miravet, Langmuir, 2005, 21, 6776–6787 CrossRef CAS PubMed.
- W. Edwards, C. A. Lagadec and D. K. Smith, Soft Matter, 2011, 7, 110–117 RSC.
- Y. Lan, M. G. Corradini, R. G. Weiss, S. R. Raghavan and M. A. Rogers, Chem. Soc. Rev., 2015, 44, 6035–6058 RSC.
- K. K. Diehn, H. Oh, R. Hashemipour, R. G. Weiss and S. R. Raghavan, Soft Matter, 2014, 10, 2632–2640 RSC.
- C. A. Hunter, Angew. Chem., Int. Ed., 2004, 43, 5310–5324 CrossRef CAS PubMed.
- D. J. Abdallah and R. G. Weiss, Langmuir, 2000, 16, 352–355 CrossRef CAS.
- H. A. Barnes, The oscillatory response of real systems, A Handbook of Elementary Rheology, The University of Wales Institute of Non-Newtonian Fluid Mechanics, 1st edn, 2000, pp. 92–98 Search PubMed.
- F. Piana, M. Facciotti, G. Pileio, J. R. Hiscock, W. Van Rossom, R. C. D. Brown and P. A. Gale, RSC Adv., 2015, 5, 12287–12292 RSC.
- G. M. Day, Crystallogr. Rev., 2011, 17, 3–52 CrossRef.
- A. V Kazantsev, P. G. Karamertzanis, C. S. Adjiman, C. C. Pantelides, S. L. Price, P. T. A. Galek, G. M. Day and A. J. Cruz-Cabeza, Int. J. Pharm., 2011, 418, 168–178 CrossRef PubMed.
- M. A. Neumann, F. J. J. Leusen and J. Kendrick, Angew. Chem., Int. Ed., 2008, 47, 2427–2430 CrossRef CAS PubMed.
- M. Habgood, I. J. Sugden, A. V Kazantsev, C. S. Adjiman and C. C. Pantelides, J. Chem. Theory Comput., 2015, 11, 1957–1969 CrossRef CAS PubMed.
- Z. Sun, Z. Li, Y. He, R. Shen, L. Deng, M. Yang, Y. Liang and Y. Zhang, J. Am. Chem. Soc., 2013, 135, 13379–13386 CrossRef CAS PubMed.
- N. Š. Vujičić, Z. Glasovac, N. Zweep, J. H. van Esch, M. Vinković, J. Popović and M. Žinić, Chem. – Eur. J., 2013, 19, 8558–8572 CrossRef PubMed.
- M. Tanaka, T. Ikeda, J. Mack, N. Kobayashi and T. Haino, J. Org. Chem., 2011, 76, 5082–5091 CrossRef CAS PubMed.
- Y. S. Velichko, S. I. Stupp and M. O. de la Cruz, J. Phys. Chem. B, 2008, 112, 2326–2334 CrossRef CAS PubMed.
- O.-S. Lee, S. I. Stupp and G. C. Schatz, J. Am. Chem. Soc., 2011, 133, 3677–3683 CrossRef CAS PubMed.
- E. O. Pyzer-Knapp, H. P. G. Thompson, F. Schiffmann, K. E. Jelfs, S. Y. Chong, M. A. Little, A. I. Cooper and G. M. Day, Chem. Sci., 2014, 5, 2235–2245 RSC.
- M. Vasileiadis, C. C. Pantelides and C. S. Adjiman, Chem. Eng. Sci., 2015, 121, 60–76 CrossRef CAS.
- B. Delley, J. Chem. Phys., 2000, 113, 7756 CrossRef CAS.
- G. O. Lloyd, M.-O. M. Piepenbrock, J. A. Foster, N. Clarke and J. W. Steed, Soft Matter, 2012, 8, 204–216 RSC.
- P. J. Bygrave, D. H. Case and G. M. Day, Faraday Discuss., 2014, 170, 41–57 RSC.
- D. H. Case, J. Campbell, P. J. Bygrave and G. M. Day, J. Chem. Theory Comput., 2016, 12, 910–924 CrossRef CAS PubMed.
- S. L. Price, M. Leslie, G. W. A. Welch, M. Habgood, L. S. Price, P. G. Karamertzanis and G. M. Day, Phys. Chem. Chem. Phys., 2010, 12, 8478–8490 RSC.
- H. P. G. Thompson and G. M. Day, Chem. Sci., 2014, 5, 3173 RSC.
- P. J. Bygrave, D. H. Case, T. Gee and G. M. Day, 2015, manuscript in preparation.
- J. Nyman and G. M. Day, CrystEngComm, 2015, 17, 5154–5165 RSC.
- S. S. Babu, V. K. Praveen and A. Ajayaghosh, Chem. Rev., 2014, 114, 1973–2129 CrossRef CAS PubMed.
- S. Iqbal, F. Rodriguez-LLansola, B. Escuder, J. F. Miravet, I. Verbruggen and R. Willem, Soft Matter, 2010, 6, 1875–1878 RSC.
- Y. E. Shapiro, Prog. Polym. Sci., 2011, 36, 1184–1253 CrossRef CAS.
- W. Kolodziejski and J. Klinowski, Chem. Rev., 2002, 102, 613–628 CrossRef CAS PubMed.
- M. Wallace, J. A. Iggo and D. J. Adams, Soft Matter, 2015, 11, 7739–7747 RSC.
- K. M. Steed and J. W. Steed, Chem. Rev., 2015, 115, 2895–2933 CrossRef CAS PubMed.
- C. J. Pickard and F. Mauri, Phys. Rev. B: Condens. Matter Mater. Phys., 2001, 63, 245101 CrossRef.
- M. Baias, C. M. Widdifield, J.-N. Dumez, H. P. G. Thompson, T. G. Cooper, E. Salager, S. Bassil, R. S. Stein, A. Lesage, G. M. Day and L. Emsley, Phys. Chem. Chem. Phys., 2013, 15, 8069 RSC.
Footnotes |
| † Electronic supplementary information (ESI) available: Synthesis of the gelators, results of gelation studies, DSC, rheology, ESEM, CSP and NMR calculations, PXRD and NMR spectroscopy. See DOI: 10.1039/c6sm00607h |
| ‡ These authors contributed equally. |
| This journal is © The Royal Society of Chemistry 2016 |