 Open Access Article
Creative Commons Attribution 3.0 Unported Licence
A model for pattern deposition from an evaporating solution subject to contact angle hysteresis and finite solubility
Anna
Zigelman
and
Ofer
Manor
*
Wolfson Department of Chemical Engineering, Technion-Israel Institute of Technology, Haifa, Israel 32000. E-mail: manoro@tx.technion.ac.il
First published on 30th May 2016
Abstract
We propose a model for the pattern deposition of the solute from an evaporating drop of a dilute solution on a horizontal substrate. In the model we take into account the three-phase contact angle hysteresis and the deposition of the solute whenever its concentration exceeds the solubility limit. The evaporating drop is governed by a film equation. We show that unless for a very small three-phase contact angle or a very rapid evaporation rate the film adopts a quasi-steady geometry, satisfying the Young–Laplace equation to leading order. The concentration profile is assumed to satisfy an advection diffusion equation subject to the standard Fick's law for the diffusive flux. We further use an integral boundary condition to describe the dynamics of the concentration in the vicinity of the three-phase contact line; we replace an exact geometric description of the vicinity of the contact line, which is usually assumed such that mathematical singularities are avoided, with general insights about the concentration and its flux. We use our model to explore the relationships between a variety of deposition patterns and the governing parameters, show that the model repeats previous findings, and suggest further insights.
1 Introduction
The deposition of suspended colloidal particles and solute mass from an evaporating drop or film is a defining mechanism in coating, painting, printing,1–4 production of low resolution electronic devices,5 and in many scientific applications that are associated with the patterning of surfaces.2 In addition, the evaporation of particulate liquids and solutions has been studied for several decades for treating a variety of difficulties in industrial processes and developing new manufacturing procedures. In particular many studies concentrated on generating uniform deposits following the evaporation of the carrier liquid, studying the stick-slip motion of the contact line of particulate liquids, and obtaining deposited patterns made of rings, stripes and other configurations.6–17Deegan et al.,7,18,19 first pointed out that the evaporation of a drop invokes a flow field that transports suspended solid particles to the edge of the drop. Together with the pinning of the three-phase contact line this gives a ring-like deposit formation – the so-called “coffee-ring” effect. The phenomenon was theoretically studied by Popov,8 who proposed a quasi-steady state equation for the shape of the drop using the lubrication approximation, and by Hu and Larson20 who conducted a detailed flow simulation taking into account various mechanisms associated with evaporation, such as the temperature gradient, the vapour pressure distribution, and the Marangoni effect. The preliminary theoretical models given by Popov8 and Hu and Larson20 provide good approximations to the deposition process at an early stage of the evaporation.
An extension to Deegan's model was made by Fischer21 who avoided assuming the shape of the evaporating drop is a spherical cap. Instead, Fischer proposed a dynamic shape with boundary conditions that ensure a pinned contact line. Fischer examined how different non-singular expressions for the evaporative flux affect the profile of the deposits, solving the advection equation for the concentration profile. Fisher concluded that the evaporative flux, assumed constant across the drop or enhanced near the contact line, supports an outward flow in the liquid that causes the “coffee-ring” effect. Otherwise when the evaporative flux primarily occurs at the center of the drop no ring-shaped deposit occurs since the solute or suspended particles are convected towards the center of the drop.
Furthermore, van Dam and Kuerten22 proposed an extension to Fischer's study by calculating the curvature of the drop shape in order to account for large contact angles. They considered a concentration-dependent viscosity of the liquid inside the drop and incorporated the linear Fick's diffusional term into the advection–diffusion equation that governs the concentration profile.
One more extension of Fisher's and van Dam and Kuerten's models was proposed by Siregar et al.,23 taking into account the convection, diffusion, and adsorption of the solute onto the substrate. Siregar et al.23 calculated the dynamic shape of the drop and the evolution of the deposition of the solute for both pinned and unpinned three-phase contact lines. While for a pinned contact line Siregar and coworkers observed a regular “coffee-ring”, thus confirming previous results, for an unpinned contact line, they observed a new, mountain-like, deposit shape. These two different deposition morphologies led Siregar and coworkers to conclude that the contact line condition influences the shape of the solute deposition. To avoid singularity near the contact line they incorporated in their model a microscopic precursor film subject to a conjoining/disjoining pressure of molecular origin, based on the Frumkin–Deryugin model.24 Briefly, a thin precursor film remained behind the contact line, thus helping to avoid singular corner geometry of the drop close to the contact line.
Another extension of Popov's model8 was suggested by Ozawa et al.2 Ozawa and coworkers solved the advection equation, assuming the evaporative flux to be spatially constant and the shape of the drop to be a quasi-steady spherical cap. An extension to Ozawa's model was proposed by Okuzono et al.14 who treated the quasi-steady state drop in the pinned contact line case under the following assumptions: the evaporation rate remains constant in the solution phase which is ‘far’ from the contact line and vanishes in the gel phase, appearing in the proximity of the contact line whenever the concentration exceeds some threshold value. Furthermore, they assumed that the gel phase renders the concentration of the solute particles constant and the radial velocity vanishes.
Another model for an unpinned contact line was treated by Freed-Brown.25 Freed-Brown found the appearance of mountain-like deposits under the assumption of the quasi-steady state free surface of the drop, where most of the deposit appears near the center of the evaporated drop in the absence of repeating patterns. This study confirmed the results of Siregar et al.23
Introducing the stick-slip motion of the contact line, Adachi et al.26 observed the formation of circular stripe patterns, or rings from an evaporating drop. In their model, they introduced a friction force in the vicinity of the contact line due to the flow of particles towards the boundary of the drop, defining an effective mass density at the contact line and employing experimental values for the evaporation rate. They found that the mechanism of stripe formation originated in a competition between the capillary and the friction forces near the contact line.
On a different note, using the lubrication approximation, Warner et al.,6 studied the dewetting dynamics of ultrathin films in the presence of evaporation. They derived and solved two coupled evolution equations for the geometry of an evaporating film and for the corresponding concentration profile where the viscosity depends on local particle concentration. Their results indicate that starting from a uniform solute concentration the solute particles are aligned to distinct deposits, where the spacing between the deposits depends on the parameters of the evaporating system.
Avoiding empirical conditions on the contact line and the contact angle, Thiele et al.9,10,27 have derived and solved two coupled evolution equations for the geometry of an evaporating film and for the corresponding concentration profile, assuming the presence of a disjoining/conjoining pressure of molecular origin and a precursor film. Thiele and coworkers employed the standard Fick's law, where the diffusion is dependent on the excess Gibbs free energy of the mixed phases in the evaporating film, and a power relationship between the viscosity and the concentration. They showed that each of the non-linear contributions to diffusion and viscosity is independently sufficient to supporting pattern deposition.
An additional model for the stick-slip motion of the contact line in the case of a moving substrate was suggested by Doumenc et al.28,29 Doumenc and coworkers solved two coupled evolution equations for the geometry of an evaporating film above a moving substrate and for the corresponding concentration profile. The viscosity was assumed to exhibit a strong relationship with the volume fraction of the solute and was prescribed as an empirical function of solute concentration. They assumed that outside the meniscus the system is frozen due to the very high viscosity of the solution, which is analogous to the assumption of the precursor film. Doumenc and coworkers obtained periodic patterns whose amplitude was found to depend on the velocity of the moving substrate. Furthermore, Doumenc et al.30,31 have found an empirical law that relates the pinning force and the deposits' geometry (in the case of a moving substrate), and concluded that this force controls the wavelength of the periodic patterns.
A piece-wise model that accounted for the stick-slip motion of the contact line was proposed by Kaya et al.32 Kaya and coworkers solved the advection–diffusion equation, where avoiding singularity the dynamic assessment of the concentration was performed in the immediate vicinity of the contact line. The shape of the drop was assumed to be a spherical cap and the contact line was assumed to unpin when the maximal concentration of the suspended particles exceeds an empirical threshold value. Contact line pinning was assumed to occur at an empirical equi-spaced distance between the concentric rings.
Furthermore, studying the stick-slip motion of the meniscus in the case of a Petri dish geometry, Chen et al.33 proposed a piece-wise model that takes into account the antagonistic balance between the pinning and de-pinning mechanisms, assuming a constant evaporation rate. Chen and coworkers related pinning/de-pinning mechanisms, the receding contact angle, and the roughness of the substrate, where they based their analysis on the relationship between the receding contact angle and the roughness of the solid substrate obtained by de Gennes.34 The simulations of Chen and coworkers have qualitatively yielded a quasi-logarithmic spatial relation between the deposits.
In this paper, we present a piece-wise model, reminiscent of the models by Kaya et al.32 and Chen et al.,33 for the pattern deposition of the solute mass from an evaporating drop whose contact line undergoes a stick-slip motion as a function of the receding contact angle threshold on the bare substrate and on the deposit. We assume a diffusion limited evaporation7,8,18,19 and further incorporate the standard Fick's diffusion law27 in the advection–diffusion equation for the diffusive flux in the solution. Moreover, we incorporate in our model the solubility limit of the solution. The solubility limit determines the rate of solute deposition to occur when the concentration exceeds the solubility limit, and the flux of concentration in the liquid, associated with dissolved solute mass. We treat the vicinity of the contact line using an integral boundary condition to account for the local dynamics of the concentration.
We use our model to study the pattern deposition for pinned and un-pinned contact lines and for an interchanging stick-slip motion of the contact line. We characterise the patterns by performing a parametric study, confirming previous experimental results7,16,18,19,33,35 and giving further insights. In the following we derive our model in Section 2, discuss the method of solution in Section 3, summarize our findings in Section 4, and conclude in Section 5.
2 Model
In this section we derive a model for the pattern deposition of solute mass from an evaporating drop of a dilute solution. We assume that the spatiotemporal dynamics of the drop's shape and that of the concentration may be described using the principles of lubrication theory. We ignore gravitational contributions and assume that the density ρ, the viscosity μ, and the surface tension γ of the drop are constant to leading order.The analysis of the corresponding dynamic film equation, which we present in Appendix A1, suggests that the ratio of the capillary velocity to the rate of evaporation, given by ![[scr A, script letter A]](https://www.rsc.org/images/entities/char_e520.gif) ≡ γθ04/μJ0, determines the spatiotemporal geometry of the drop, where θ0 is the receding contact angle of the solution with the substrate and J0 is the characteristic rate of evaporation per unit area. We take the characteristic rate of evaporation to be J0 = Dvcv(1 − H)/R0ρ, assuming that the rate of evaporation of the drop is limited by the rate of diffusion of the vapour in the air above the drop;8,19,20,23,32 the rate of diffusion is determined by the vapour coefficient of diffusion in air Dv, the saturated vapour concentration cv, the ambient vapour concentration H, and the initial radius of the drop R0. The non-dimensional parameter
≡ γθ04/μJ0, determines the spatiotemporal geometry of the drop, where θ0 is the receding contact angle of the solution with the substrate and J0 is the characteristic rate of evaporation per unit area. We take the characteristic rate of evaporation to be J0 = Dvcv(1 − H)/R0ρ, assuming that the rate of evaporation of the drop is limited by the rate of diffusion of the vapour in the air above the drop;8,19,20,23,32 the rate of diffusion is determined by the vapour coefficient of diffusion in air Dv, the saturated vapour concentration cv, the ambient vapour concentration H, and the initial radius of the drop R0. The non-dimensional parameter ![[scr A, script letter A]](https://www.rsc.org/images/entities/char_e520.gif) is usually large, unless for a very small contact angle or a very large rate of evaporation. For example, an evaporating drop of water under ambient conditions gives
is usually large, unless for a very small contact angle or a very large rate of evaporation. For example, an evaporating drop of water under ambient conditions gives ![[scr A, script letter A]](https://www.rsc.org/images/entities/char_e520.gif) ≈ 105–106. Thus, to leading order the shape of the drop is governed by capillary stress. The drop then takes a quasi-steady hemispherical shape, changing in time due to evaporation. An alternative justification for the hemispherical equilibrium drop's shape was derived by Popov et al.36
≈ 105–106. Thus, to leading order the shape of the drop is governed by capillary stress. The drop then takes a quasi-steady hemispherical shape, changing in time due to evaporation. An alternative justification for the hemispherical equilibrium drop's shape was derived by Popov et al.36
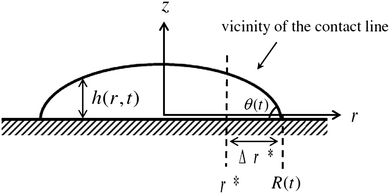
We assume a radial symmetry for the sessile drop and use the cylindrical coordinates (r,z). We denote the time-dependent drop's projection radius on the flat substrate by R(t), where t is time. Furthermore, the free surface of the drop satisfies the three phase contact angle θ(t) with the substrate, see Fig. 1. For simplicity, throughout this work, we shall use the following notation for the partial derivatives: ∂r ≡ ∂/∂r, ∂t ≡ ∂/∂t, etc. We start our discussion by considering two limiting cases of the stick-slip motion of the contact line, the pinned and the unpinned contact lines, which were widely considered in the literature.2,7,8,23,25 Assuming large ![[scr A, script letter A]](https://www.rsc.org/images/entities/char_e520.gif) , the thickness of the drop h(r,t) in these two limiting cases satisfies to leading order the following equations and boundary conditions:
, the thickness of the drop h(r,t) in these two limiting cases satisfies to leading order the following equations and boundary conditions:
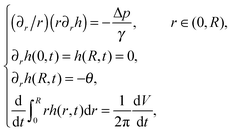 | (1) |
The solution to the problem in (1) provides us with the shape of the free surface of the drop. The same problem as the problem stated in (1) was solved by Popov,8 with R(t) and θ(t) both depending on time simultaneously. Hence, Popov needed to make an additional assumption with regard to the vicinity of the contact line that related between R(t) and θ(t). Furthermore, a similar problem for h(r,t) was solved by Ozawa et al.,2 in the pinned contact line case, under an additional assumption that the evaporative rate is constant, independent of time.
Introducing the equation for mass conservation in the drop2,8,32 ∂th = −(∂r/r)(rhū) − J(r)/ρ, we further extract the average of the radial velocity  , where, u(r,z,t) is the corresponding velocity along the same direction and J(r) is the local evaporative flux. Integrating from the axisymmetric center of the drop and rearranging the equation gives
 | (2) |
Furthermore, Deegan et al.7,18 highlighted the analogy between the fields of vapour concentration and electrostatic potential for estimating the rate of evaporation. Analytical solutions to the electrostatic potential field are given by Lebedev37 for various geometries. The local rate of evaporation calculated from a vapour concentration field, corresponding to an evaporating hemispherical drop of a small contact angle, is8,19,20,23,32
 | (3) |
 | (4) |
 is the time-dependent volume of the drop.
The local average concentration in the drop in terms of density  is governed by the film concentration equation,32 where the diffusive flux is governed by the standard Fick's law,27 such that
 | (5) |
![[scr D, script letter D]](https://www.rsc.org/images/entities/char_e523.gif) , and fB(ϕ/ρ) ≈ (ϕ/ρ)ln(ϕ/ρ) + (1 − ϕ/ρ)ln(1 − ϕ/ρ) are the local concentration of the solute in terms of density, diffusion coefficient, and the excess Gibbs free energy per unit volume for a dilute mixture (divided by ρ
, and fB(ϕ/ρ) ≈ (ϕ/ρ)ln(ϕ/ρ) + (1 − ϕ/ρ)ln(1 − ϕ/ρ) are the local concentration of the solute in terms of density, diffusion coefficient, and the excess Gibbs free energy per unit volume for a dilute mixture (divided by ρ![[scr R, script letter R]](https://www.rsc.org/images/entities/char_e531.gif)
![[scr T, script letter T]](https://www.rsc.org/images/entities/char_e533.gif) ), respectively, where
), respectively, where ![[scr R, script letter R]](https://www.rsc.org/images/entities/char_e531.gif) is the ideal gas constant,
is the ideal gas constant, ![[scr T, script letter T]](https://www.rsc.org/images/entities/char_e533.gif) is the absolute temperature; and fB′ is the complete derivative of fB. For a detailed derivation of (5), see Appendix A2.
is the absolute temperature; and fB′ is the complete derivative of fB. For a detailed derivation of (5), see Appendix A2.
To render the equations non-dimensional, we use the transformations r → R0r, h → R0θ0h, θ → θ0θ, t → (R0θ0/J0)t, ϕ → ρϕ, J → J0J, and ū → (J0/θ0)ū, where R0 is the initial radius of the drop.
The dimensionless form of the advection–diffusion equation in (5) is given by
 | (6) |
![[scr D, script letter D]](https://www.rsc.org/images/entities/char_e523.gif) θ0/J0R0.
θ0/J0R0.
In order to solve the equation we prescribe the homogeneous initial concentration ϕ(t = 0) = ϕinit, the symmetry condition ∂rϕ|r=0 = 0 at the center of the drop and an integral boundary condition for the concentration in the vicinity of the contact line near r = R. We derive the integral boundary condition in the next subsection.
2.1 Integral boundary condition
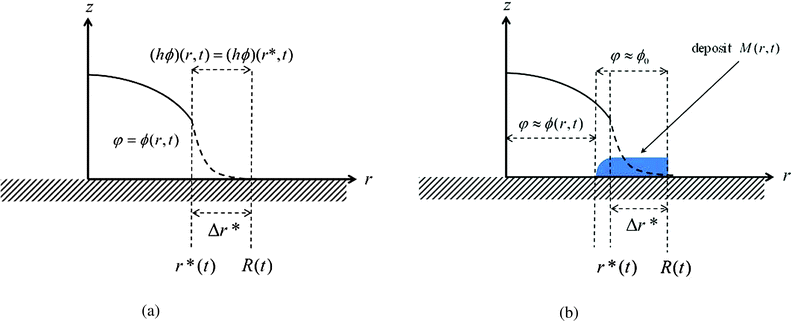
The singular corner geometry of the drop close to the contact line gives rise to a diverging evaporative flux and a diverging velocity field.7,8,19,20 Different approaches for eliminating the singularity in eqn (6) in the proximity of the contact line were discussed in the literature.38 The most common methods are: smoothing the evaporative flux singularity mathematically,21 finding analytical solutions under simplifying assumptions,2,14,25 cutting the proximity of the contact line,8,32 and adding a thin precursor film which regularises the singular wedge geometry near the contact line.9,23,39Since the mathematical singularity of the concentration, appearing near the vanishing thickness of the drop at the quasi-static contact line, is integrable we propose to treat the advection–diffusion equation in the vicinity of the contact line using an integral approach. We integrate the advection–diffusion equation in (6) from r = r* to R, where Δr*/R ≪ 1 (Δr* ≡ R − r*), subject to the physical insight that the flux of concentration cannot leave the liquid and thus the drop. Only the deposited solute that left the liquid phase may leave the drop under the contact line; this is discussed in the following subsection. In order to attain an analytical solution for the concentration at r*, we further assume that changes in the mass of solute within the region r ∈ (r*,R) are small such that the integral quantity of hϕ is in a quasi-steady state in this region with respect to the rest of the drop. The meaning of the last assumption is visualized in Fig. 2. The advantage of this method is that we use general insights about the concentration and its flux near the contact line rather than specific assumptions about the shape of the drop in the vicinity of the contact line. Furthermore, the results of the model appear to be not very sensitive to the magnitude of Δr* as long as 0 < Δr*/R ≪ 1. The corresponding sensitivity analysis is given in Appendix A7.
The integral boundary condition gives the rate of change of the solute mass in time at r*:
 | (7) |
2.2 Contact angle hysteresis and solubility limit
In our model we take into account two physical parameters that further affect the pattern deposition of the solute: the receding contact angle over the deposit θr, which differs from the receding contact angle of the drop over the bare substrate, prior to the deposition of solute particles,16θ0, and the solubility limit ϕ0 of the solution. First, we discuss the receding contact angle θr and the mechanisms which govern the contact angle hysteresis. Then we discuss a method which allows incorporating the solubility limit in the advection–diffusion equation, so that the resulting equation constitutes a regular PDE for ϕ.Pattern deposition of a solute mass from an evaporating solution may invoke two different types of contact angle hysteresis mechanisms. The first is the contact angle hysteresis over the bare substrate. The second is the contact angle hysteresis over a deposited layer of solute mass. In this model we account for the two corresponding receding contact angles. One can assume that the initial contact angle of the evaporating drop, prior to the deposition of solute mass, is equal to, or greater than, the receding contact angle on the bare substrate θ0. Motion of the contact line occurs only when the contact angle is smaller than this threshold, i.e., θ < θ0. Furthermore, once the deposition of the solute occurred in the vicinity of the contact line the chemistry of the surface at this position changes and thus the value of the receding contact angle changes to θr.
The necessity of θr in the model and the assumption that θr ≤ θ0 may be explained as follows: if there was no θr, which reflects the receding contact angle over the deposited material, or if we had assumed that θr > θ0, then we would get that θ(t) < θ0 or θ(t) < θr, respectively, for all t > ![[t with combining tilde]](https://www.rsc.org/images/entities/i_char_0074_0303.gif) , where
, where ![[t with combining tilde]](https://www.rsc.org/images/entities/i_char_0074_0303.gif) denotes the first time for which depinning has occurred over the area of the substrate covered by deposited solute particles. So in these two cases, nothing could stop the motion of the contact line and thus no more pinned contact line stage could be achieved, meaning that no periodic patterns can be expected.
denotes the first time for which depinning has occurred over the area of the substrate covered by deposited solute particles. So in these two cases, nothing could stop the motion of the contact line and thus no more pinned contact line stage could be achieved, meaning that no periodic patterns can be expected.
To be consistent with our previous discussion, the scaled receding contact angle over the deposit is given by the transformation θr → θ0θr. We further assume that in a scaled notation 0 ≤ θr ≤ 1, which also corresponds to a suggestion made by Bhardwaj et al.,16 based on experimental evidence. The two limiting cases θr = 0 and θr = 1 correspond to a pinned (once deposition occurred) and an unpinned contact line, respectively, (our calculations commence assuming that the contact angle is at its receding threshold on the bare substrate, θ(t = 0) = 1). The underlying assumption of our model is that the contact line of the drop is pinned unless the dynamic contact angle is less than the corresponding receding contact angle on the bare substrate or less than the corresponding receding contact angle on the deposited material; in which case de-pinning occurs. The details of the implementation of this approach in the numerical model are given in Section 3.
We now incorporate the solubility limit of the solution in our model. The solubility limit is a thermodynamic property of the solution, where solute particles leave the solution and deposit as an independent phase whenever the concentration ϕ(r,t) exceeds this limit. The deposited particles do not participate in the concentration (solute mass) flux in the advection–diffusion equation. Note that our notion of the solubility limit is roughly analogous to the “gelation concentration” used in the model of Okuzono et al.,14 in the sense that as far as the concentration exceeds some threshold in some region (in the vicinity of the contact line), it becomes constant (equal to that threshold) in that region.
Incorporating the solubility limit implies that the flux in eqn (6) is determined by the component of the solute that is soluble, given by the concentration φ(r,t). The actual concentration φ(r,t) is limited by the solubility limit ϕ0. The following modified advection–diffusion equation takes into account the total solute mass (on the left hand side of the equation), but only the mass of the soluble component of the solute when considering the convective and diffusive fluxes of the solute mass (on the right hand side):
 | (8) |
Modifying the boundary condition in (7) to incorporate the solubility limit (since it is derived from the advection–diffusion equation) gives
 | (9) |
The solubility limit further determines the solute mass per unit area, M(r,t), which was deposited until time t behind the contact line, and is defined as
| M(r,t) ≡ h(r,t*)max{ϕ(r,t*) − ϕ0,0}, for r ≥ R(t), | (10) |
3 Numerical procedure
In a similar manner to Ozawa et al.,2 and Schwartz and Eley,24 we have used the alternating-direction-implicit technique (ADI) to step forward in time,40 where the nonlinear prefactors in the equation are approximated at the previous time level.The simulations subject to contact angle hysteresis are performed as follows: we assume that the initial contact angle is the receding contact angle on the bare substrate, where θ(t = 0) = 1. We evaluate the initial shape of the drop, h(r,t), assuming that the contact line is pinned. See Appendix A3 for further details. At each time step we solve the equation for ϕ(r,t) as prescribed in (8). Since θ(t) decreases with time and max{0<r<R}ϕ(r,t) increases with time, the simulated drop reaches a time, which we denote by tn ≡ n·Δt, where n ∈ ![[Doublestruck N]](https://www.rsc.org/images/entities/char_e171.gif) and Δt are the time-step size, for which exactly one of the conditions below is satisfied:
and Δt are the time-step size, for which exactly one of the conditions below is satisfied:
 | (11a) |
 | (11b) |
Let us denote by tn and Rn the last time level before the de-pinning and the corresponding position of the contact line, and by Rn+1 the new pinned position at time tn+1 after the de-pinning has occurred. Accordingly, we denote by θn and θn+1 the contact angles at the pinned positions Rn and Rn+1, respectively. In a similar manner to Chen et al.,33 we employ the assumption that θn+1 is equal to the receding contact angle on a bare substrate, that is θn+1 = 1. Using the last constraint which was prescribed in problem (1) for the two corresponding drops' shapes (before and after the de-pinning), where the corresponding volume loss in each case is calculated according to (4), we get the following cubic equation for Rn+1:
 | (12) |
We may summarize our numerical procedure as follows: the number of steps in time of the algorithm is given by n. We start with an initial condition, where n = 0, Rn=0 = 1, and θn=0 = 1.
(1) For n ≥ 1, we calculate θn ≡ θ(nΔt) and the corresponding parabolic free surface shape hn ≡ h(r,tn) for the prescribed value Rn ≡ R(nΔt) = Rn−1, assuming a pinned contact line and using eqn (34) and (35) in Appendix A3.
(2) We calculate ūn using the formula in (2) and ϕn+1 using eqn (8), where ϕ0 = ϕinit. We employ the no flux boundary condition for ϕ at r = 0, and the integral boundary condition (9) at r = r*.
(3) We check if any of the conditions (11a) or (11b) is satisfied. If yes, we proceed according to step (4). Otherwise we adjust n forward by 1 and move back to step (1).
(4) Depinning should occur. We set θn+1 = 1, and calculate the next pinned contact line position Rn+1 using eqn (12). Eqn (34) gives hn+1. Next, we adjust n forward by 1 and move to step (2) with the new θn, Rn, and hn values.
We denote by t = T the end time of the simulation, where the solution has almost fully evaporated such that the drop vanishes and our solution for its leading order geometry becomes singular. Furthermore, we use the following discrete form to calculate the deposited mass M(r,T) defined in (10),
 | (13) |
4 Results
In this section we present our results obtained for various choices of the parameter values for the scaled diffusion coefficient D, the ratio of the receding contact angle on the deposit to the bare substrate θr, and the ratio of the solubility limit to the initial concentration β ≡ ϕ0/ϕ(t = 0). First we give representative deposition patterns. Then we employ general characterisation methods in order to compare different pattern depositions that we obtain in our parametric study.In Fig. 3 we present the profile of the deposited solute mass per unit area on the substrate M(r,t = T) following the full evaporation of the drop. In the figure we observe the generation of detached patterns far from the center of the drop. The patterns merge into a corrugated solid film near the center. The change in the deposition state is due to the increase in concentration and capillary stress as the drop evaporates and shrinks in volume. This spatial change in the state of pattern deposition is commonly observed in experiment.13,26,35,41 Furthermore, a non-monotonic behavior of the rings' heights has been previously observed in experiment as well.16
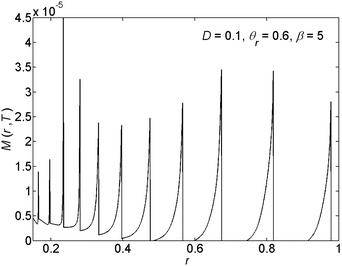 | ||
| Fig. 3 An example of the radial (r) variations of the deposited solute mass per unit area of the substrate M(r,T). | ||
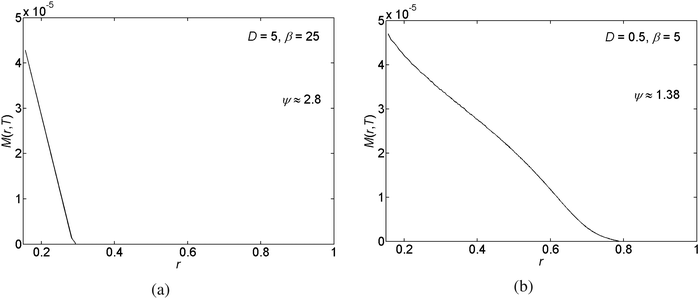
In the pinned contact line case (which is obtained for θr = 0) we get a “coffee-ring”,7,18,19 which forms due to the evaporative flux invoking a flow field and thus transporting the suspended solid particles to the edge of the drop. See Fig. 4 for example. Furthermore, confirming previous findings,23,25 in the unpinned contact line case (which is obtained for θr = 1), we observe a mountain-like deposit shape. See Fig. 5 for example. Here solute particles which are accumulated in the proximity of the contact line are gliding together with the contact line towards the center of the drop.
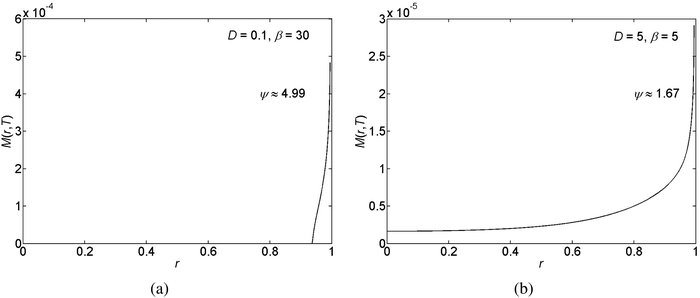 | ||
| Fig. 4 Examples for the deposited solute mass, M(r,T), subject to pinned contact lines for different relative roughness, ψ, levels. | ||
Next we compare between the geometries of the different pattern depositions of the solute mass M that appear under different physical and initial conditions using their relative roughness, ψ, the individual distances between rings λn, and the ratio of the area on which pattern deposition occurred to the initial area of the drop on the substrate P.
We measure the roughness of mass, deposited over the substrate, using the notion of ‘RMS’, i.e., the root mean square operator,42–44 which is one of the most common methods to define roughness. We thus employ the ‘RMS’ operator on the topography of the deposit. It represents the standard deviation of the variation in the mass deposited over the substrate. Furthermore, in our study, we wish to compare one deposition system to another, which may differ by the overall solute mass, using the relative roughness ψ of the deposited mass M(r,T), which is given by dividing the ‘RMS’ measure for the roughness by the spatial average of the deposited mass. The solution of the governing equations gives the 3D topography of the deposit in the form of a vector. Assuming K numerical grid points, the vector is: (2πr1Δr1m1, 2πr2Δr2m2,…,2πrKΔrKmK), in which rk is the distance between the grid point k and the origin, Δrk is the distance between the grid points k and k − 1, and mk is the thickness of the deposit near the grid point k. We then divide the result by the arithmetic mean of the film thickness  . In summary, we define the roughness using
 | (14) |
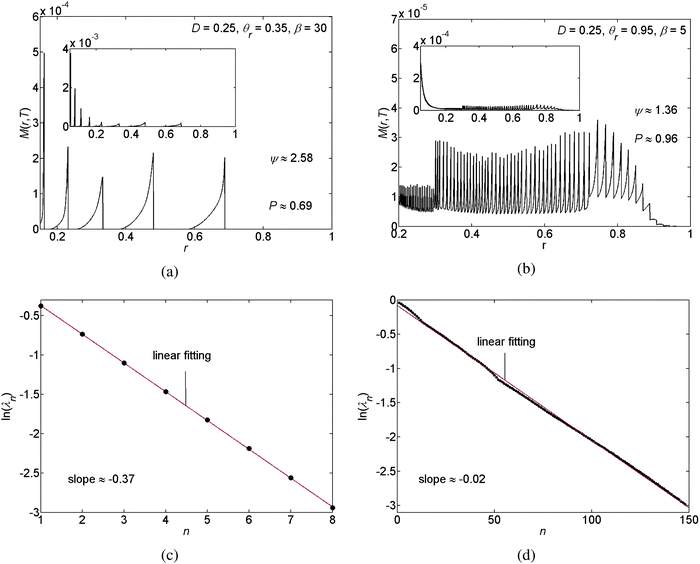
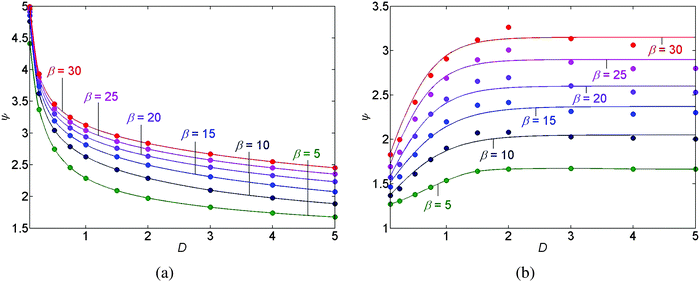
We visualise the meaning of the relative roughness for pinned and unpinned contact lines and for the stick-slip motion of the contact line in Fig. 4, 5, and 6(a and b), respectively. In the pinned and unpinned contact lines the relative roughness reflects the thickness of one deposited ring (in either the edge of the drop or near the drop's center, respectively), relative to the thickness of a smoothly deposited layer of the same mass, where higher values of ψ correspond to a higher relative thickness of the deposited ring. In a similar manner, under a stick-slip motion of the contact line, the relative roughness reflects the average thickness of the deposited rings relative to the thickness of a smoothly deposited layer of the same mass, with higher ψ values corresponding to thicker deposited rings.
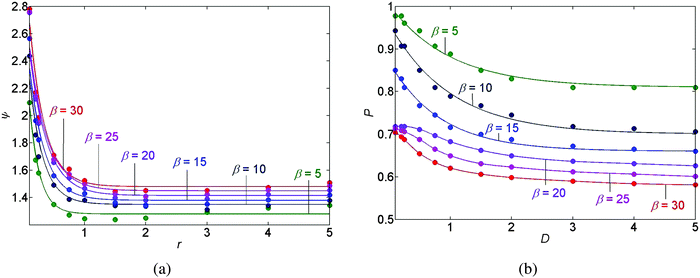
Furthermore, for the case of a stick-slip motion of the contact line we calculate the individual distances between the N deposited rings. The distance between ring numbers n and n + 1, counted from the outermost ring, is given by λn ≡ rmaxn − rmaxn+1, such that n = 1, 2, …, N − 1; the coordinate rmaxn denotes the r-coordinate of the n local maximum value of the deposit mass M(r,T) (the maximum of ring number n). In the results we observe a logarithmic decline in the individual distances between rings λnversus the ring number n counted from the outermost ring. See Fig. 6(c and d) for example. This is the consequence of the radial geometry of this problem. This result agrees with the findings reported by Chen et al.33 Note that the slope of the natural logarithm, ln(λn) versus n, depends on the choice of the parametric values for D, θr, and β. Moreover, in Fig. 6 and 9(b) we demonstrate that the slope of the natural logarithm of the distance between the deposits, ln(λn), versus n reflects the spatial density of the deposits and that the denser the deposited rings are, the larger the slope of ln(λn) versus n becomes. In addition, P denotes the area on which the pattern deposition is apparent with respect to the initial area of the interface between the drop and the substrate. This quantity gives the scaled position of the outermost deposit (with respect to the center of the drop) and is illustrated in Fig. 6(a and b).
We have performed a parametric study in three cases, stick-slip motion of the contact line, pinned and unpinned contact lines, see Fig. 7–9. In all cases, the ranges for D, θr, and β were chosen such that we were able to ensure the convergence of the numerical scheme. For an example of the numerical sensitivity analysis, see Appendix A7. In Fig. 7(a and b) and 8(a), we present a graph of the roughness versus the scaled diffusion coefficient D for pinned and unpinned contact lines and for the stick-slip motion of the contact line, respectively. The various trend-lines correspond to different values of β. For a pinned contact line we observed the same monotone decreasing trend in the roughness versus D as for the stick-slip motion of the contact line. See Fig. 7(a) and 8(a) for example. However, for an unpinned contact line we obtained an opposite trend. That is, the roughness increases with D, where for high β levels the roughness appears to slightly decrease following a maximum value. See for example Fig. 7(b).
This difference in the trends of roughness versus D may be explained as follows: for the stick-slip motion and the pinned contact line, the contribution of the diffusion opposes the convective flux near the contact line. The convective flux tends to bring the solute particles towards the contact line while the diffusion decreases gradients in the concentration. Thus, decreasing the contribution of the diffusive flux by decreasing D supports higher ‘peaks’ of concentration near the contact line, which translates into a larger roughness of the deposit.
However, for the unpinned contact line the dynamics is different. While the flow in the drop convects solute particles towards the contact line, the contact line moves towards the center of the drop, such that the convective flux vanishes under ideal conditions when considering a laboratory frame of view. The concentration of the solution accumulates now due to the evaporation of the drop. The accumulation of the concentration is most pronounced near the moving contact line and as before it is dispersed towards the center of the drop by the diffusive mechanism. Decreasing D, we get a “smaller push” of the concentration towards the center of the drop, which results in a lower concentration peak in the center of the drop and more solute mass being deposited behind the moving contact line. This translates into a lower roughness of the deposit with decreasing D. Furthermore, as shown in Fig. 7(a and b) and 8(a), the roughness is a monotone increasing function of β in all cases.
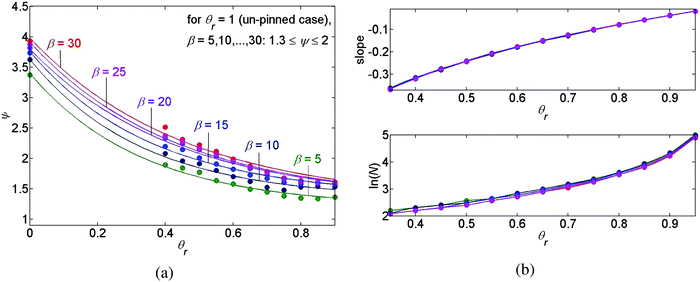
The graph of the roughness versus the receding contact angle θr of the deposit is presented in Fig. 9(a), where again the various trend-lines correspond to different values of β and, following our previous discussion, the receding contact angles θr = 0 and θr = 1 correspond to the pinned and the unpinned contact lines, respectively. We may conclude that the roughness is a monotone decreasing function of θr and again it is a monotone increasing function of β in all three cases, as previously.
The graph of the position P of the outermost deposit versus scaled diffusion coefficient D is shown in Fig. 8(b), where the trend-lines represent again different values of β. Fig. 8(b) predicts that increasing either D, or β, we obtain that the position P of the outermost deposited peak is closer to the center of the drop, giving a smaller deposited area.
Lastly, the upper panel of Fig. 9(b) presents the slope of ln(λn) as a function of n versus the receding contact angle θr of the deposit and the lower panel of Fig. 9(b) presents the natural logarithm of the number of deposited rings versus θr. From these two panels we may conclude that the slope and the density of the deposited rings, which are shown to be equivalent, are mainly affected by the receding contact angle of the deposit. Increasing the receding contact angle of the deposit, we observe more peaks in our pattern, which become denser where the slope of ln(λn) increases as well. According to Fig. 9(b) it appears that the density of the deposits is approximately independent of β, since the various trend-lines approximately coincide in both panels.
5 Conclusions
In this study, we have proposed a model for pattern deposition from an evaporating solution subject to the stick-slip motion of the contact line and subject to the two limiting conditions of the stick-slip motion, given by the pinned and the unpinned contact lines. We assume that solute particles are deposited whenever the concentration exceeds the solubility limit and we propose to treat the mathematical singularity of the concentration and the volume flux near the quasi-static contact line using an integral boundary condition. We obtain qualitative agreement between the geometry of the deposited mass obtained in previous experimental and theoretical studies2,16,18,19,33,35 and our results for pinned and unpinned contact lines and for the stick-slip motion of the contact line.In the case of the stick-slip motion of the contact line our model predicts the deposition of concentric rings. The lengths of the spacings between the rings decrease towards the center of the evaporating drop in a logarithmic manner. To further characterise the obtained patterns we extracted the roughness of the deposits (giving a measure of the geometrical deviation of the deposits from a corresponding smooth layer of deposit of the same mass), the variations of the spacings between consecutive rings (giving a measure of the spatial density of the deposited rings), and the position of the outermost deposited ring with respect to the initial radius of the sessile drop (giving a measure of the effective area for deposition), from our numerical data.
Following a parametric study we observe that for the case of a stick-slip motion of the contact line, roughness is a monotone decreasing function of the scaled diffusion coefficient D and of the ratio between the receding contact angle on the deposit and the bare substrate θr. Furthermore, the roughness is a monotone increasing function of the ratio between the solubility limit and the initial concentration β.
For the pinned contact line we observe the same trends of roughness versus D and versus β as in the case of the stick-slip motion. For the unpinned contact line, we observe a monotone increase in the roughness versus β, however we obtain an opposite trend of roughness versus D. Namely, for the unpinned contact line the roughness is a monotone increasing function of D for small values of β, whereas for high β levels the roughness appears to slightly decrease following a maximum value.
The position of the outermost solute deposition with respect to the center of the drop, which reflects the overall deposited area, is dictated by the diffusion coefficient D and the ratio β. Increasing either D, or β, we obtain that the outermost deposited peak is closer to the center of the drop, giving a smaller deposited area.
The deposition-density of the rings, which was shown to be equivalent to the slope of natural logarithm of the individual distances (between the deposited rings) ln(λn) versus the number of the individual deposited ring, commencing from the most outer ring, n is mainly affected by the ratio of the receding contact angle on the deposit to the bare substrate θr. Increasing θr we observe more peaks of deposited solute in our pattern, which become denser. Furthermore, the density of the deposits is approximately independent of β.
Appendix
A1 Analysis of the shape of the drop
In the axisymmetric case, the shape of the drop h(r,t) is determined by conservation of mass, which incorporates changes of shape due to the flow inside the drop and due to evaporation,22,23,27,36| ∂th = −(γ/3μr)∂r(rh3∂r(∂r/r)(r∂rh)) + J(r), | (15) |
The transformations r → R0r, h → R0θ0h, θ → θ0θ,  , and J → J0J, where we assume the temporal change in film thickness is related to the rate of evaporation, render the equation non-dimensional and give
∂th = −(![[scr A, script letter A]](https://www.rsc.org/images/entities/char_e520.gif) /3r)∂r(rh3∂r(∂r/r)(r∂rh)) + J(r), /3r)∂r(rh3∂r(∂r/r)(r∂rh)) + J(r), | (16) |
The shape of the drop is then governed by the ratio of the capillary velocity to the rate of evaporation ![[scr A, script letter A]](https://www.rsc.org/images/entities/char_e520.gif) ≡ γθ04/μJ0. We assume that the rate of evaporation of the solvent is limited by the diffusive flux of the vapour in ambient air and employ the characteristic magnitude for a diffusion limited evaporation in (3), where J0 ≡ Dvcv(1 − H)/R0ρ. Hence, the characteristic magnitude of
≡ γθ04/μJ0. We assume that the rate of evaporation of the solvent is limited by the diffusive flux of the vapour in ambient air and employ the characteristic magnitude for a diffusion limited evaporation in (3), where J0 ≡ Dvcv(1 − H)/R0ρ. Hence, the characteristic magnitude of ![[scr A, script letter A]](https://www.rsc.org/images/entities/char_e520.gif) for a drop of water, evaporating under ambient conditions, is
for a drop of water, evaporating under ambient conditions, is ![[scr A, script letter A]](https://www.rsc.org/images/entities/char_e520.gif) ≈ 105–106. Rearranging (16) in the form of ∂r(rh3∂r(∂r/r)(r∂rh)) = (3r/
≈ 105–106. Rearranging (16) in the form of ∂r(rh3∂r(∂r/r)(r∂rh)) = (3r/![[scr A, script letter A]](https://www.rsc.org/images/entities/char_e520.gif) )(J(r) − ∂th) suggests that to
)(J(r) − ∂th) suggests that to ![[scr O, script letter O]](https://www.rsc.org/images/entities/char_e52e.gif) (
(![[scr A, script letter A]](https://www.rsc.org/images/entities/char_e520.gif) −1) the geometry of the film h(r,t) is quasi-static and satisfies ∂r(rh3∂r(∂r/r)(r∂rh)) = 0, excluding the vicinity of the three phase contact line where the rate of evaporation becomes large. Integrating this equation twice and requiring that h(r,t) is not singular gives the Young–Laplace equation in Appendix A3.
−1) the geometry of the film h(r,t) is quasi-static and satisfies ∂r(rh3∂r(∂r/r)(r∂rh)) = 0, excluding the vicinity of the three phase contact line where the rate of evaporation becomes large. Integrating this equation twice and requiring that h(r,t) is not singular gives the Young–Laplace equation in Appendix A3.
A2 The advection–diffusion equation
Let us denote the fluid–air interface by h(x,y,t) over a rectangular domain (x,y) ∈ (0,L)2, where t ∈ (0,T) denotes time. We start from the basic equation for motion in 3D:| ∂tc + ∇·(uc) = −∇·J, (x,y,z) ∈ (0,L)2 × (0,h(x,y,t)), | (17a) |
| ∂nc(x,y,z)|z=0 = ∂nc(x,y,z)|z=h(x,y) = 0, | (17b) |
 , where
 ![[scr D, script letter D]](https://www.rsc.org/images/entities/char_e523.gif) is the diffusion coefficient,
is the diffusion coefficient, ![[scr R, script letter R]](https://www.rsc.org/images/entities/char_e531.gif) is the universal gas constant,
is the universal gas constant, ![[scr T, script letter T]](https://www.rsc.org/images/entities/char_e533.gif) is the absolute temperature, and the chemical potential for one component in a solution is given by μ ≡ μ0 +
is the absolute temperature, and the chemical potential for one component in a solution is given by μ ≡ μ0 + ![[scr R, script letter R]](https://www.rsc.org/images/entities/char_e531.gif)
![[scr T, script letter T]](https://www.rsc.org/images/entities/char_e533.gif)
![[thin space (1/6-em)]](https://www.rsc.org/images/entities/char_2009.gif) ln(c/ρ), where ρ is the density of the solution as defined previously, then eqn (17a) may be expressed as,
ln(c/ρ), where ρ is the density of the solution as defined previously, then eqn (17a) may be expressed as,∂tc + ∇·(uc) = ![[scr D, script letter D]](https://www.rsc.org/images/entities/char_e523.gif) Δc, Δc, | (18) |
To render the equation non-dimensional, we use the transformations x → l0x, y → l0y, z → l0θ0z, h → l0θ0h, t → t0t, u → (l0/t0)u, v → (l0/t0)v, w → (l0θ0/t0)w, and c → ρc, where l0 is the initial length of the rectangular domain, 0 < θ0 ≪ 1 is the receding contact angle of the bare substrate, and t0 is the characteristic time scale.
Substituting the above transformations into (18) and multiplying the obtained equation by t0, we get that
 | (19) |
Now, since 0 < θ0 ≪ 1, assuming the expansion
| c(x,y,z,t) = c0(x,y,z,t) + θ02c1(x,y,z,t) + O(θ04), | (20) |
| ∂z2c0(x,y,z,t) = 0. | (21) |
Considering the boundary conditions which were prescribed in (17b), along the boundary z = 0, we get that
| ∂zc0(x,y,0,t) = 0. | (22) |
 . Hence, we have that
Thus, in our dimensionless variables we get that
| θ02(∂xh,∂yh,−1/θ02)·(∂xc,∂yc,∂zc) = 0, at z = h(x,y,t). | (23) |
| ∂zc0(x,y,h(x,y,t),t) = 0. | (24) |
From (21), (22), and (24), we conclude that at leading order
 | (25) |
 . Using the fact that the leading order term of c(x,y,z,t) (denoted by ϕ(x,y,t)) is independent of the z-coordinate and multiplying eqn (19) by θ02, we get at order O(θ02) that
| ∂tϕ + ∂x(uϕ) + ∂y(vϕ) + ∂z(wϕ) = D(∂x2ϕ + ∂y2ϕ + ∂z2c1), | (26) |
![[scr D, script letter D]](https://www.rsc.org/images/entities/char_e523.gif) t0/l02.
t0/l02.
Integrating the equation in (26) with respect to z, 0 ≤ z ≤ h(x,y,t), and employing the Leibnitz rule, we get that
 | (27) |
 and
and  are the averaged velocities in the x and y coordinates, respectively. Note that by the no-penetration boundary condition it follows that w(x,y,0,t) = 0. Moreover, from the boundary condition in (17a), we get at order O(θ02) that
| ∂zc1(x,y,0,t) = 0. | (28) |
| (−∂xh,−∂yh,1)·(∂xϕ,∂yϕ,∂zc1) = 0, at z = h(x,y,t), |
| ∂zc1 = (∂xh)(∂xϕ) + (∂yh)(∂yϕ), at z = h(x,y,t). | (29) |
| ∂th + [(∂xh)u + (∂yh)v − w]|z=h(x,y,t) = 0. | (30) |
∂t(hϕ) + ∂x(ūhϕ) + ∂y(![[v with combining macron]](https://www.rsc.org/images/entities/i_char_0076_0304.gif) hϕ) = D∇·(h∇ϕ). hϕ) = D∇·(h∇ϕ). | (31) |
Using polar coordinates, (x,y) = (r![[thin space (1/6-em)]](https://www.rsc.org/images/entities/char_2009.gif) cos
cos![[thin space (1/6-em)]](https://www.rsc.org/images/entities/char_2009.gif) α,r
α,r![[thin space (1/6-em)]](https://www.rsc.org/images/entities/char_2009.gif) sin
sin![[thin space (1/6-em)]](https://www.rsc.org/images/entities/char_2009.gif) α), 0 ≤ r ≤ R, 0 ≤ α ≤ 2π, and assuming axial symmetry, we get from (31) that
α), 0 ≤ r ≤ R, 0 ≤ α ≤ 2π, and assuming axial symmetry, we get from (31) that
| ∂t(hϕ) + (∂r/r)(rhūϕ) = (D/r)[∂r(rh∂rϕ)]. |
Finally, using the Gibbs free energy, that is redefining the chemical potential, μ = μ0 + ![[scr R, script letter R]](https://www.rsc.org/images/entities/char_e531.gif)
![[scr T, script letter T]](https://www.rsc.org/images/entities/char_e533.gif)
![[thin space (1/6-em)]](https://www.rsc.org/images/entities/char_2009.gif) ln(c/ρ), as
ln(c/ρ), as
μ ≡ μ0 + ![[scr R, script letter R]](https://www.rsc.org/images/entities/char_e531.gif) ![[scr T, script letter T]](https://www.rsc.org/images/entities/char_e533.gif) ![[thin space (1/6-em)]](https://www.rsc.org/images/entities/char_2009.gif) ln(c/ρ) − ln(c/ρ) − ![[scr R, script letter R]](https://www.rsc.org/images/entities/char_e531.gif) ![[scr T, script letter T]](https://www.rsc.org/images/entities/char_e533.gif) ![[thin space (1/6-em)]](https://www.rsc.org/images/entities/char_2009.gif) ln(1 − c/ρ), ln(1 − c/ρ), |
A3 The shape of the free surface
Employing the expression for the volume loss due to the evaporation process, which was prescribed in (4), we get that the dimensionless version of problem (1) may be stated as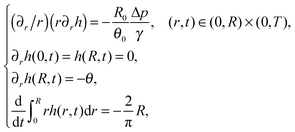 | (32) |
 | (33) |
which when substituted into (33) gives (after additional integration with respect to r)
where C2 is an arbitrary constant of integration, which may be determined by imposing the boundary condition h(R,t) = 0. Using the volume loss constraint (the last condition in (32)) we get that in the pinned contact line case the solution to the problem in (32) is given by
 | (34) |
 | (35) |
Furthermore, in the unpinned contact line case, the (dimensionless) contact angle satisfies θ ≡ 1, so the solution is given by
 | (36) |
 | (37) |
A4 Integral boundary condition
Let us assume that in the vicinity of the contact line the amount of solute particles, (hϕ), does not depend on r to leading order, namely that| (hϕ)(r,t) = (hϕ)(r*,t) + O(Δr*), r ∈ [r*,R]. | (38) |
Hence, using the above assumptions, we get the equation which was prescribed in (7).
When depinning occurs, using the Leibnitz rule in the case that R = R(t) depends on time, we still obtain at leading order the same expression for (hϕ)(r*,t) as in (7). Let us denote by 0 < t1 < t2 two times, before and after the depinning, respectively. In order to estimate the right-hand side of (7) at the new position r*(t2), we need to prescribe the value of ϕ at r*(t2), where we know from our solution during the last pinned stage the values of ϕ at 0 < r < r*(t1). Now, since 0 < r*(t2) < r*(t1) we make one more assumption, namely that during the slipping stage of the contact line the concentration at the point r = r*(t2) remains unchanged. We may then prescribe ϕ at r*(t2) according to ϕ(r*(t2),t2) = ϕ(r*(t2),t1).
A5 Contact angle hysteresis
Let us recall that tn and Rn are the last time level and the corresponding position of the contact line before the de-pinning, and Rn+1 is the new position at time tn+1 after the de-pinning has occurred. From (34), we get that | (39) |
 | (40) |
We may determine the new position of the contact line analogously to Chen et al.,33 although in ref. 33 the underlying assumption is that the volume of the drop remains unchanged during the slipping process. However, we assume that the liquid continues to evaporate during the slipping process and the evaporation process continues to occur at the same rate as in the pinned contact line case. Substituting (39) into (40), and using the dimensionless version of (4), which gives the volume loss due to the evaporation, we get the following equation for Rn+1,
Employing the assumption that θn+1 = 1, we get the cubic equation which was prescribed in (12).
A6 Solubility limit
To incorporate the solubility limit into the advection–diffusion equation, we define a new functionwhich constitutes a smooth approximation for the minimum function,
 | (41) |
It follows that φ(r,t) = 0 for ϕ = 0, and decreasing ϕ0 in the range 0 < ϕ0 ≪ 1, we obtain a better approximation for the minimum function min{ϕ(r,t),ϕ0}.
A7 Numerical sensitivity analysis
We have checked that the three parameters: roughness denoted by ψ, the slope of ln(λn) versus n, where λn denotes the individual distances between rings, and the scaled position of the outermost deposit denoted by P, whose trends we present in Section 4, are not sensitive to the specific choices of the numerical parameters Δr, Δt, and Δr*, as far as convergence of the numerical scheme is achieved. To be more specific, we define convergence for the results presented in Section 4 under the requirement that the general characterisation of the deposited patterns changes by less than 10% for the pinned contact line case and the stick-slip motion of the contact line case and, for convenience, it changes by less than 20% for the unpinned contact line case following a decrease in Δr and Δt or Δr* by a factor of 2. The majority of the results, however, change by a few percent at the most upon the above modifications of the numerical parameters. For several numerical examples, see Tables 1–8.| Δr | Δt | Δr* | ψ | Slope |
|---|---|---|---|---|
| 0.001 | 0.01 | 0.005 | 2.0888 | 0.3165 |
| 0.0005 | 0.005 | 0.005 | 2.1735 | 0.3172 |
| 0.001 | 0.01 | 0.0025 | 2.2143 | 0.3170 |
| Δr | Δt | Δr* | ψ | Slope |
|---|---|---|---|---|
| 0.001 | 0.01 | 0.005 | 1.6629 | 0.0217 |
| 0.0005 | 0.005 | 0.005 | 1.6111 | 0.0188 |
| 0.001 | 0.01 | 0.0025 | 1.6519 | 0.0229 |
| Δr | Δt | Δr* | ψ | P |
|---|---|---|---|---|
| 0.001 | 0.01 | 0.005 | 1.4543 | 0.6255 |
| 0.0005 | 0.005 | 0.005 | 1.4341 | 0.6193 |
| 0.001 | 0.01 | 0.0025 | 1.4242 | 0.6335 |
| Δr | Δt | Δr* | ψ | P |
|---|---|---|---|---|
| 0.001 | 0.01 | 0.005 | 2.0910 | 0.9775 |
| 0.0005 | 0.005 | 0.005 | 2.1478 | 0.9863 |
| 0.001 | 0.01 | 0.0025 | 2.2113 | 0.9805 |
| Δr | Δt | Δr* | ψ |
|---|---|---|---|
| 0.001 | 0.002 | 0.005 | 4.9115 |
| 0.0005 | 0.001 | 0.005 | 4.8505 |
| 0.001 | 0.002 | 0.0025 | 4.9101 |
| Δr | Δt | Δr* | ψ |
|---|---|---|---|
| 0.001 | 0.002 | 0.005 | 2.3060 |
| 0.0005 | 0.001 | 0.005 | 2.3527 |
| 0.001 | 0.002 | 0.0025 | 2.3034 |
| Δr | Δt | Δr* | ψ |
|---|---|---|---|
| 0.001 | 0.002 | 0.05 | 1.9658 |
| 0.0005 | 0.001 | 0.05 | 2.0061 |
| 0.001 | 0.002 | 0.025 | 1.8641 |
| Δr | Δt | Δr* | ψ |
|---|---|---|---|
| 0.001 | 0.002 | 0.05 | 1.2813 |
| 0.0005 | 0.001 | 0.05 | 1.2705 |
| 0.001 | 0.002 | 0.025 | 1.2057 |
Acknowledgements
Anna Zigelman was supported by the Israel Science Foundation (ISF) under grant number 489/14 and Ofer Manor was supported by the CIG FP-7 PEOPLE Programme (Marie Curie Actions) under grant number 615650.References
- S. Semenov, V. M. Starov, R. G. Rubio, H. Agogo and M. G. Velarde, Colloids Surf., A, 2011, 391, 135–144 CrossRef CAS.
- K. Ozawa, E. Nishitani and M. Doi, Jpn. J. Appl. Phys., 2005, 44, 4229–4234 CrossRef CAS.
- Y. Xia, E. Kim, M. Mrkich and G. M. Whitesides, Chem. Mater., 1996, 8, 601–603 CrossRef CAS.
- S. H. Ko, J. Chung, N. Hotz, K. H. Nam and C. P. Grigoropoulos, J. Micromech. Microeng., 2010, 20, 125010 CrossRef.
- A. S. Joshi and Y. Sun, J. Disp. Technol., 2010, 6, 579–585 CrossRef CAS.
- M. R. E. Warner, R. V. Craster and O. K. Matar, J. Colloid Interface Sci., 2003, 267, 92–110 CrossRef CAS PubMed.
- R. D. Deegan, O. Bakajin, T. F. Dupont, G. Huber, S. R. Nagel and T. A. Witten, Nature, 1997, 389, 827–829 CrossRef CAS.
- Y. O. Popov, Phys. Rev. E: Stat. Phys., Plasmas, Fluids, Relat. Interdiscip. Top., 2005, 71, 036313 CrossRef PubMed.
- L. Frastia, A. J. Archer and U. Thiele, Phys. Rev. Lett., 2011, 106, 077801 CrossRef PubMed.
- U. Thiele, Adv. Colloid Interface Sci., 2014, 206, 399–413 CrossRef CAS PubMed.
- L. Frastia, A. J. Archer and U. Thiele, Soft Matter, 2012, 8, 11363–11386 RSC.
- L. Shmuylovich, A. Q. Shen and H. A. Stone, Langmuir, 2002, 18, 3441–3445 CrossRef CAS.
- W. Han and Z. Lin, Angew. Chem., Int. Ed., 2012, 51, 1534–1546 CrossRef CAS PubMed.
- T. Okuzono, M. Kobayashi and M. Doi, Phys. Rev. E: Stat. Phys., Plasmas, Fluids, Relat. Interdiscip. Top., 2009, 80, 021603 CrossRef PubMed.
- R. G. Larson, AIChE J., 2014, 60, 1538–1571 CrossRef CAS.
- R. Bhardwaj, X. Fang and D. Attinger, New J. Phys., 2009, 11, 075020 CrossRef.
- R. Bhardwaj, X. H. Fang, P. Somasundaran and D. Attinger, Langmuir, 2010, 26, 7833–7842 CrossRef CAS PubMed.
- R. D. Deegan, Phys. Rev. E: Stat. Phys., Plasmas, Fluids, Relat. Interdiscip. Top., 2000, 61, 475–485 CrossRef CAS.
- R. D. Deegan, O. Bakajin, T. F. Dupont, G. Huber, S. R. Nagel and T. A. Witten, Phys. Rev. E: Stat. Phys., Plasmas, Fluids, Relat. Interdiscip. Top., 2000, 62, 756–765 CrossRef CAS.
- H. Hu and R. G. Larson, J. Phys. Chem. B, 2002, 106, 1334–1344 CrossRef CAS.
- B. J. Fischer, Langmuir, 2002, 18, 60–67 CrossRef CAS.
- D. B. van Dam and J. G. M. Kuerten, Langmuir, 2008, 24, 582–589 CrossRef CAS PubMed.
- D. P. Siregar, J. G. M. Kuerten and C. W. M. van der Geld, J. Colloid Interface Sci., 2013, 392, 388–395 CrossRef CAS PubMed.
- L. W. Schwartz and R. R. Eley, J. Colloid Interface Sci., 1998, 202, 173–188 CrossRef CAS.
- J. Freed-Brown, Soft Matter, 2014, 10, 9506–9510 RSC.
- E. Adachi, A. S. Dimitrov and K. Nagayama, Langmuir, 1995, 11, 1057–1060 CrossRef CAS.
- M. Wilczek, W. B. H. Tewes, S. V. Gurevich, M. H. Köpf, L. Chi and U. Thiele, Math. Modell. Nat. Phenom., 2015, 10, 44–60 CrossRef.
- F. Doumenc and B. Guerrier, Langmuir, 2010, 26, 13959–13967 CrossRef CAS PubMed.
- F. Doumenc and B. Guerrier, Europhys. Lett., 2013, 103, 14001 CrossRef.
- H. Bodiguel, F. Doumenc and B. Guerrier, Langmuir, 2010, 26, 10758–10763 CrossRef CAS PubMed.
- H. Bodiguel, F. Doumenc and B. Guerrier, Eur. Phys. J.: Spec. Top., 2009, 166, 29–32 CrossRef.
- D. Kaya, V. Belyi and M. Muthukumar, J. Chem. Phys., 2010, 133, 114905 CrossRef CAS PubMed.
- Y.-J. Chen, K. Suzuki, H. Mahara and T. Yamaguchi, Chem. Phys. Lett., 2012, 529, 74–78 CrossRef CAS.
- P. G. de Gennes, Rev. Mod. Phys., 1985, 57, 827–863 CrossRef CAS.
- J. Xu, J. Xia, S. W. Hong, Z. Lin, F. Qiu and Y. Yang, Phys. Rev. Lett., 2006, 96, 066104 CrossRef PubMed.
- Y. O. Popov and T. A. Witten, Phys. Rev. E: Stat. Phys., Plasmas, Fluids, Relat. Interdiscip. Top., 2003, 68, 036306 CrossRef PubMed.
- N. N. Lebedev, Special Functions and Their Applications, Prentice-Hall, Englwood-Cliffs, NJ, 1965 Search PubMed.
- H. Gelderblom, O. Bloemen and J. H. Snoeijer, J. Fluid Mech., 2012, 709, 69–84 CrossRef CAS.
- J. Egger and L. M. Pismen, Phys. Fluids, 2010, 22, 112101 CrossRef.
- T. P. Witelski and M. Bowen, Appl. Numer. Math., 2003, 45, 331–351 CrossRef.
- Z. Lin and S. Granick, J. Am. Chem. Soc., 2005, 127, 2816–2817 CrossRef CAS PubMed.
- C. Y. Poon and B. Bhushan, Wear, 1995, 190, 76–88 CrossRef CAS.
- E. S. Gadelmawla, M. M. Koura, T. M. A. Maksoud, I. M. Eleva and H. H. Soliman, J. Mater. Process. Technol., 2002, 123, 133–145 CrossRef.
- J. E. Dove, J. D. Frost and P. M. Dove, Geosynth. Int., 1996, 3, 227–245 CrossRef CAS.
| This journal is © The Royal Society of Chemistry 2016 |

