
 Open Access Article
 This Open Access Article is licensed under a Creative Commons Attribution-Non Commercial 3.0 Unported Licence
Multi-step control over self-assembled hydrogels of peptide-derived building blocks and a polymeric cross-linker†
Van Duc
Nguyen
a,
Asish
Pal
b,
Frank
Snijkers
a,
Mathieu
Colomb-Delsuc
b,
Giulia
Leonetti
b,
Sijbren
Otto
*b and
Jasper
van der Gucht
*a
aPhysical Chemistry and Soft Matter, Wageningen University, Dreijenplein 6, 6703 HB Wageningen, The Netherlands. E-mail: jasper.vandergucht@wur.nl
bCentre for Systems Chemistry, Stratingh Institute, University of Groningen, Nijenborgh 4, 9747 AG Groningen, The Netherlands. E-mail: s.otto@rug.nl
First published on 12th October 2015
Abstract
We present a detailed study of self-assembled hydrogels of bundled and cross-linked networks consisting of positively charged amyloid-like nanofibers and a triblock copolymer with negatively charged end blocks as a cross-linker. In a first step small oligopeptides self-assemble into macrocycles which are held together by reversible disulfide bonds. Interactions between the peptides cause the macrocycles to assemble into nanofibers, which form a reversible hydrogel. The physical properties of the hydrogel are tuned using various methods such as control over the fibre length, addition of a cross-linking copolymer, and addition of salt. We establish a relationship between the bulk mechanical properties, the properties of the individual fibers and the hydrogel morphology using characterization techniques operating at different length scales such as rheology, atomic force microscopy (AFM) and cryo transmission electron microscopy (Cryo-TEM). This allows for a precise control of the elastic behaviour of these networks.
1 Introduction
Self-assembled gel networks of bundled- and cross-linked filaments have a lot of potential for biomedical and pharmaceutical applications such as tissue engineering,1–3 drug delivery,4–7 and bio-sensing.8–10 Over the past decades, the number of papers published on filamentous hydrogels has increased rapidly. It was shown that control of network properties is possible by tuning filament concentration, media pH,11–14 bundling thickness, cross-linker density,15–20 salt concentration,20 light,21 temperature,22,23 or the presence of enzymes.24,25 In most cases, however, only qualitative relations between single filament properties, filament concentration, network morphology, and rheological response were obtained.In addition, most theories of soft matter elasticity assume that the deformation of gel networks is affine.15,18,26–29 The affine deformation theories implicitly assume that the deformations of the network are distributed uniformly throughout the sample, and thus the strain is homogeneous at all length scales. However, recent experimental30,31 and theoretical32,33 work suggests that the mechanics of loosely crosslinked filament networks may be dominated by non-affine deformation modes. The elasticity in this regime is governed by bending of the filaments, and depends strongly on the filament length.32 At higher concentrations, the deformation is more affine and the elasticity originates from stretching of the thermally induced fiber fluctuations. In this regime the elasticity is predicted to become independent of filament length. Unfortunately, so far, experimental results to support these numerical studies of the length dependence of the network elasticity are still missing due to lack of monodisperse fiber systems.
Furthermore, the elastic behavior of filament networks depends non-trivially on the amount of bundling and cross-linking.18,34,35 Cross-linkers can align filaments into bundles and they can cross-link filaments or bundles into networks. Bundling increases the effective stiffness of the filaments, which enhances the modulus, but bundling also increases the effective mesh size of the network, which decreases the modulus. Therefore, finding the optimal amount of cross-linker is crucially important for controlling the gel strength.
The aim of the present paper is to study experimentally the effects of filament length and crosslink density on the mechanical properties of filamentous networks. To do this, we use a unique model hydrogel consisting of monodisperse self-assembled nanofibers, first reported by Carnall et al.36 This system is based on small peptide-derived building blocks that form a mixture of macrocycles of different sizes (Fig. 1a). Spontaneous fiber growth does not readily occur in this mixture, because most of the building blocks are present in stable, non-assembling trimeric and tetrameric macrocycles. However, upon adding seeds of preformed hexameric fiber fragments, the composition shifts almost completely to the hexameric form, leading to the formation of fibers with controllable lengths and low polydispersities (Fig. 1b).37 The polydispersity index (PDI) obtained with this kinetically controlled nucleation and growth mechanism was as low as 1.04, which is much lower than that of thermodynamically controlled supramolecular polymers (PDI = 2).38 This makes this system uniquely suited to investigate the length dependence of network elasticity, and to test the theoretical scaling predictions. Furthermore, we show how the properties of the hydrogels can be tuned by the addition of cross-linkers and salt. As crosslinker, we use a triblock copolymer consisting of a neutral, hydrophilic PEG spacer flanked by two negatively charged blocks (Fig. 1d). The anionic blocks can adsorb onto the positively charged fibers. This may lead to the formation of looped conformations of the polymer around the peptide fibers, align fibers into bundles, or cross-link fibers or bundles into networks, and is therefore expected to have a large effect on the morphology and the rheological properties of the hydrogel (Fig. 1e). We investigate the relation between these effects using rheology, cryo-TEM, AFM, and zeta-potential measurements, and compare our findings to theoretical models for filamentous networks.15,18,32
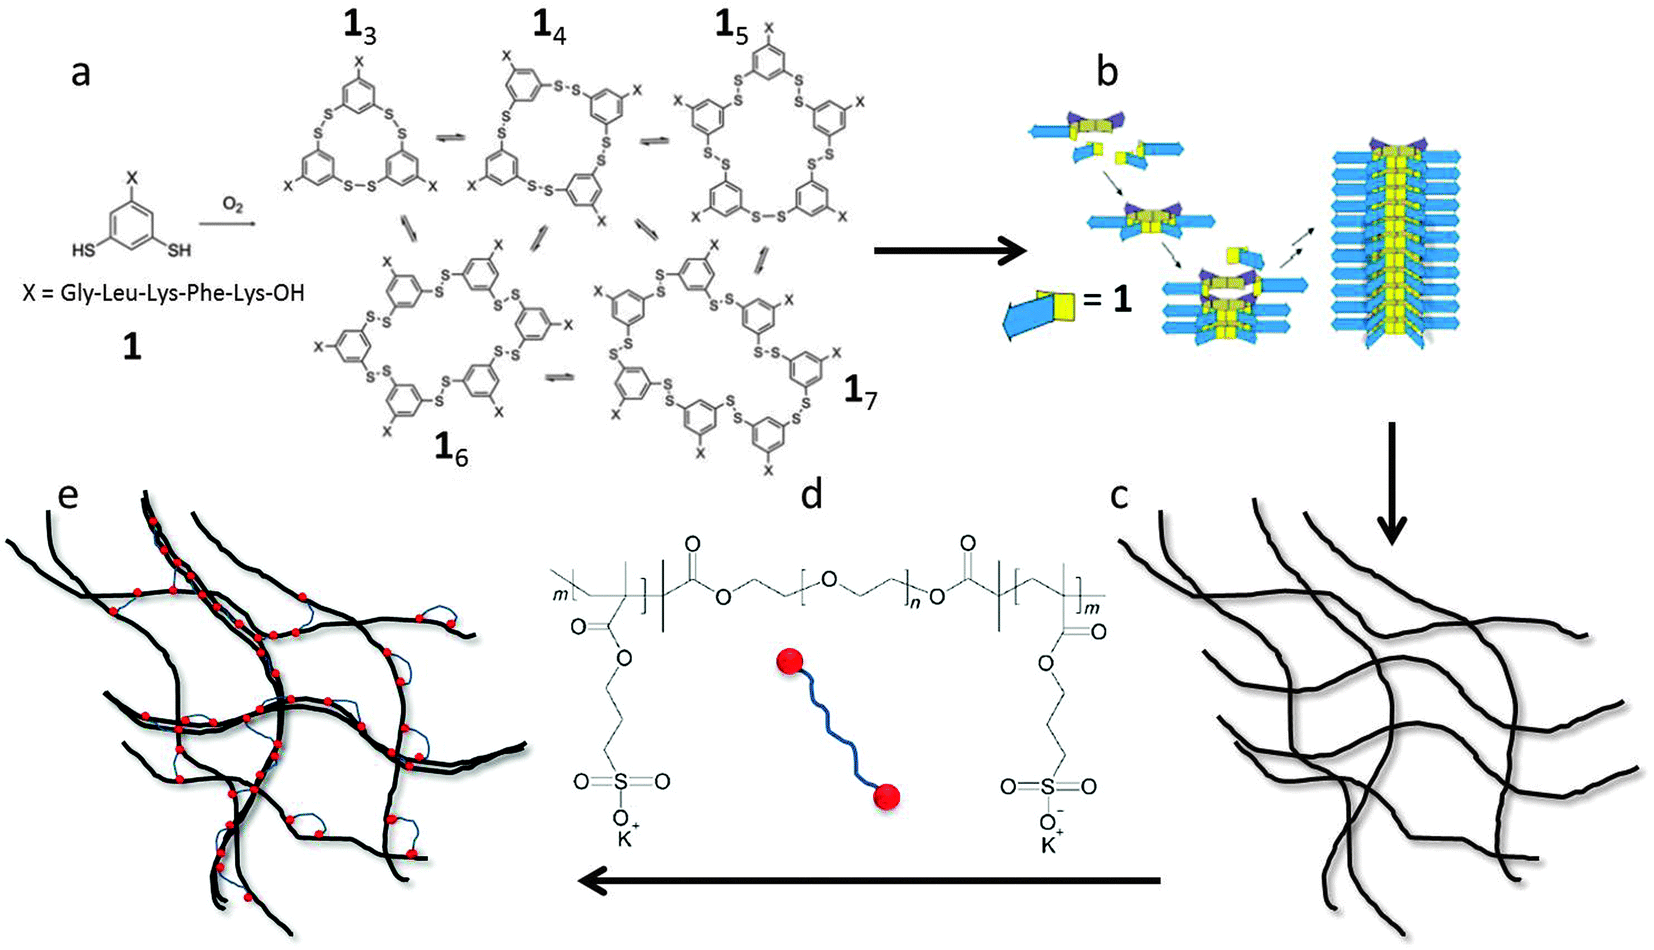 | ||
| Fig. 1 Schematic illustration of: (a) a small dynamic combinatorial mixture of macrocycles made from dithiol building block 1; (b) assembly of hexamer macrocycles into single fibers; (c) long fibers form a hydrogel network by entanglements; (d) triblock copolymer PSPMA25–PEO230–PSPMA25, used as crosslinker; (e) hydrogel network formed by fibers and triblock copolymers. The triblock copolymers link the fibres together due to ionic interaction, leading to a stronger gel. | ||
2 Experimental
Materials
The peptide building block, 1 with (>95% purity) was obtained from Cambridge Peptides (Birmingham, UK). Double distilled water was used in all experiments. Boric acid and potassium hydroxide, utilized for the preparation of buffers and pH adjustment were obtained from Acros Organics and Merck Chemicals, respectively. Acetonitrile (UPLC-S/LC-MS grade) and trifluoroacetic acid were purchased from Biosolve BV.Fiber formation from building block 1
Peptide building block 1 was dissolved in 50 mM potassium borate buffer to a final concentration of 3.8 mM. The pH of the resulting solution was adjusted to 7.8 by addition of small amounts of 2.0 M KOH solution. The monomer solution was then oxidized up to 70% using a freshly prepared solution of sodium perborate (40 mM, pH 7.8) giving a mixture of monomer, trimer and tetramer. This mixture was then seeded with a pre-formed hexamer 16 (which had been continuously stirred at 1200 rpm) in 20 mol% (mol% was calculated as equivalents of 1 in the hexamer relative to equivalents of 1 in the solution). All solutions were contained in HPLC vials tightly closed with Teflon-lined snap caps. The mixtures were stirred at 1200 rpm using a Teflon coated magnetic stirrer bar (5 × 2 mm, obtained from VWR), on an IKA RCT basic magnetic stir-plate. To monitor the conversion to the hexamer form, 2 μL was diluted with 198 μL of water and 10.0 μL of this sample was analyzed using ultra performance liquid chromatography (UPLC) and liquid chromatography-mass spectrometry (UPLC-MS).UPLC analyses were performed on a Waters Acquity H-class machine equipped with diode array UV/Vis detector. UPLC-MS analyses were performed on a Xevo G2 UPLC/TOF with ESI ionization, manufactured by Waters. All analyses were performed at 35 °C using a reversed-phase UPLC column (Phenomenex Aeris Peptide, 2.1 × 150 mm; 1.7 μm). UV absorbance was monitored at 254 nm. Positive-ion mass spectra were acquired using electro-spray ionization; injection volume 10 μL of freshly aliquoted sample; column temperature 35 °C; flow rate 0.3 mL min−1. The eluents, acetonitrile (B) and water (A) contained 0.1% of TFA. The mixtures components were eluted with a gradient as shown in detail in Table S1 and Fig. S1 in the ESI.†
Synthesis, purification, and characterization of triblock copolymers
The triblock copolymer PSPMA–PEO–PSPMA was synthesized by atom transfer radical polymerization (ATRP).39 We followed the protocol of Lemmers et al.40 for the synthesis of a negatively charged triblock based on functionalized PEG. First, a bifunctional macro-initiator was synthesized by functionalizing the end groups of a polyethylene glycol (PEG) with a number-averaged molar mass of 104 g mol−1. The triblock copolymer was then prepared by dissolving 14.1 g of 3-sulfopropylmethacrylate potassium salt (KSPMA) and 10.0 g of the bifunctionalized PEG in 20 mL of a 1![[thin space (1/6-em)]](https://www.rsc.org/images/entities/char_2009.gif) :1 mixture of water and dimethylformamide (DMF) at 60 °C. These amounts were chosen to obtain a degree of polymerization of about 60 per chain, i.e. 30 functional groups on each end of the PEG. A second mixture containing the catalysts was prepared separately. It contained copper(I)chloride (at the same molar concentration as the bifunctionalized PEG), copper(II)chloride (two-fold molar excess) and 2,2-bipyridyl (7.5 molar excess) in 10 mL of the 1:1 water/DMF solvent. The ATRP catalyst mixture was added to the solution of bifunctional PEG and KSPMA to start the polymerization. The reaction was performed under nitrogen atmosphere and it was quenched after about four hours by bubbling oxygen through the mixture.
:1 mixture of water and dimethylformamide (DMF) at 60 °C. These amounts were chosen to obtain a degree of polymerization of about 60 per chain, i.e. 30 functional groups on each end of the PEG. A second mixture containing the catalysts was prepared separately. It contained copper(I)chloride (at the same molar concentration as the bifunctionalized PEG), copper(II)chloride (two-fold molar excess) and 2,2-bipyridyl (7.5 molar excess) in 10 mL of the 1:1 water/DMF solvent. The ATRP catalyst mixture was added to the solution of bifunctional PEG and KSPMA to start the polymerization. The reaction was performed under nitrogen atmosphere and it was quenched after about four hours by bubbling oxygen through the mixture.
The resulting mixture was purified by dialysis against a 1 M potassium chloride (KCl) solution at pH = 3. Salts of ethylene diamine tetra acetic acid (EDTA) were added up to a concentration of 10 mM to bind the copper ions. The next dialysis step was against 0.1 M KCl at pH = 3 and 10 mM EDTA. Subsequently, several purification steps were done against pure water. Finally, the triblock copolymer was obtained by overnight freeze-drying.
The final product was dissolved in deuterium oxide to determine the structure by 1H-NMR on a Bruker Avance III 400 MHz nuclear magnetic resonance (NMR) spectrometer. The measured 1H-NMR spectrum of the triblock copolymer is shown in Fig. S2 (ESI†) and is qualitatively identical to the one reported by Lemmers et al.40 We determine the degree of polymerization (DP) from the integrals of characteristic peaks as described previously40 (see ESI†), and find a total degree of polymerization of 50, corresponding to on average 25 sulfopropylmethacrylate groups per block. Hence we end up with a triblock with a neutral mid-block and two negatively charged end-blocks: PSPMA25–PEO230–PSPMA25.
Preparation of fiber/polymer mixtures
Mixtures of fiber and polymer were prepared in a vessel by adding a desired amount of a concentrated stock solution of the triblock copolymer to the fiber suspension. The mixture was then gently stirred with the pipette tip to homogenize the polymer distribution in the solution whilst minimizing breakage of the fibers.Rheological measurements
Rheological measurements were performed using a TA Discovery HR-3 hybrid rheometer equipped with a 8 mm plate–plate geometry and 1 mm plate separation. The temperature was kept constant at T = 25 °C using a Peltier element. The sample was prepared and loaded directly into the rheometer, and it was covered with tetradecane to prevent the evaporation of water. We started with an oscillation measurement at a fixed angular frequency (ω) of 1 rad s−1 and at a strain (γ) of 1% to follow the development of the storage and loss modulus in time. When the storage modulus (G′) and loss modulus (G′′) reached a constant value, a frequency sweep measurement with an angular frequency between 0.01 and 100 rad s−1 was performed at the same strain mentioned above. Directly after this, amplitude sweeps with a strain range between 0.1 and 200% were carried out at an angular frequency range between 0.1 and 5 rad s−1, to probe the non-linear response.Atomic force microscopy (AFM)
We diluted a stock solution (3.8 mM) 500 times with the same buffer and then dropped 10 μL of sample onto a clean hydrophilic silica wafer and left it for 5 minutes. The wafer was then washed with 500 μL of Mili-Q H2O to remove salts. Finally, the wafer was dried by evaporating for about 10 minutes. We used a Nanoscope V in Scan Asyst™ imaging mode and non-conductive silicon nitride probes (Veeco, NY, USA) to analyze the dry samples. The spring constant of the probes was 0.32 N m−1. Images were recorded at frequencies between 0.5 and 1.2 Hz and analyzed with NanoScope analysis 1.20 software (Veeco, Instruments Inc. 2010, USA).Cryo-electron microscopy (Cryo-TEM) and negative staining transmission electron microscopy
Cryo-electron microscopy: a small drop of sample was placed on a Quantifoil 3.5/1 holey carbon-coated grid, purchased from Quantifoil Micro Tools GmbH. The sample vitrification procedure was carried out using an automated vitrification robot (FEI Vitrobot™ Mark III). The grids were observed in a FEI Tecnai 20, G2 Polara cryo-electron microscope equipped with a LaB6 filament operating at 300 kV and the images were recorded using a 2k × 2k Gatan CCD camera under low-dose conditions with a slow scan CCD camera.Negative staining transmission electron microscopy: a small drop (5 μL) of sample was deposited on a 400 mesh copper grid covered with a thin carbon film (Agar Scientific). After 30 s, the droplet was blotted on filter paper. The sample was then stained twice (4 μL each time) with a solution of 2% uranyl acetate deposited on the grid and blotted on the filter paper after 30 s each time. The grids were observed in a Philips CM120 Cryo-TEM operating at 120 kV. Images were recorded on a slow scan CCD camera.
Zeta potential and scattering intensity measurements
Zeta potentials and scattering intensity were measured using a Malvern Zetasizer Nano ZS (Malvern Instruments Ltd, Malvern, UK) fitted with a production standard 532 nm, 50 mW diode laser source. The instrument measures the scattering intensity and the fiber mobility is measured using a built-in Mach-Zender interferometer.41–43 The stock solution was diluted 500 times and presented to the instrument in a closed capillary, immersed completely in a temperature controlled block holder thereby avoiding intrinsic thermal gradients. In the presence of an alternating electric field, if the target fiber has a non-zero average surface charge it will, ignoring any rotational effects, start to move toward either the anode or cathode, depending on the overall fiber charge and field direction. In good approximation, the relation between the surface zeta potential (ζ) and the drift velocity of the fiber (v) is given by ζ = εE/(vη), where ε is the electrolyte relative permittivity, E the electric field strength, and η the solvent viscosity.443 Results and discussions
Effects of fiber length on the gel properties
We previously reported that control over fiber length could be exerted by mechanical and chemical means to produce highly uniform and sufficiently stable seeds, from which well-defined materials can then be grown.37 Here, we seeded the peptide solution at a concentration of 3.8 mM (corresponding to a 16 volume fraction of 7 × 10⁻³, ESI†) with a solution of highly monodisperse preformed hexamers. UPLC analysis of the samples indicates the formation of more than 95% hexamer 16 within a week.37 The solution was either kept stirring at different stirring speeds to mechanically control the nanofiber lengths, or allowed to stand in order to have uninterrupted growth of nanofibers. We followed the development of the gel network directly using cryo-TEM and show a representative image of the uninterruptedly grown sample after a month in Fig. 2a. In the cryo-TEM image, fibers appear as dark gray lines in a light gray background. Gel networks are formed either by entanglements or interactions between fibers. In order to obtain the thickness of the individual fibers, we performed negative staining electron microscopy experiments at a low concentration. Fig. 2b shows a representative image, from which we estimate the fiber diameter to be about 5–10 nm.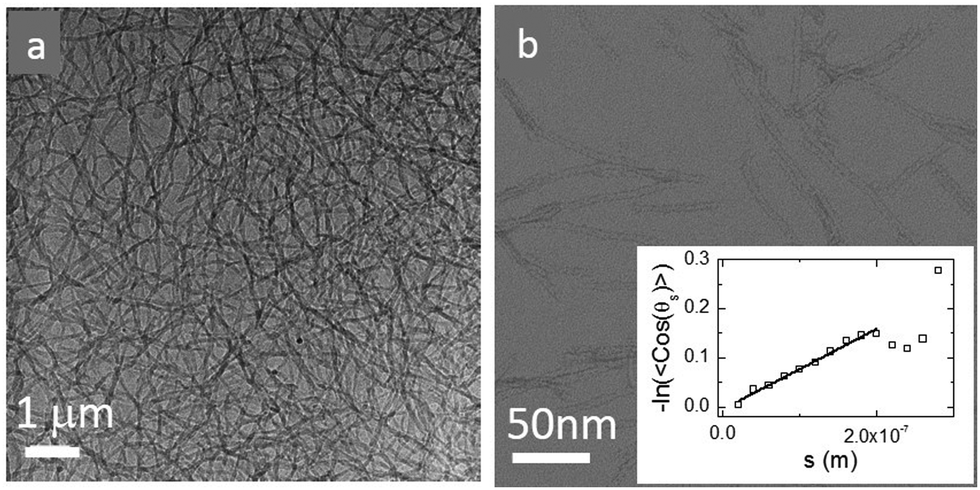 | ||
| Fig. 2 (a) Cryo-TEM image of the hexamer 16 after one month, showing the hydrogel network structure. Concentration of 1 was 3.8 mM. (b) Negative staining electron microscopy image of the same fibers after diluting 100 times. The image shows individual fibers. Inset: −ln〈cos(θij)〉 obtained by fitting splines to the fiber contours in a dilute fiber suspension as a function of arc length. The persistence length is obtained from the slope of a linear fit. | ||
To probe the stiffness of a single fiber, we dilute the sample 100 times and measure the persistence length of a single fiber directly from cryo-TEM images. The persistence length can be obtained as the length scale over which correlations in the direction of the tangent are lost, 〈cos(θij)〉 = e−(Li−Lj)/LP. Here θij is the angle between two tangent vectors at positions Li and Lj along the fiber contour, and the angular brackets indicate the average over all positions and fiber conformations.45 The contour of the individual fiber is fitted using the splines method. These contour fits allow us to achieve the orientation correlation function and plot −ln〈cos(θij)〉 as a function of arc length in the insert of Fig. 2. From this, we obtain a value for the persistence length LP of 1.5 μm, comparable to values obtained for actin filaments with the a diameter of 7 nm15,18,19,46,47 similar to that of our fibers.
To control the fiber length, we grew fibers under different mechanical agitation modes such as stirring with a rotating magnetic bar at speeds of 1200 rpm, 200 rpm, and no agitation. The weight average length (Lw) and number average length (Ln) of the fibers were measured directly from cryo-TEM images after diluting the stock suspension 100 times. We list the number average length at different stirring speeds in Table 1. The polydispersity index PDI = Lw/Ln, is about 1.25 in all samples.37 In general, Ln decreases with increasing stirring speed as a result of shear-induced fiber break-up. At a given stirring speed, Ln does not depend on the waiting time. However, in the absence of agitation, Ln gradually increases and reaches a steady value after a month.
| Sample | L n (nm) | G 1′ (Pa) | G 1′′ (Pa) |
|---|---|---|---|
| Stirring at 1200 rpm | 465 | 12 | 4 |
| Stirring at 200 rpm | 745 | 38 | 10 |
| No agitation for 1 week | 1500 | 320 | 65 |
| No agitation for 1 month | 2000 | 636 | 98 |
| No agitation for 3 months | 2000 | 640 | 96 |
The fibers will form an entangled network if the concentration is higher than the entanglement concentration, or, equivalently, if the average fiber length is above the entanglement length Le. In our experiment Le ≃ 135 nm (ESI†). This implies that, in all cases, Ln is larger than Le, indicating that our hydrogels are in the entangled regime. We measure the moduli of the entangled networks using a rheometer. The resulting frequency sweeps for different fiber lengths are shown in Fig. 3a. In all cases, up to ω = 10 rad s−1, the storage modulus (G′) dominates the loss modulus (G′′), and both moduli are nearly frequency independent. This frequency independence is also observed for other filamentous polymer gels18 and is due to the very long disentanglement time in such systems, which falls outside the measured frequency range. To compare the gel strength of the different samples more quantitatively, we list the values of the storage modulus (G1′) and loss modulus (G1′′) at an angular frequency ω = 1 rad s−1 in Table 1. We find that both G1′ and G1′′ increase significantly with an increase of Ln: as the average length of the fibers increases from 465 nm to 2000 nm, there is a gradual increase in the moduli by a factor of about 50 for G1′ and by a factor of about 20 for G1′′. In addition, for the stirred samples, we see almost no variation of both G1′ and G1′′ of the system after a week. By contrast, for the sample in the absence of mechanical agitation, when waiting longer, both G1′ and G1′′ keep increasing and reach a steady value after a month. Probably, the shear-induced break-up of fibers in the agitated samples increases the number of growing ends and thereby speeds up the fiber growth.
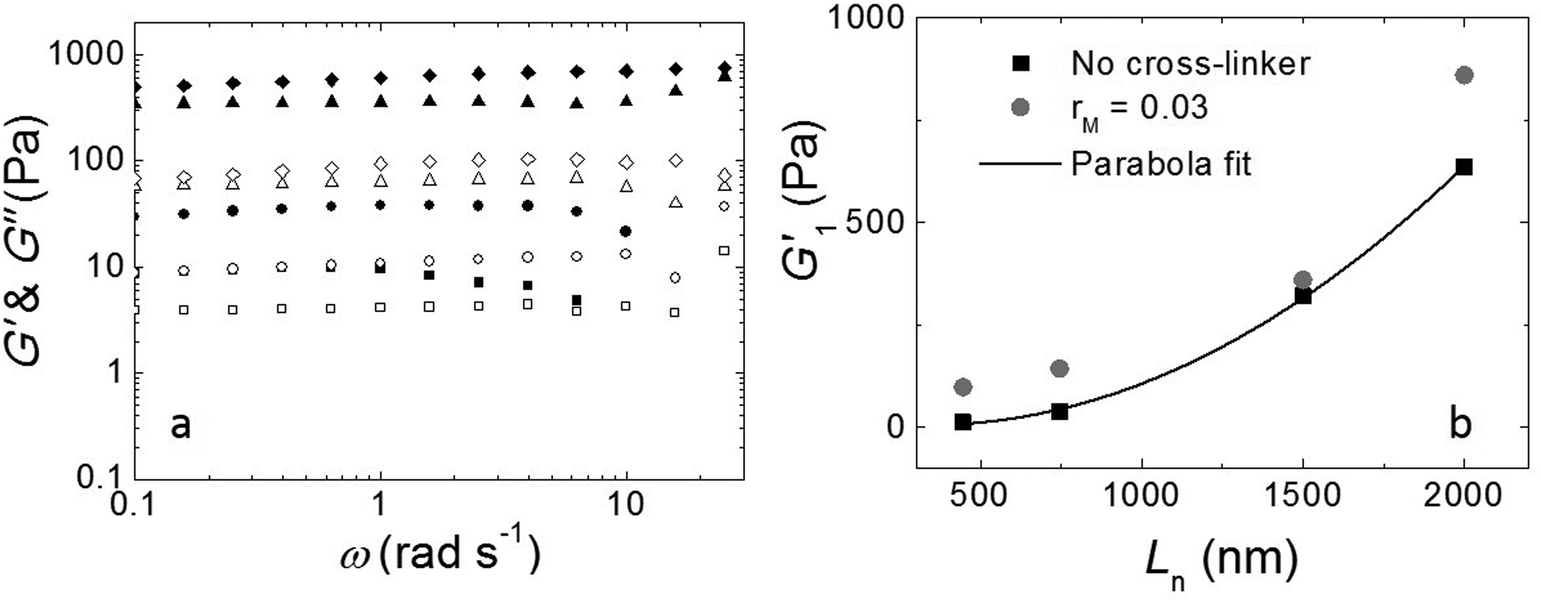 | ||
| Fig. 3 (a) Frequency sweep: storage modulus (solid symbols) and loss modulus (open symbols) at γ = 1% as a function of angular frequency with different fiber lengths. Squares: Ln = 465 nm; circles: Ln = 745 nm; triangles: Ln = 1500 nm; diamonds: Ln = 2000 nm. All samples show a storage modulus that is larger than the loss modulus, indicating that the fibers form a gel. (b) Length dependence of the elastic modulus: G1′ as a function of Ln for sample without cross-linker (black squares) and sample with rM = 0.03 (gray circles). Both samples show G1′ ∝ Ln2. | ||
We tested if, in this experiment, Ln is the only parameter to control the viscoelastic moduli of the gels. We took the fully grown samples in the absence of agitation and then stirred to break the fibers. Indeed, at the same stirring speed, we achieved the same moduli as when the sample had grown under stirring. This implies that the viscoelastic moduli of the final product do not depend on the growth mechanism and that the moduli only depend on the average fiber length.
As shown in Fig. 3b, the modulus increases approximately quadratically with the fiber length Ln (at the same weight concentration of fibers). This length dependence was predicted numerically by Broedersz et al.32 for fibers in the non-affine deformation regime, where elasticity is dominated by bending modes. As the length of the fibers increases, bending costs more energy due to the increasing number of entanglements per fiber that hinder bending. This leads to an increase in modulus. For Ln ≫ Le, a transition to the affine deformation regime would be expected, where the modulus becomes independent of length, but even for the longest fibers (Ln/Le ≈ 15), we see no evidence for such a transition.
Effects of cross-linker on the gel properties
Here, we used a triblock copolymer with two negatively charged end blocks as a cross-linker. Because the fibers have a net positive charge, the anionic blocks bind to the fibers by ionic bonds, while the flexible middle block acts as a spacer. In this experiment we fixed the fiber volume fraction of 7 × 10⁻³ and the average fiber length Ln = 745 nm by keeping a constant stirring speed of 200 rpm and varied the molar ratios of triblock copolymer to peptide (rM) from 0 to 0.095. We measured the viscoelastic moduli by performing a frequency sweep and showed G1′ as a function of rM in Fig. 4a. The data shows a non-monotonic dependence of G′ on rM. It reveals two distinct regimes; in the first regime, as we increase rM from 0 to 0.03, G′ increases significantly from 38 Pa to 228 Pa. By contrast, in the second regime, when rM is larger than 0.03, adding more triblock copolymer weakens the gel again. Note that at a very high molar ratio, the modulus is even lower than in the absence of triblock copolymer. We repeated this experiment with a shorter fiber of Ln = 465 nm and show the result in the same graph. Although the absolute values are about 3 times smaller for these fibers than for the longer ones, the behavior of the moduli is very similar. In both experiments we find the maxima of the elastic moduli at rM close to 0.03.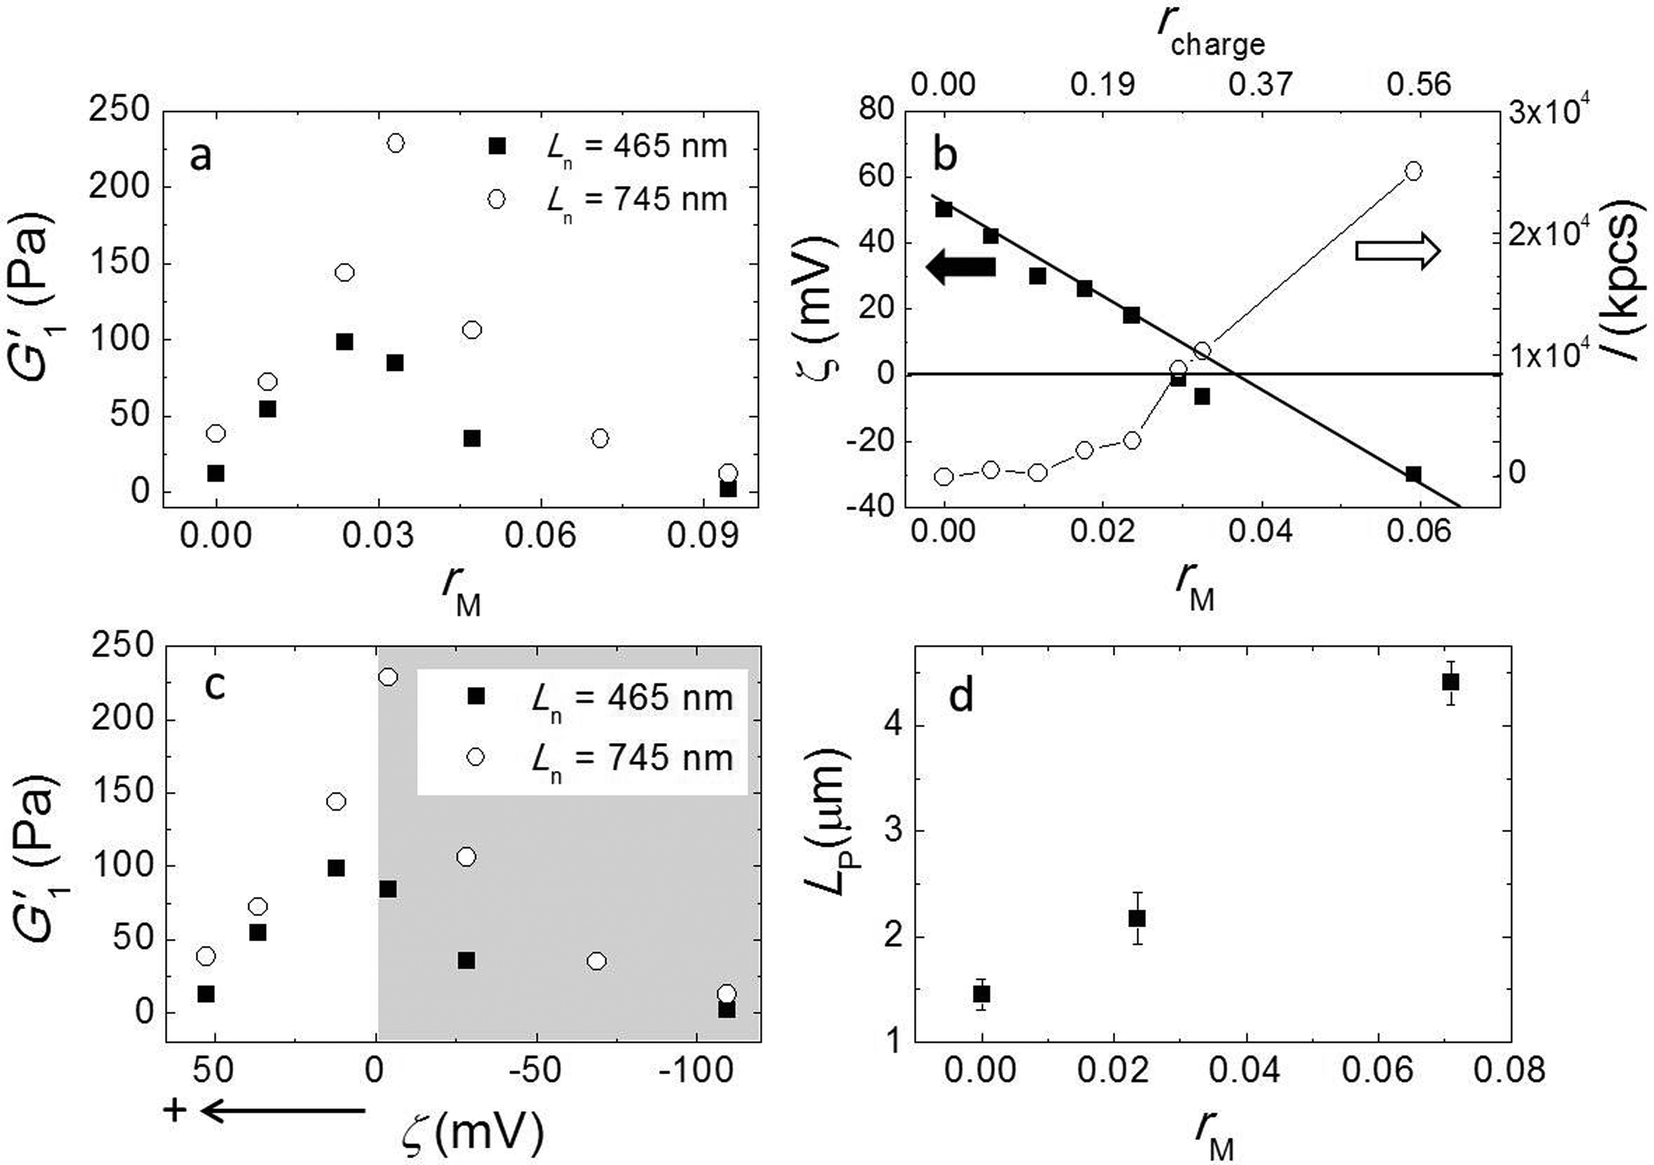 | ||
| Fig. 4 Effect of cross-linker: (a) storage modulus G1′ vs. the molar ratio of triblock copolymer to peptide rM with Ln = 465 nm (solid squares) and Ln = 745 nm (open circles). (b) Zeta potential ζ (solid squares) and scattering intensity I (open circles) as a function of rM (bottom axis) and the charge ratio rcharge (top axis). The iso-electric point, ζ = 0 mV, is approximately at rM = 0.035 and rcharge ∼ 0.3. (c) G′ vs. ζ shows that the elastic modulus has a maximum when ζ approaches the iso-electric point. (d) Persistence length LP as a function of molar ratio rM. | ||
To obtain more insight into the effect of adding triblock copolymer to the system, we measured the zeta potential (ζ) of fibers and the scattering intensity (I). ζ is the electrostatic potential at the hydrodynamic slip plane of the fibers which is determined by their net charge and by the ionic strength. We plot ζ and I as a function of rM (bottom axis) in Fig. 4b. We find that the zeta potential decreases more or less linearly from ζ = 50 mV to ζ = −30 mV as rM increases from 0 to 0.06. This indicates that the negatively charged blocks of the triblock indeed bind to to the positively charged fibers. From a linear fit, we find that the iso-electric point (where ζ = 0 mV) is approximately at rM ∼ 0.035, which is very close to the molar ratio where the moduli have a maximum. At this molar ratio, the positive charge on the fibers is just compensated by the negative charge of the adsorbed triblock copolymer. We estimated the corresponding charge ratio in the mixture (rcharge) of cross-linker to fiber assuming that a triblock copolymer molecule has 56 negative charges and a 16 has 6 positive charges and show the results in Fig. 4b (top axis). We found that the iso-electric point is not at rcharge = 1, but at rcharge ∼ 0.3, suggesting that the lysine groups on the peptide are not fully protonated at pH = 7.8. We present the moduli as a function of ζ in Fig. 4c. Obviously, the modulus goes through a sharp maximum around the iso-electric point. In contrast to ζ, I increases monotonically with cross-linker addition (Fig. 3b), slowly at first, but more strongly as the iso-electric point is approached, indicating the formation of bundles or aggregates. The scattering intensity increases even more strongly when the polymer is present in excess and the fibers becomes negatively charged. This indicates that the origin of fiber aggregation and bundling is not the reduction of the electrostatic repulsion between fibers due to charge neutralization. Most likely, the triblock copolymer acts as a crosslinker, by adsorbing with its two end blocks onto different fibers. At very high polymer concentrations, the aggregation becomes so strong that the fiber aggregates can no longer contribute to the elastic modulus.
To directly visualize the structure of the fibers in the presence of cross-linkers, we used AFM. Three representative AFM images are shown in Fig. 5. In these images, fibers appear as bright lines in a dark background. Fig. 5a represents a sample without any triblock copolymer. Fig. 5b and c represent a sample with triblock copolymer at a molar ratio of 0.03 and 0.095, respectively. While the first image shows a homogeneous distribution of single fibers, the second image shows more networks and fiber bundling. The final image shows very few single fibers, but many aggregates. This is in good agreement with the light scattering data. We should keep in mind that the samples were dried before AFM analysis and therefore it cannot be excluded that the observed bundles and aggregation are partly due to the drying procedure. Nevertheless, together with the observed increase in I we are confident to conclude that the addition of cross-linkers leads to fiber association, into bundles and at higher concentrations into aggregates.
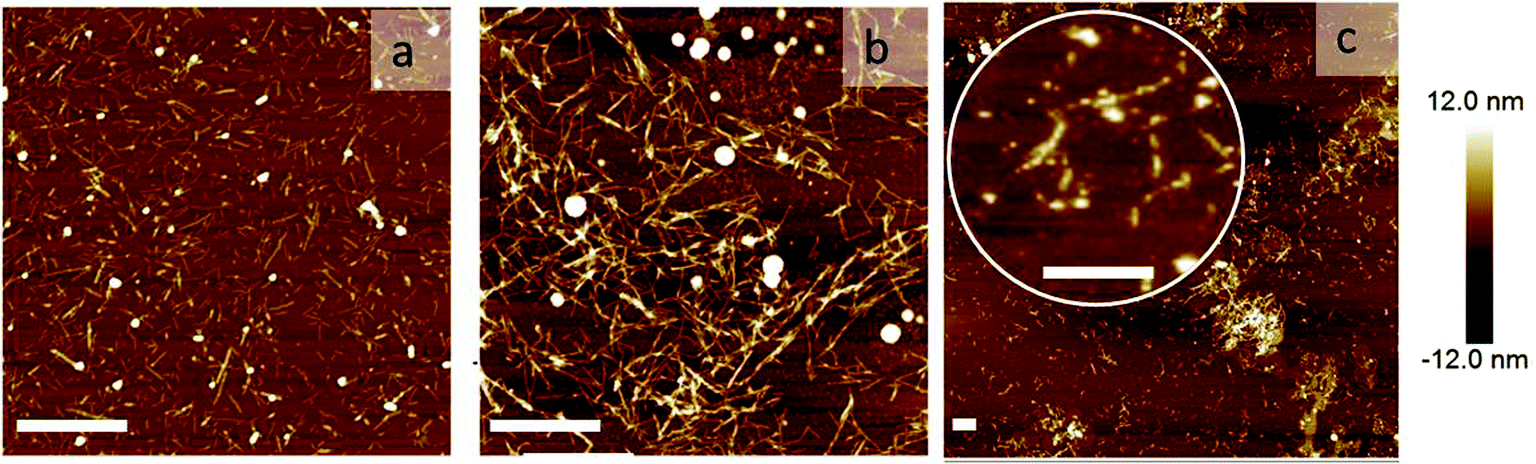 | ||
| Fig. 5 Network morphology: AFM images of the sample: (a) without any cross-linker, (b) with rM = 0.03, and (c) rM = 0.095. The scale bars are 1000 nm. | ||
Formation of bundles is expected to lead to an increase of the average persistence length. We confirm this by measuring the persistence length of fibers while increasing the molar ratio rM. Indeed, LP increases, more or less linearly, with increasing rM (Fig. 4d). This increase of the persistence length gives rise to an increase of the elastic modulus of the systems.15–18
Non-linear elasticity and gel recovery
We investigated the non-linear elasticity of the hydrogel by performing strain-controlled oscillations with increasing strain amplitude from 0.1% to 200% at an angular frequency range between 0.1 and 5 rad s−1. Although, due to limitations in sample quantity, we employed a small parallel plate geometry in which the strain is not constant throughout the sample, we here report the variations of the moduli with increasing strain amplitude to qualitatively assess the nonlinear regime. We show the results in Fig. 6a–c. In all samples there is a linear regime at low strain amplitudes, followed by strain softening at large strain amplitudes. There is no strain hardening at any frequency. This similarity indicates that although adding cross-linker enhances the elasticity, it does not change the origin of the elasticity of the networks.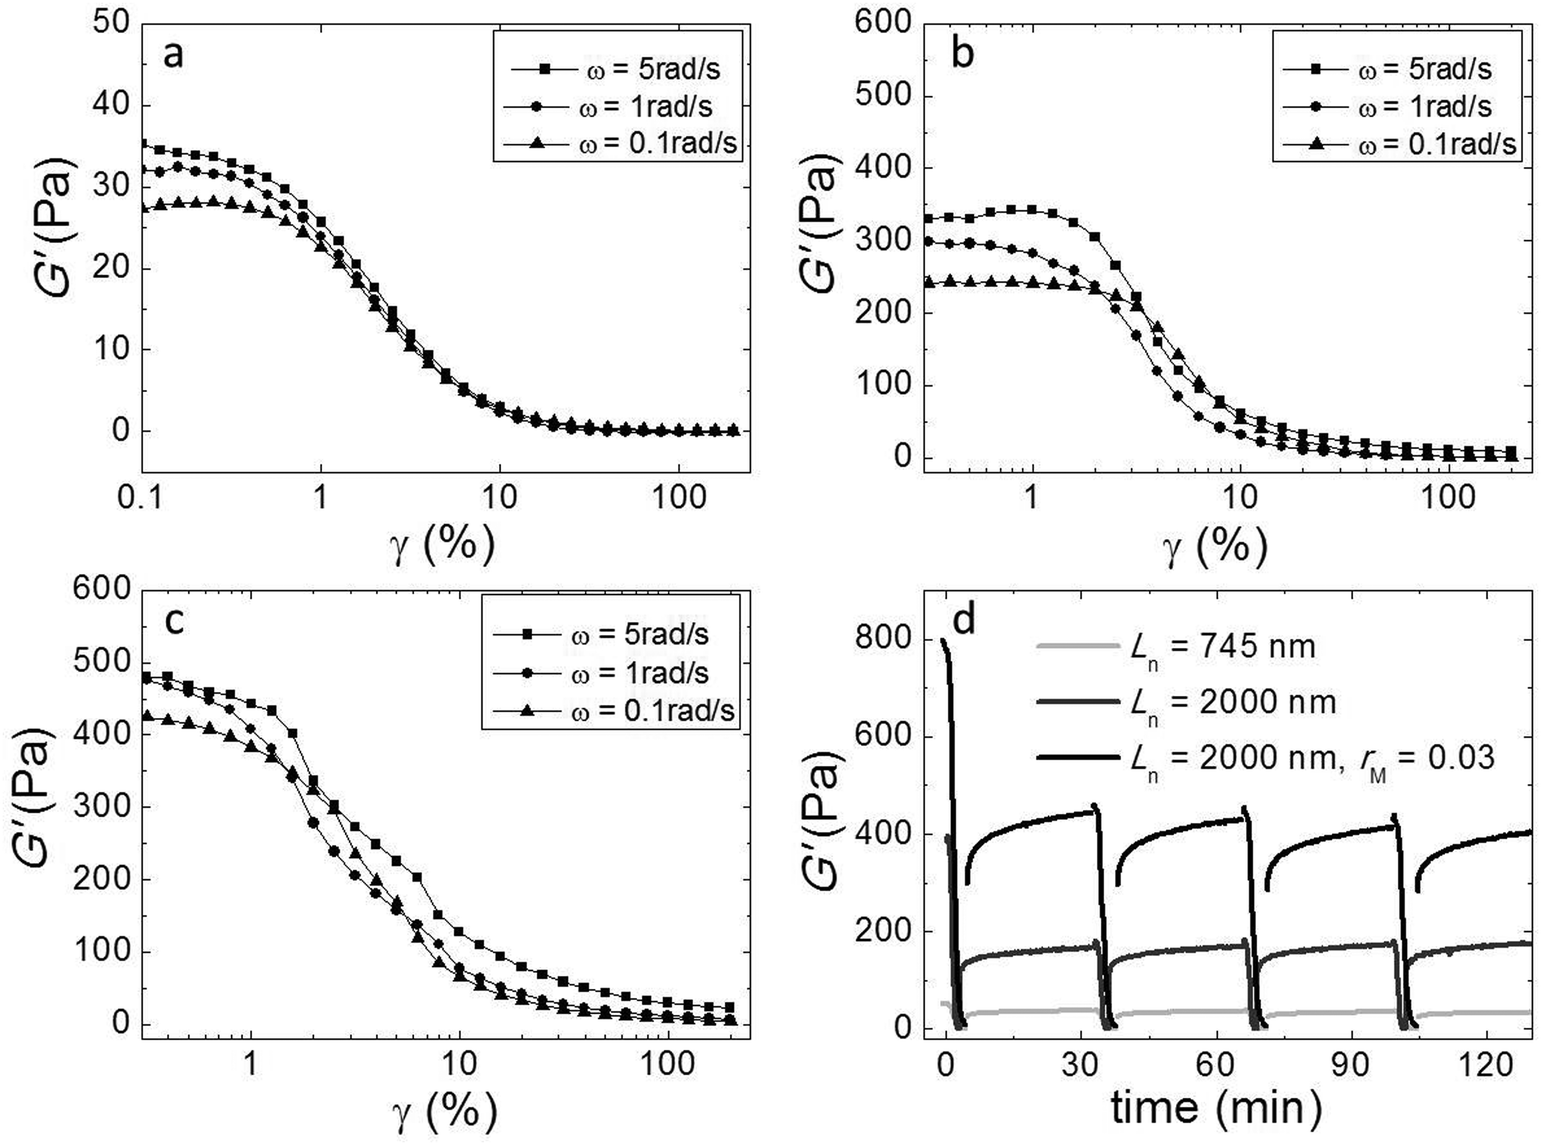 | ||
| Fig. 6 Non-linear elasticity and gel recovery: elastic moduli as a function of the strain amplitude at angular frequencies between 0.1 and 5 rad s−1 of the systems: (a) Ln = 745 nm, (b) Ln = 2000 nm, (c) and Ln = 2000 nm and rM = 0.03. (d) Gel recovery; storage and loss moduli as a function of time after removal of the large shear strain of 200% (d). 4 cycles of recovery of the hydrogel after the shear deformation being removed. Except for the first cycle, all cycles show a full recovery of the hydrogel. | ||
We also investigated the recovery of the gels after shear-induced yielding and disentanglement. First, we apply an oscillatory shear with an amplitude of 200% at an angular frequency of 1 rad s−1, which leads to the yielding of the gel, as evidenced by a strong decrease of the moduli. Then, we monitor the recovery by oscillating at an amplitude of 1%. We observe that, for all samples, G′ recovers partially within 30 minutes, to about 50 percent of the initial modulus (Fig. 5d). Probably, the large deformations lead to both disentanglement and breakage of the fibers. Upon recovery, new entanglements can form, but broken fibers can not heal within this time scale, explaining why only part of the modulus recovers. Interestingly, in subsequent cycles, the gel does recover almost completely within a few minutes after yielding, indicating that no further fiber breakage occurs.
Effect of salt
Since our fibers are charged, we expect the modulus to be affected by electrostatic interactions. Moreover, we have argued that the effect of the triblock copolymers on the fiber gels is due to ionic bonds between the peptides and the oppositely charged blocks of the polymer. If this is true, we must be able to tune the gel strength by varying the salt concentration, because salt screens the electrostatic interactions. We investigated this by adding potassium chloride salt (KCl) to a fiber network without any cross-linker and to a cross-linked fiber network at the optimal molar ratio, rM = 0.03. We measure the elastic modulus as a function of the total salt concentration (cs) and show the results in Fig. 7. Note that, in this experiment, the modulus of the gel network without cross-linker is higher than that of the gel network with cross-linker, because this gel network is formed by long fibers (Ln = 2000 nm), while the other is formed by shorter fibers (Ln = 465 nm). For both samples, we find that the modulus decreases systematically with adding salt. This suggests that the addition of salt reduces the stiffness of the fibers, probably due to screening of the electrostatic repulsion between the lysine groups, which makes it easier for the fibers to bend. In the sample with crosslinker, the decrease appears to be more pronounced. This is probably caused by screening of the electrostatic interaction between the sulfate groups on the polymer and the lysine groups on the fibers, which reduces the binding strength of the crosslinker.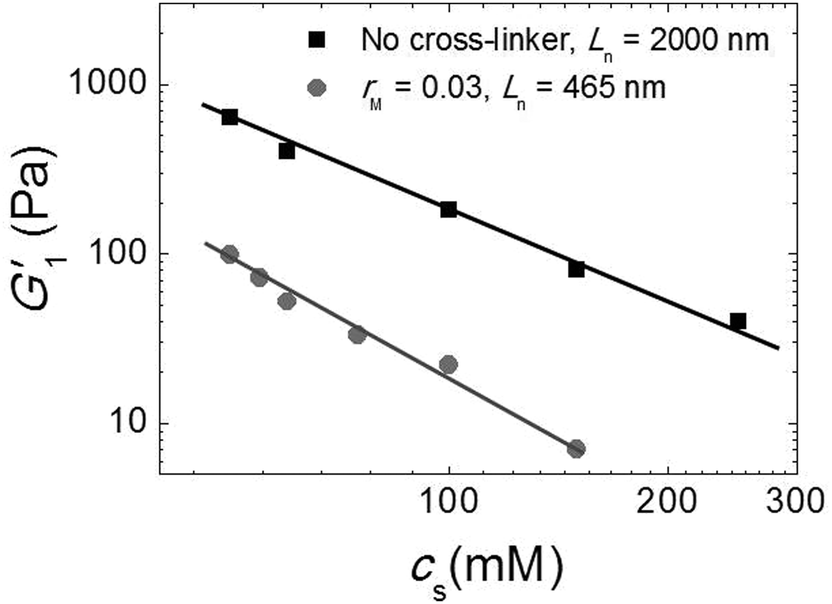 | ||
| Fig. 7 Effect of salt: G1′ vs. (cs) for sample with Ln = 2000 nm and without cross-linker (black squares) and sample with Ln = 465 nm and rM = 0.03 (gray circles). | ||
4 Conclusions
In summary, we have investigated the length dependence of the elasticity of a fiber network by using well-defined fibers with controlled length. Our experimental results are in good agreement with recent theoretical predictions that showed a quadratic increase of the elastic modulus with fiber length in the non-affine deformation regime. We also demonstrated that it was possible to enhance the gel strength by adding triblock copolymers with charged end blocks that interact with the oppositely charged fibers. We found that the modulus has an optimum at the iso-electric point where the negative charges of the triblock copolymer balance the positive charges on the fibers. We show that the increase of the modulus at low amounts of crosslinker is due to bundle formation, leading to an increase of the effective persistence length, while the decrease at large amounts of crosslinker is due to aggregation. Finally, we show that salt lowers the modulus, not only because it weakens the interactions between the triblock copolymer and the fibers, but also because it enhances the intrinsic flexibility of the peptide fibers. Our results thus show how the mechanical properties of fibrous hydrogels can be tuned precisely by varying fiber length and crosslink density. Such control is important for future applications of these hydrogels, for example in biomedical applications.Acknowledgements
This work was supported by NWO through a ChemThem grant from for the priority area of “Out-of-equilibrium self-assembly” and a VICI grant to SO. We are grateful to the European Union (ERC, ITN ReAd), COST Actions CM1304 and the Ministry of Education, Culture and Science (Gravitation program 024.001.035). FS would like to thank Katarzyna Zielinska for her help with the synthesis of the triblock copolymer.References
- A. M. Jonker, D. W. P. M. Loewik and J. C. M. van Hest, Peptide- and protein-based hydrogels, Chem. Mater., 2012, 24, 759 CrossRef CAS.
- J. H. Collier, J. S. Rudra, J. Z. Gasiorowski and J.-W. P. Jung, Multi-component extracellular matrices based on peptide self-assembly, Chem. Soc. Rev., 2010, 39, 3413–3424 RSC.
- Y. Loo, S. Zhang and C. A. E. Hauser, From short peptides to nanofibers to macromolecular assemblies in biomedicine, Biotechnol. Adv., 2012, 30, 593–603 CrossRef CAS PubMed.
- M. Guvendiren, H. D. Lu and J. A. Burdick, Shear-thinning hydrogels for biomedical applications, Soft Matter, 2012, 8, 260–272 RSC.
- K. Ladewig, Drug delivery in soft tissue engineering, Expert Opin. Drug Delivery, 2011, 8, 1175–1188 CrossRef CAS PubMed.
- D. J. Overstreet, D. Dutta, S. E. Stabenfeldt and B. L. Vernon, Injectable hydrogels, J. Polym. Sci., 2012, 50, 881–903 CrossRef CAS.
- S. Ramachandran and Y. B. Yu, Peptide-based viscoelastic matrices for drug delivery and tissue repair, BioDrugs, 2006, 20, 263–269 CrossRef CAS PubMed.
- W. P. M. Lowik Dennis, E. H. P. Leunissen, l. M. van den Heuve, M. B. Hansen and J. C. M. van Hest, Stimulus responsive peptide based materials, Chem. Soc. Rev., 2010, 39, 3394–3412 RSC.
- R. V. Ulijn and A. M. Smith, Designing peptide based nanomaterials, Chem. Soc. Rev., 2008, 37, 664–675 RSC.
- R. J. Williams, R. J. Mart and R. V. Ulijn, Exploiting biocatalysis in peptide self-assembly, Biopolymers, 2010, 94, 107–117 CrossRef CAS PubMed.
- S. Boothroyd, A. F. Miller and A. Saiani, From fibres to networks using self-assembling peptides, Faraday Discuss., 2013, 166, 195 RSC.
- N. L. Fletcher, C. V. Lockett and A. F. Dexter, A ph-responsive coiled-coil peptide hydrogel, Soft Matter, 2011, 7, 10210–10218 RSC.
- C. Tang, R. V. Ulijn and A. Saiani, Effect of glycine substitution on fmoc-diphenylalanine self-assembly and gelation properties, Langmuir, 2011, 27, 14438–14449 CrossRef CAS PubMed.
- A. H. Clark, M. J. Gidley, R. K. Richardson and S. B. Ross-Murphy, Rheological studies of aqueous amylose gels: The effect of chain length and concentration on gel modulus, Macromolecules, 1989, 22, 346–351 CrossRef CAS.
- F. MacKintosh, J. Kas and P. Janmey, Elasticity of semiflexible biopolymer networks, Phys. Rev. Lett., 1995, 75, 4425 CrossRef CAS PubMed.
- C. P. Broedersz, C. Storm and F. MacKintosh, Effective-medium approach for stiff polymer networks with flexible cross-links, Phys. Rev. E: Stat., Nonlinear, Soft Matter Phys., 2009, 79, 061914 CrossRef CAS PubMed.
- C. Storm, J. J. Pastore, F. C. MacKintosh, T. C. Lubensky and P. A. Janmey, Nonlinear elasticity in biological gels, Nature, 2005, 435, 191 CrossRef CAS PubMed.
- M. L. Gardel, J. H. Shin, F. C. MacKintosh, L. Mahadevan, P. Matsudaira and D. A. Weitz, Elastic behavior of cross-linked and bundled actin networks, Science, 2004, 304, 1301–1305 CrossRef CAS PubMed.
- K. E. Kasza, C. P. Broedersz, G. H. Koenderink, Y. C. Lin, W. Messner, E. A. Millman, F. Nakamura, T. P. Stossel, F. C. MacKintosch and D. A. Weitz, Actin filament length tunes elasticity of flexibly cross-linked actin networks, Biophys. J., 2010, 99, 1091–1100 CrossRef CAS PubMed.
- B. Ozbas, J. Kretsinger, K. Rajagopal, J. P. Schneider and D. J. Pochan, Salt-triggered peptide folding and consequent self-assembly into hydrogels with tunable modulus, Macromolecules, 2004, 37, 7331–7337 CrossRef CAS.
- P. Jana, S. Maity, S. K. Maity, P. K. Ghorai and D. Haldar, Photo-induced charge-transfer complex formation and organogelation by a tripeptide, Soft Matter, 2012, 8, 5621–5628 RSC.
- Z. Huang, H. Lee, E. Lee, S. K. Kang, M. Nam and J. M. Lee, Responsive nematic gels from the self-assembly of aqueous nanofibres, Nat. Commun., 2011, 2 CrossRef.
- A. Maslovskis, N. Tirelli, A. Saiani and A. F. Miller, Peptide-pnipaam conjugate based hydrogels: synthesis and characterisation, Soft Matter, 2011, 7, 6025–6033 RSC.
- J.-B. Guilbaud, E. Vey, S. Boothroyd, A. M. Smith, R. V. Ulijn, A. Saiani and A. F. Miller, Enzymatic catalyzed synthesis and triggered gelation of ionic peptides, Langmuir, 2010, 26, 11297–11303 CrossRef CAS PubMed.
- S. C. Bremmer, J. Chen, A. J. McNeil and M. B. Soellner, A general method for detecting protease activity via gelation and its application to artificial clotting, Chem. Commun., 2012, 48, 5482–5484 RSC.
- D. A. Head, A. J. Levine and F. C. MacKintosh, Deformation of cross-linked semiflexible polymer networks, Phys. Rev. Lett., 2003, 91, 108102 CrossRef PubMed.
- J. Wilhelm and E. Frey, Elasticity of stiff polymer networks, Phys. Rev. Lett., 2003, 91, 108103 CrossRef PubMed.
- C. Heussinger and E. Frey, Floppy modes and nonaffine deformations in random fiber networks, Phys. Rev. Lett., 2006, 97, 105501 CrossRef PubMed.
- M. Das, F. C. MacKintosh and A. J. Levine, Effective medium theory of semiflexible filamentous networks, Phys. Rev. Lett., 2007, 99, 038101 CrossRef PubMed.
- Q. Wen, A. Basu, P. A. Janmey and A. G. Yodh, Non-affine deformations in polymer hydrogels, Soft Matter, 2012, 8, 8039–8049 RSC.
- M. Atakhorrami, G. Koenderink, J. Palierne, F. MacKintosh and C. Schmidt, Scale-dependent nonaffine elasticity of semiflexible polymer networks, Phys. Rev. Lett., 2014, 112, 088101 CrossRef.
- C. P. Broedersz, M. Sheinman and F. MacKintosh, Filament-length-controlled elasticity in 3d fiber networks, Phys. Rev. Lett., 2012, 108, 078102 CrossRef CAS.
- E. M. Huisman, T. van Dillen, P. R. Onck and E. V. der Giessen, Three-dimensional cross-linked f-actin networks: Relation between network architecture and mechanical behavior, Phys. Rev. Lett., 2007, 99, 20813 CrossRef PubMed.
- T. D. Pollard and J. A. Cooper, Actin and actin-binding proteins: a critical evaluation of mechanisms and functions, Annu. Rev. Biochem., 1986, 55, 987–1035 CrossRef CAS PubMed.
- T. Kreis and R. Vale, Cytoskeletal and Motor Proteins, Oxford University Press, NY 10016, US, 2nd edn, 1999 Search PubMed.
- J. M. A. Carnall, C. A. Waudby, A. M. Belenguer, M. C. A. Stuart, J. J. P. Peyralans and S. Otto, Mechanosensitive self-replication driven by self-organization, Science, 2010, 327, 1502 CrossRef CAS PubMed.
- A. Pal, M. Malakoutikhah, G. Leonetti, M. Tezcan, M. Colomb-Delsuc, V. D. Nguyen, J. van der Gucht and S. Otto, Controlling the structure and length of self-synthesizing supramolecular polymers through nucleated growth and disassembly, Angew. Chem., Int. Ed., 2015, 54, 7852–7856 CrossRef CAS PubMed.
- T. F. A. D. Greef, M. M. J. Smulders, M. Wolffs, A. P. H. J. Schenning, R. P. Sijbesma and E. W. Meijer, Supramolecular polymerization, Chem. Rev., 2009, 109, 5687–5754 CrossRef PubMed.
- J. S. Wang and K. Matyjaszewski, Controlled living radical polymerization. atom transfer radical polymerization in the presence of transition-metal complexes, J. Am. Chem. Soc., 1995, 117, 5614–5615 CrossRef CAS.
- M. Lemmers, J. Sprakel, I. K. Voets, J. van der Gucht and M. A. Cohen Stuart, Multireseponsive reversible gels based on charge-driven assembly, Angew. Chem., 2010, 49, 708–711 CrossRef CAS PubMed.
- K. Schatzel and J. Merz, Measurement of small electrophoretic mobilites by light scattering and analysis of the amplitude weighted phase structure function, J. Chem. Phys., 1984, 81, 2482–2488 CrossRef.
- M. Born and E. Wolf, Principles of Optics, Cambridge University Press, Cambridge CB2 2RU, UK, 1999 Search PubMed.
- B. Berne and R. Pecora, Dynamic Light Scattering, Dover, Mineola NY, US, 2000 Search PubMed.
- J. Corbett, R. Lee and R. Jack, Surface zeta potential of soft, high value and fragile surfaces, Malvern Instruments Ltd, Malvern, Worcestershire, UK, 2015 Search PubMed.
- L. Landau and E. Lifshitz, Theory of Elasticity, Pergamon Press, Oxford, 1986 Search PubMed.
- F. Gittes, B. Mickey, J. Nettleton and J. Howard, Flexural rigidity of microtubules and actin filaments measured from thermal fluctuations in shape, J. Cell Biol., 1993, 120, 923–934 CrossRef CAS PubMed.
- H. Isambert, P. Venier, A. Maggs, A. Fattoum, R. Kassab, D. Pantaloni and M. Carlier, Flexibility of actin filaments derived from thermal fluctuations. effect of bound nucleotide, phalloidin and muscle regulatory proteins, Langmuir, 1995, 270, 11437 CAS.
Footnote |
| † Electronic supplementary information (ESI) available. See DOI: 10.1039/c5sm02088c |
| This journal is © The Royal Society of Chemistry 2016 |