 Open Access Article
Creative Commons Attribution 3.0 Unported Licence
Celebrating Soft Matter's 10th Anniversary: Simplicity in complexity – towards a soft matter physics of caramel†
Simon
Weir
,
Keith M.
Bromley
,
Alex
Lips
and
Wilson C. K.
Poon
*
SUPA and School of Physics & Astronomy, The University of Edinburgh, JCMB, Peter Guthrie Tait Road, Edinburgh EH9 3FD, UK. E-mail: w.poon@ed.ac.uk
First published on 22nd January 2016
Abstract
Caramel is a mixture of sugars, milk proteins, fat and water cooked at high temperatures to initiate Maillard reactions. We study caramels as ‘active emulsion-filled protein gels’, in which fat droplets are chemically-bonded to a background gel matrix of cross-linked proteins in a concentrated aqueous sugar solution. We delimit a ‘caramel region’ in composition space. Oscillatory rheology within this region reveals that we can superpose the mechanical spectra of our caramels onto a single pair of G′(ω), G′′(ω) master curves using time–composition superposition (tCS) over 12 decades of frequency, so that these caramels are instances of an underlying ‘universal material’. This insight constrains the molecular mechanisms for structure formation, and implies that measuring a couple of parameters will suffice to predict the rheology of our caramels over 12 orders of magnitude in frequency.
1 Introduction
Long before this journal was founded, a major review drew attention to food as soft matter.1 When this journal was five, it published an internet theme issue on food. One of the two reviews in that issue2 says that ‘[a]n increasing number of food physicists now recognize the potential of soft condensed matter physics to understand… food structure.’ Viewing food ‘as soft matter with some universality at the level of its structure’ is sometimes known as ‘molecular gastronomy’.2‘Foods… possess an enormous amount of complexity.’3 so that most soft matter studies focus on one or two ingredients. Thus, the 2008–2009 theme issue dealt with β-lactoglobulin aggregation4 and protein–polysaccharide interactions in emulsions.5 One article only treated an entire food product: the effect of fat crystals on chocolate microstructure.6
Caramel is a widely-used confectionary product, perhaps second only to chocolate, but in terms of scientific scrutiny, it is the Cinderella material. Searching for ‘chocolate’ in the Web of Science returned well over 34![[thin space (1/6-em)]](https://www.rsc.org/images/entities/char_2009.gif) 000 records, while ‘caramel’ returned barely 5000, probably because chocolate is, in essence, a simpler material. Molten chocolate is basically a suspension of sucrose grains in oil.7 By contrast, caramel8 is irreducibly a mixture of sugars, proteins, fat and water structured at high temperatures (ca. 120 °C).
000 records, while ‘caramel’ returned barely 5000, probably because chocolate is, in essence, a simpler material. Molten chocolate is basically a suspension of sucrose grains in oil.7 By contrast, caramel8 is irreducibly a mixture of sugars, proteins, fat and water structured at high temperatures (ca. 120 °C).
Given these complexities, it may be thought that a coarse-grained ‘soft matter approach’ may have little to contribute. However, in this work, we offer a case study of how judiciously-designed experiments coupled with the right questions asked of the data may nevertheless enable progress to be made.3 We start from a recipe for a ‘standard model caramel’, and first enquire how much the composition could be varied for the material to still remain caramel-like. Performing rheology on the set of caramels so obtained then leads to the emergence of a surprisingly simple, coarse-grained picture, which sets constraints on possible molecular mechanisms.
2 Caramel: a soft-matter hypothesis
Caramel is made by cooking different proportions8 of sugars, milk proteins, vegetable fat and water at T ∼ 120 °C. Most of the sugar is from glucose (or ‘corn’) syrup, which is a mixture of glucose and its oligomers. The milk proteins9 are mostly caseins or whey. Native casein occurs as micelles,10 while β-lactoglobulin (BLG) is the main component of whey. Fat is typically solid at room temperature. There are few, if any, scientific reports on the bulk structure of caramel (although caramel surfaces have been imaged11); but very general considerations of the ingredients and their interactions suffice for formulating a starting hypothesis.It is known that at T ≳ 60 °C, milk proteins start to denature and aggregate via exposed hydrophobic groups and/or thiol/disulphide exchange reactions,12 although processes at T ≳ 120 °C are less studied.13 Sugars typically stabilise proteins against heat denaturation,14 though some claim the opposite.15 At T ∼ 120 °C, Maillard reactions16 give rise to sugar-mediated protein cross-linking. Separately, milk proteins are known to stabilise oil (= molten fat) droplets.17
This information, though incomplete, suggests that caramel is a dispersion of protein-stabilised fat droplets in a protein gel whose solvent is a concentrated aqueous sugar solution. Two distinct types of such ‘emulsion-filled protein gels’18 exist, depending on whether the ‘filler’ droplets or particles are chemically bonded to the gel network (‘active’) or not (‘inactive’). An active filler strengthens the gel, while a passive one weakens it.19 Whey proteins, which presumably are the main emulsifier of the fat,17 can cross-link with caseins, which is the major protein in our work. Thus, we hypothesise that caramel is an active emulsion-filled protein gel.
3 Materials and methods
To synthesise our ‘standard model caramel’ (SMC), we began by preparing 200 g of a ‘premix’ consisting of 39.4% glucose syrup (dry weight, available from Tate & Lyle), 0.5% table salt, 13.9% palm derivative (available from Archer Daniels Midland Company), 22.7% water, 2.96% micellar casein (courtesy of Prof. György Babella, Hungarian Dairy Research Institute), 0.74% whey protein isolate (WPI, BioPro), and 19.7% sucrose (Silverspoon).‡ First the sucrose, milk proteins and water were combined to form a sweetened condensed skim milk (SCSM) then the remaining ingredients were added and emulsified.This ‘premix’ was heated to and held at 90 °C for 10 min, and then heated to and held at 120 °C until 23 g of water had been boiled off. Finally, the caramel was poured onto greaseproof paper, cooled for ≈10 min and then stored in a sealed Petri dish in a humidity chamber. This protocol produced a caramel with 15.7% oil and 84.3% continuous phase; the latter is made up of 80% sugar, 5% protein and 15% water. We explored the composition space by varying the proportions of these ingredients and the boiling off time.
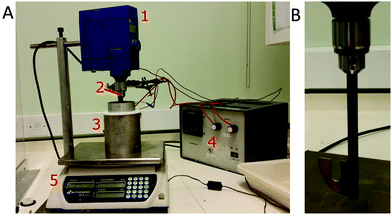
Constant scraping and stirring were needed during cooking to prevent sticking and ensure homogenisation. We constructed a bespoke equipment to do this reproducibly, Fig. 1. A 500 ml cylindrical cooking vessel (height 14.5 cm) is tightly fitted within an aluminium jacket with embedded heating resistors. Heating is controlled by a programmable three-term (proportional–integral–differential, PID) controller via a thermocouple in the jacket. A second thermocouple in the cooking vessel monitors the caramel. An overhead mixer actuates a blade shaped to scrape the edges of the cooking vessel (gap ≈ 3 mm) and notched to fit the second thermocouple. The drop in viscosity at 90 °C allows us to increase the initial stirring rate of 50 rpm to 250 rpm for the final stage of the boil off, which is monitored by placing the apparatus on a balance.
Rheology was performed on a TA-DHR-2 hybrid rheometer. A smooth, truncated cone-plate geometry (40 mm radius, 1°) was used to study syrup–sucrose solutions, while 40 mm radius hatched plates (1 mm gap) were used for caramels to reduce slip. Temperature was held at 20 °C using a Peltier element and equilibrated for 10 min before measurements. For each experiment, ≈2 g of caramel was squeezed between the plates and the excess trimmed from the edge before fitting a solvent trap to minimise evaporation. We measured the storage and loss moduli, G′(ω) and G′′(ω), of caramel using small-amplitude oscillatory shear (SAOS) rheology in the frequency range f = ω/2π = 0.01 to 100 Hz. Strain sweeps indicated that linearity fails between 1 and 8% strain amplitude, depending on the sugar![[thin space (1/6-em)]](https://www.rsc.org/images/entities/char_2009.gif) :
:![[thin space (1/6-em)]](https://www.rsc.org/images/entities/char_2009.gif) water ratio; our frequency sweeps were all performed at a strain amplitude of 0.1%.
water ratio; our frequency sweeps were all performed at a strain amplitude of 0.1%.
4 Roaming composition space
Four classes of ingredients make up caramel: sugars, water, oil§ and proteins. In our recipe, the composition is further tuneable by varying the syrup to sucrose and the WPI to casein ratios. Different compositions in this 6-dimensional ‘space’ suit different applications.8 The interesting question arises: is there a well-defined ‘caramel region’ in this space?4.1 Delimiting the ‘caramel region’
Exploring the full 6-dimensional (6D) space is impractical. We therefore keep the (syrup![[thin space (1/6-em)]](https://www.rsc.org/images/entities/char_2009.gif) :
:![[thin space (1/6-em)]](https://www.rsc.org/images/entities/char_2009.gif) sucrose) and (WPI
sucrose) and (WPI![[thin space (1/6-em)]](https://www.rsc.org/images/entities/char_2009.gif) :
:![[thin space (1/6-em)]](https://www.rsc.org/images/entities/char_2009.gif) casein) ratios constant at the values in SMC to give a 4D composition space, where each composition is representable as a point inside a tetrahedron, Fig. 2. We further restrict ourselves almost exclusively to a single ‘cut’ in this tetrahedron at the oil fraction of SMC, giving a triangular composition space, Fig. 2. ‘Roaming’ this ‘SMC-triangle’ corresponds to changing the composition of the continuous phase in which a constant weight fraction of fat droplets is dispersed.
casein) ratios constant at the values in SMC to give a 4D composition space, where each composition is representable as a point inside a tetrahedron, Fig. 2. We further restrict ourselves almost exclusively to a single ‘cut’ in this tetrahedron at the oil fraction of SMC, giving a triangular composition space, Fig. 2. ‘Roaming’ this ‘SMC-triangle’ corresponds to changing the composition of the continuous phase in which a constant weight fraction of fat droplets is dispersed.
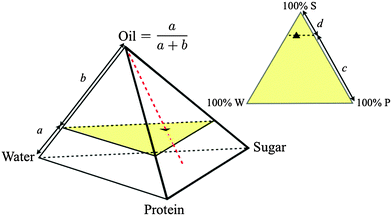 | ||
| Fig. 2 Quaternary composition space of caramel (regular tetrahedron, oil fraction = a/(a + b)) and ternary composition space of the continuous phase at a fixed oil fraction (equilateral triangle, sugar fraction = c/(c + d)), with ▲ = SMC. Samples along the red dashed line have different oil fractions but invariant continuous phase composition. The yellow triangle is the slice of composition space shown in Fig. 3. | ||
We measured a few samples along the dashed red line in the tetrahedron in Fig. 2, changing the oil fraction but keeping the continuous phase composition constant. We failed to make caramel at 0% fat: the premix frothed into a protein-stabilised foam, suggesting that oil plays an anti-foaming role. Thereafter, increasing the oil fraction leads to stronger caramels (Fig. S1, ESI†). We infer that the fat droplets are bonded to the matrix and act as ‘active fillers’.18
We do not further investigate the variable oil content, but keep it constant at that of SMC, viz., 15.7%. Instead, we vary the proportions of sugar, protein and water in the continuous phase. We find that materials with the organoleptic properties of caramel could be made inside a well-defined diamond-shaped region in the SMC-triangle (orange and blue in Fig. 3).
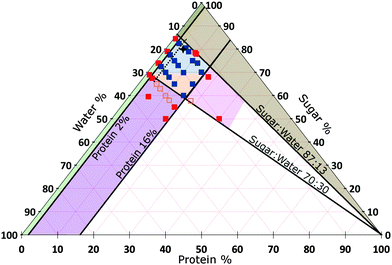 | ||
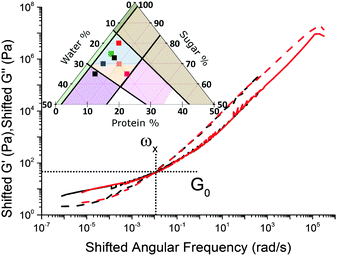
| Fig. 3 Composition space of the continuous phase of caramel at 15.7% oil (triangular slice in Fig. 2). A selection of samples for which we have measured the rheology are shown as points, amongst which red = denote failed caramels, orange = a non-standard cook and blue = a standard cook. The percentages refer to the continuous phase only and add up to 100% for any point. The star refers to standard model caramel (SMC). Areas: Blue = caramels with G′ < G′′, Orange = caramels with G′ > G′′, both at 1 Hz and 0.1% strain amplitude. Other colours represent various types of ‘caramel failure’. Green = emulsification failure. Brown = transition to toffee texture. Pink = over-frothing. Purple = aggregate formation; deep inside this region, the caramel boils over during cooking and therefore cannot be made (the red points). The oscillatory rheology of all samples within the diamond-shaped blue-orange ‘caramel region’ obey time–composition superposition (tCS), Section 5.3, except those to the left of the black dashed line. | ||
4.2 The physics of caramel failure
The boundaries of the caramel region fall into two pairs, Fig. 3: two are constant–protein lines (at ≈2% and 16%), and two extrapolate to the 100% protein corner, and are therefore constant (sugar![[thin space (1/6-em)]](https://www.rsc.org/images/entities/char_2009.gif) :
:![[thin space (1/6-em)]](https://www.rsc.org/images/entities/char_2009.gif) water) ratio lines (at 87
water) ratio lines (at 87![[thin space (1/6-em)]](https://www.rsc.org/images/entities/char_2009.gif) :
:![[thin space (1/6-em)]](https://www.rsc.org/images/entities/char_2009.gif) 13 and 70
13 and 70![[thin space (1/6-em)]](https://www.rsc.org/images/entities/char_2009.gif) :
:![[thin space (1/6-em)]](https://www.rsc.org/images/entities/char_2009.gif) 30). Crossing these boundaries leads to different ‘failure modes’.
30). Crossing these boundaries leads to different ‘failure modes’.
![[thin space (1/6-em)]](https://www.rsc.org/images/entities/char_2009.gif) :
:![[thin space (1/6-em)]](https://www.rsc.org/images/entities/char_2009.gif) 13 constant (sugar
13 constant (sugar![[thin space (1/6-em)]](https://www.rsc.org/images/entities/char_2009.gif) :
:![[thin space (1/6-em)]](https://www.rsc.org/images/entities/char_2009.gif) water) line into the brown region, we obtained brittle, toffee-like samples. Operationally, it was difficult to dissolve enough sucrose to make the relevant sweetened condensed milk at 50 °C. We suggest that the proximity of the vitrification, which occurs at ≳90% sugar in aqueous sucrose solution,21 accounts for the transition to toffee.
water) line into the brown region, we obtained brittle, toffee-like samples. Operationally, it was difficult to dissolve enough sucrose to make the relevant sweetened condensed milk at 50 °C. We suggest that the proximity of the vitrification, which occurs at ≳90% sugar in aqueous sucrose solution,21 accounts for the transition to toffee.
![[thin space (1/6-em)]](https://www.rsc.org/images/entities/char_2009.gif) :
:![[thin space (1/6-em)]](https://www.rsc.org/images/entities/char_2009.gif) 30 constant (sugar
30 constant (sugar![[thin space (1/6-em)]](https://www.rsc.org/images/entities/char_2009.gif) :
:![[thin space (1/6-em)]](https://www.rsc.org/images/entities/char_2009.gif) water) line into the purple region, we found that aggregates form at the top of the heated premix, although caramel making is still possible just inside this region. Deeper into the region, coagulated aggregates completely covered the liquid surface and the mixture boiled over rapidly, halting caramel production. This suggests that our protein mixture is less stable against aggregation at lower sugar content, consistent with the majority of the literature.14 Moreover, less sugar means lower boiling point22 and viscosity,21 increasing the risk of boil over. These effects together account for our observations at this boundary.
water) line into the purple region, we found that aggregates form at the top of the heated premix, although caramel making is still possible just inside this region. Deeper into the region, coagulated aggregates completely covered the liquid surface and the mixture boiled over rapidly, halting caramel production. This suggests that our protein mixture is less stable against aggregation at lower sugar content, consistent with the majority of the literature.14 Moreover, less sugar means lower boiling point22 and viscosity,21 increasing the risk of boil over. These effects together account for our observations at this boundary.
5 Caramel rheology: results
Caramel rheology is relevant for the applied scientist and the consumer. Previous studies23–25 neither explored composition space systematically nor derived structural data from rheometry. We measure G′(ω) and G′′(ω) throughout the caramel region and beyond, and interpret our results in terms of polymer physics.5.1 Standard model caramel
In our accessible frequency range, 0.01 Hz < f < 100 Hz (or 0.63 rad s−1 ≲ ω ≲ 630 rad s−1), SMC is a viscoelastic liquid, Fig. 4(b), with loss tangent tan![[thin space (1/6-em)]](https://www.rsc.org/images/entities/char_2009.gif) δ = G′′/G′ = 3.4. The data are consistent with
δ = G′′/G′ = 3.4. The data are consistent with| G′′(ω) ∼ G′(ω) ∼ ωΔ, | (1) |
 . This exponent relates to how the viscosity diverges and elasticity emerges below and above the percolation threshold.26–28 Consistency requires29
| G′′/G′ = tan(πΔ/2), | (2) |
We next characterised a series of samples, shown as points in Fig. 4(a), in which the protein fraction remains that of SMC, but with decreasing (sugar![[thin space (1/6-em)]](https://www.rsc.org/images/entities/char_2009.gif) :
:![[thin space (1/6-em)]](https://www.rsc.org/images/entities/char_2009.gif) water) ratio. As the water content rises, Fig. 4(b), both moduli drop, but G′/G′′ rises, until the last caramel in this series becomes a viscoelastic solid (G′ > G′′) at f = 1 Hz. This transition (at f = 1 Hz) from liquid-like (blue, Fig. 3) to solid-like (orange, Fig. 3) occurs along other sequences of samples in the caramel region.
water) ratio. As the water content rises, Fig. 4(b), both moduli drop, but G′/G′′ rises, until the last caramel in this series becomes a viscoelastic solid (G′ > G′′) at f = 1 Hz. This transition (at f = 1 Hz) from liquid-like (blue, Fig. 3) to solid-like (orange, Fig. 3) occurs along other sequences of samples in the caramel region.
5.2 Rheological superposition: an overview
The evolution of viscoelastic spectra with composition, Fig. 4(b), is reminiscent of the effect of temperature, T, on polymeric viscoelastic spectra, where time–temperature superposition (tTS) often applies.30 This means that log![[thin space (1/6-em)]](https://www.rsc.org/images/entities/char_2009.gif) G′(ω) and log
G′(ω) and log![[thin space (1/6-em)]](https://www.rsc.org/images/entities/char_2009.gif) G′′(ω) over the full log
G′′(ω) over the full log![[thin space (1/6-em)]](https://www.rsc.org/images/entities/char_2009.gif) ω range do not change shape when T changes, but only shift along the log
ω range do not change shape when T changes, but only shift along the log![[thin space (1/6-em)]](https://www.rsc.org/images/entities/char_2009.gif) ω axis. Thus, T ‘tunes’ a single ‘master clock’ for all relaxation modes in the system (a T-dependent friction), and different modes can be brought into the experimentally-accessible time (or, equivalently, ω) window by changing T. Alternatively, spectra obtained over a limited ω range at different T can be shifted relative to each other along the log
ω axis. Thus, T ‘tunes’ a single ‘master clock’ for all relaxation modes in the system (a T-dependent friction), and different modes can be brought into the experimentally-accessible time (or, equivalently, ω) window by changing T. Alternatively, spectra obtained over a limited ω range at different T can be shifted relative to each other along the log![[thin space (1/6-em)]](https://www.rsc.org/images/entities/char_2009.gif) ω axis and ‘glued’ together to give ‘master curves’ for G′(ω) and G′′(ω) over many decades of ω (Fig. S2, ESI,† shows schematically how this is done in the simplest case.). Only a small number of ‘canonical’ shapes of master curves exist.31
ω axis and ‘glued’ together to give ‘master curves’ for G′(ω) and G′′(ω) over many decades of ω (Fig. S2, ESI,† shows schematically how this is done in the simplest case.). Only a small number of ‘canonical’ shapes of master curves exist.31
In systems being ‘cured’ towards gelation by gradual cross-linking, time–cure superposition (tQS) applies.27,28 The spectra of different curing times are shifted both horizontally (along log![[thin space (1/6-em)]](https://www.rsc.org/images/entities/char_2009.gif) ω) and vertically (along log
ω) and vertically (along log![[thin space (1/6-em)]](https://www.rsc.org/images/entities/char_2009.gif) G) to obtain master curves. If tQS works, then curing time ‘tunes’ two interrelated variables, a time scale, via the viscosity, and an elasticity scale, via proximity to percolation.27 (Recall that viscosity and modulus both diverge at percolation.26)
G) to obtain master curves. If tQS works, then curing time ‘tunes’ two interrelated variables, a time scale, via the viscosity, and an elasticity scale, via proximity to percolation.27 (Recall that viscosity and modulus both diverge at percolation.26)
5.3 Time–composition superposition for caramel
Caramels obey tCS. Consider the sequence of constant–protein–content samples in Fig. 4(a) (red = SMC) and their G′(ω) and G′′(ω) spectra, Fig. 4(b). We shift the data for the three green, blue, and black samples along the frequency and moduli axes relative to the SMC data (red) to obtain the ‘master curves’ of SMC over 9 decades of ω, Fig. 4(c). Doing the same to the data for the second sample in the sequence (green, Fig. 4(a and b)) gives its master curves, Fig. 4(d), which are identical to those of SMC, Fig. 4(c), but with rescaled axes.We now show that the same master curves are obtained for a reference sample irrespective of the compositions of the other samples used to perform tCS. Fig. 5 (inset) shows the same sequence of constant–protein–content samples as Fig. 4(a) (with the same colour scheme), but also a sequence of constant–water–content samples that overlap with the first sequence in a common, reference sample (green). The master curves for this reference sample already obtained by shifting spectra along the sequence constant–protein–content, Fig. 4(d), are replotted in Fig. 5 as the red curves. The master curves for the same reference sample obtained by shifting spectra along the sequence constant–water–content (Fig. S3, ESI†) are plotted as the black curves in Fig. 5. The red and black plots are therefore the results of two different tCS routes to the master curves of the reference sample (green in the inset) over 11 decades of ω, and they overlap. Note that the limited number of samples we made with varying fat content, Section 4.1, can also be analysed by tCS to produce a master curve that agrees with that in Fig. 5 (data not shown).
A comparison of Fig. 5 with the master curve categories given by Ferry31 shows that caramel behaves as a ‘very lightly cross-linked amorphous polymer’. We show Ferry's exemplar, a vulcanised rubber, in Fig. 6. Thus, caramels are ‘filled rubbers’ (with fat droplets as fillers).
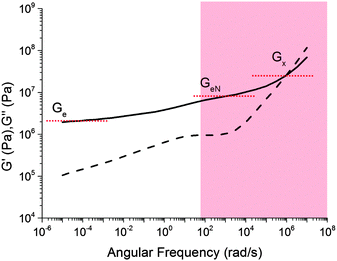 | ||
| Fig. 6 Ferry's ‘type VII’ master curves for a ‘very lightly cross-linked amorphous polymer’, here a vulcanised styrene–butadiene random copolymer. The shaded part corresponds to the caramel master curves in Fig. 5. Solid lines: G′, dashed lines: G′′. | ||
We find that all other sample sequences in the caramel region in Fig. 2 give master curves of identical form (e.g., Fig. S4 in ESI†), except for the samples to the left of the (dashed) 4 ± 1% protein line in Fig. 3 (for which see Section 6.3). With this exception, then, all caramels are instances of a single ‘universal material’ with rheology given in Fig. 5. To find the rheology of any particular caramel, we simply rescale the two axes using numerical factors given by eqn (4) and (7).
We note that tCS also holds for colloidal gels formed by carbon black particles,32 where master G′(ω) and G′′(ω) curves are obtained by shifting data for samples with different particle and dispersant concentrations. A key difference with caramel, due to the different nature of gelation, will be pointed out below.
5.4 Time–cure superposition for caramel
We also carried out a limited number of experiments in which we fixed the composition but varied the curing time. Instead of boiling off water at 120 °C from an initial mixture that is more dilute than the target final composition, we prepared mixtures at the target final compositions sealed in 5 ml glass vials and cooked in an oil bath at 90 °C for variable periods of time. The data, Fig. 7(a), can be put into a master-curve form using time–cure superposition, Fig. 7(b). The implication is that it is neither composition (previous section) nor cooking time (this section) per se that is important, but the extent of cross-linking, which can be tuned by composition, or curing time, or a combination of both. However, since we have most data on tCS, the rest of our discussion will be based on composition.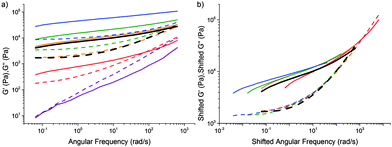 | ||
| Fig. 7 (a) The viscoelastic spectra of caramel with a fixed composition cooked in a sealed tube at 90 °C in an oil bath for varying lengths of time. (b) Time–cure superposition (tQS) using the data in (a) and the orange curve (2 h of cooking) as reference. In both parts, the rheology of a mixture cooked in the conventional way to the same final composition as the sealed mixture is shown in black. Solid lines: G′, dashed lines: G′′. Composition: 7% P, 30% W, and 63% S. Time cooked: purple 0 h, red 1 h, orange 2 h, green 3 h, and blue 7 h. Also see Fig. S5 (ESI†). | ||
6 Caramel rheology: emergence of simplicity
6.1 The physical significance of tCS
In tCS, high or low frequency modes are brought into the experimental window by ‘tuning’ the composition. This can happen in two ways. First, ‘tuning’ the composition and therefore the viscosity of the solvent of a polymeric system accesses different time scales.33 For us, since the background sugar solution (70–87% sugar) is close to its glass transition,21 we expect that viscosity is mainly ‘tuned’ by the (sugar![[thin space (1/6-em)]](https://www.rsc.org/images/entities/char_2009.gif) :
:![[thin space (1/6-em)]](https://www.rsc.org/images/entities/char_2009.gif) water) ratio.
water) ratio.
The second effect relates to tQS, where the extent of reaction determines connectivity, which controls elasticity. Thus, tQS in general involves not only rescaling time, but also moduli. We cook our caramels for approximately the same time, so that curing time is also approximately constant.¶ Instead, we tune the connectivity by composition, e.g., higher sugar content stabilises our proteins, so that the same curing time achieves a lower degree of reaction and therefore connectivity.
Thus, as we roam composition space, we are in fact tuning only two ‘master parameters’, viscosity and connectivity. We now explore how viscosity and connectivity act together to produce the observed tCS in caramels. To do so, we propose to use the crossover point in the master curves, (ω×, G×), Fig. 5, to characterise the shifting time and moduli scales in tCS.
6.2 Viscosity and time
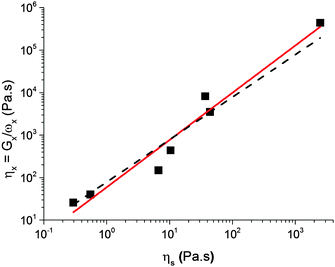
The characteristic viscosity of a caramel can be estimated using| η× = G×ω×−1. | (3) |
| η× = ηs0ηβs, | (4) |
6.3 Connectivity and elasticity
Three moduli characterise a cross-linked amorphous polymer: Ge, GeN and G×, Fig. 6. The equilibrium or rubber plateau modulus, Ge, is controlled by the density of (permanent) chemical cross-links, which is directly related to the ‘effective molecular weight’, Meff, of the polymeric strands between cross-linking points:30 | (5) |
We find that G× weakens with increasing (sugar![[thin space (1/6-em)]](https://www.rsc.org/images/entities/char_2009.gif) :
:![[thin space (1/6-em)]](https://www.rsc.org/images/entities/char_2009.gif) water) ratio ws at a fixed protein concentration, Fig. 9. The small range of ws encompassing the caramel region does not permit definitive identification of the functional form of this dependence, but our data are consistent with an exponential decrease of a pre-factor dependent on the protein concentration, wp.
water) ratio ws at a fixed protein concentration, Fig. 9. The small range of ws encompassing the caramel region does not permit definitive identification of the functional form of this dependence, but our data are consistent with an exponential decrease of a pre-factor dependent on the protein concentration, wp.
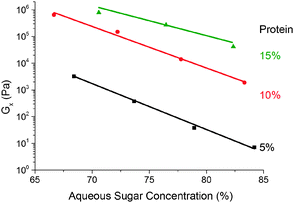 | ||
Fig. 9 The dependence of the cross-over modulus, G× on the (sugar![[thin space (1/6-em)]](https://www.rsc.org/images/entities/char_2009.gif) : :![[thin space (1/6-em)]](https://www.rsc.org/images/entities/char_2009.gif) water) ratio at the standard oil fraction for three different protein concentrations. Lines are exponential fits. water) ratio at the standard oil fraction for three different protein concentrations. Lines are exponential fits. | ||
Turning to the dependence on protein concentration, we find that G× scales with wp in a ‘critical’ fashion:
| G× ∝ (wp − wp0)f, | (6) |
G× = ![[capital G, script]](https://www.rsc.org/images/entities/char_e112.gif) 0(wp − wp0)fg(ws), 0(wp − wp0)fg(ws), | (7) |
![[capital G, script]](https://www.rsc.org/images/entities/char_e112.gif) 0 sets the elasticity scale.
0 sets the elasticity scale.
6.4 Simplicity in complexity
The success of tCS means that the viscoelastic spectra of every sample to the right of the dashed line in the caramel region in Fig. 3 have the form shown in Fig. 5, with the frequency and moduli scales set by eqn (3), (4) and (7). It is not a priori obvious that such a universal description in a significant region of composition space should be possible. That it can be done demonstrates practically the power of tCS, and conceptually that a ‘universal caramel’ exists as far as rheology is concerned. Uncovering such simplicity in apparent complexity is a good example of the utility of a ‘soft matter’ approach to foods.7 Caramel rheology: molecular implications
Although molecular details are not our focus, our rheology data provide constraints on molecular mechanisms; in particular, on how the protein gel matrix is formed.Globular proteins gel in a variety of ways between two idealised limits. They can aggregate as more or less intact colloids, or unfold and cross-link as polymers. The elastic moduli of these two types of gels scale quite differently with protein concentration. For a particulate gel formed by the aggregation of, e.g., intact casein micelles or carbon black,
| G ∼ wδp, | (8) |
Assuming that G× is a reasonable surrogate for Ge, Fig. 6, our data, Fig. 10, exclude eqn (8), but are consistent with eqn (6). This evidence for percolation gelation is consistent with the observation of G′(ω), G′′(ω) ∼ ω0.8 for ω ≫ ω×, eqn (1).26–28
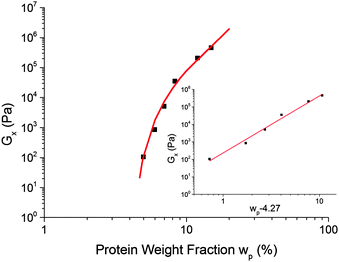 | ||
Fig. 10 The dependence of the cross-over modulus, G× on protein concentration, w, at the standard oil fraction and a constant sugar![[thin space (1/6-em)]](https://www.rsc.org/images/entities/char_2009.gif) : :![[thin space (1/6-em)]](https://www.rsc.org/images/entities/char_2009.gif) water ratio of 2.9. The error bars for these data points are the size of the points or lower. The red curve is a fit to G× ∼ water ratio of 2.9. The error bars for these data points are the size of the points or lower. The red curve is a fit to G× ∼ ![[Fraktur G]](https://www.rsc.org/images/entities/char_e184.gif) (w − wc)f, eqn (6), with (w − wc)f, eqn (6), with ![[Fraktur G]](https://www.rsc.org/images/entities/char_e184.gif) = 318 Pa, wc = 4.27% and f = 3.17. The inset shows the same data and fitting in a plot against log(wp − 4.27%). = 318 Pa, wc = 4.27% and f = 3.17. The inset shows the same data and fitting in a plot against log(wp − 4.27%). | ||
The fitted percolation threshold of wp0 ≈ 4% makes sense of the observation that in Fig. 3, the three samples to the left of the black dashed line did not satisfy tCS. In each case, we find that they are liquid like, G′(ω) < G′′(ω), with the two curves more or less parallel over the whole of our accessible frequency range, but with quite different slopes in each cases, and the data do not satisfy eqn (2). There is therefore no prospect that these would scale by tCS. The next line of samples at 5% protein all obey tCS, giving master curves consistent with Fig. 5. These observations are consistent with the finding from fitting eqn (6) to our data that wp0 ≳ 4%. It is therefore possible to define ‘caramel’, for the purposes of this study, as all cooked sugar–water–protein systems are showing the universal rheology in Fig. 5.
A quantitative understanding of the effect of sugar, Fig. 9, will require detailed kinetic knowledge of the various reactions involved. Qualitatively, however, these findings suggest that sugar stabilises proteins under our conditions,14 so that higher sugar content should give rise to fewer cross-links for the same cure time, and therefore weaker elasticity.
We can interpret the range of observed G× values, Fig. 9, using eqn (5). The molecular weight of BLG and κ-casein are both ≲20 × 103 g mol−1. This value gives an order of magnitude (OOM) lower bound for Meff, and therefore, an OOM upper bound of Ge ≲ 105 Pa, eqn (5). Our highest observed G× is ∼106 Pa, and we know that, necessarily, G× > Ge (Fig. 6), so that our OOM upper bound seems reasonable. Assuming that G×/Ge ∼ O(10),**Fig. 9 suggests that Ge ≳ 1 Pa, so that eqn (5) predicts an OOM maximum Meff ∼ 240 × 107 g mol−1, or ∼105 proteins of the size of β-lactoglobulin and/or κ-casein. Again, this does not seem unreasonable.
8 Neglected complexities
Throughout, we have neglected a number of potential complications. We now briefly discuss these, and indicate how they may fill out, but not invalidate, the picture we have given.8.1 Imperfect superposition
Examining the results presented in Fig. 7 again, we see that there appears to be small but systematic deviations from perfect tQS at low frequencies in G′(ω). This is probably because, with longer curing, a sample will move from Ferry's Type VII master curve (weakly cross-linked rubber) to Type VI (strongly cross-linked rubber), which involves, inter alia, the loss of the intermediate (GeN) inflection in the G′(ω) spectrum (cf.Fig. 7). This is consistent with the way the deviation from tQS shows up in our data (cf. Fig. 2.3 in Ferry31). Our tQS experiments use the oil-bath cooking method. The majority of our data for tCS obtained from samples cooked using our standard protocol do not show systematic deviations from superposition. This is probably because our tQS experiments explored a significantly larger range of cross-link densities than in our standard-protocol, tCS, experiments. Interestingly, previous data on tQS27 do not extend to low enough frequency to detect this effect. Future work to understand it should give additional insights into the details of structural evolution as a function of composition or curing time.8.2 Proteins: caseins vs. whey
We have attempted to prepare SMC with either just WPI or casein micelles, but at the same total protein weight fraction as in the mixed-protein material. Using casein only gave essentially the same material as SMC, though with G′(ω) and G′′(ω) smaller by ≈40% over our ω range. Limited experiments at other compositions gave similar results. There is therefore no essential change upon switching to a casein-only system. On the other hand, using WPI only in the same recipe gave a translucent material that fractured easily. This is clearly not a caramel. Thus, the casein protein plays the dominant role in the formation of the gel matrix.8.3 Maillard reactions: more than browning
The essential difference between sucrose and all the sugars found in glucose syrup is that the former is non-reducing, while all of the others are reducing. Only the latter can participate in Maillard reactions.16 Replacing all of the sucrose with glucose produced samples differing little from our standard caramels except ≈20% weaker moduli over the accessible ω range. However, replacing all the sugar content of glucose syrup with sucrose†† led to retardation of caramel formation. A very lightly coloured solid gel resulted only after ≈29 h of incubation at 90 °C in our oil bath. Presumably, it took this length of time for a small amount of sucrose to invert into its reducing monosaccharide components (i.e. glucose and fructose), which could then participate in Maillard reactions. The latter therefore play an essential role in caramel formation.To explore what this role is, we repeated the sucrose-only experiment with enough acetic acid added to bring the pH of the starting pre-mix to ≈5. Now, an uncoloured caramel with elastic moduli in the usual range was formed after 2 h of incubation at 90 °C. The absence of browning indicates that Maillard reactions have not occurred to any significant extent during this time period. Since carboxylic acids are produced in Maillard reactions,16 these results taken together suggest that in our standard recipe, a key role played by the Maillard reactions is to lower the pH enough for the kind of protein aggregation needed for caramel formation.
8.4 Gelation: the details
That the protein matrix should have the character of a polymeric gel, rather than a colloidal gel, is surprising, because casein micelles are essential to gelation (Section 8.2). The molecular nature of the polymer-like protein network in caramel remains to be elucidated. Moreover, we have assumed throughout, albeit tacitly, that the gel is homogeneous. This is unlikely to be true in practice. Again, the role of inhomogeneities remains to be investigated.8.5 The role of the fat
Fig. S1 in the ESI,† shows that increasing oil content strengthens caramel rheology, so that the droplets are bonded with the protein matrix.18 If our interpretation of Fig. 9 is correct, i.e., sugar stabilises proteins against thermal denaturation, so that higher sugar content produces weaker protein matrices, then higher sugar content may also weaken the bonds between the proteins stabilising the fat droplets and the gel matrix, leading to weaker caramels.Separately, it is known that oils may partition into the core of casein micelles, which have hydrophobic cores that can encapsulate hydrophobic compounds such as vitamin D.39 The effect of such potential oil incorporation is unknown, but seems unlikely to overturn any of our central conclusions.
9 Summary and conclusions
The high-dimensional composition space of sugars, proteins, water and oil is the basic ‘confectionary space’ encompassing many classes of products. Within one slice of this space, we find that caramels inhabit a well-defined region. Within this region, cooking a ‘premix’ of these ingredients leads to gelation of the sugar–protein matrix, with protein-stabilised oil droplets chemically bound to the matrix. Future work should explore the composition space more widely, using the oil bath method to extend the accessible range (Section 5.4).Investigating the location of the boundaries of the caramel region gives insights into the structure of caramel. The viscoelastic spectra of caramels satisfy time–composition superposition, so that roaming composition space ‘tunes’ only two basic parameters: the viscosity of the aqueous sugar solution and the connectivity of the protein gel network. The universal rheological spectra of all caramels are shown in Fig. 5, with the scales set by eqn (4) and (7).
That such simplicity and universality are there to be found is not a priori obvious from the complexity of the ingredients and the recipe. Our results show how coarse-grained soft-matter physics can be applied to whole food systems.
Acknowledgements
We thank Mike Cates and Michiel Hermes for their illuminating discussions. WCKP and KB were funded by EPSRC Programme Grant EP/J007404/1. SW held an EPSRC CASE studentship. Relevant data for this work have been deposited at the following site: http://dx.doi.org/10.7488/ds/318.References
- A. M. Donald, Rep. Prog. Phys., 1994, 57, 1081–1135 CrossRef CAS.
- R. G. M. van der Sman and A. J. van der Goot, Soft Matter, 2009, 5, 501–510 RSC.
- J. Ubbink, A. Burbidge and R. Mezzenga, Soft Matter, 2008, 4, 1569–1581 RSC.
- A. M. Donald, Soft Matter, 2008, 4, 1147–1150 RSC.
- E. Dickinson, Soft Matter, 2008, 4, 932–942 RSC.
- D. Rousseau and P. Smith, Soft Matter, 2008, 4, 1706–1712 RSC.
- Industrial Chocolate Manufacture and Use, ed. S. T. Beckett, Wiley-Blackwell, Chichester, 4th edn, 2008 Search PubMed.
- G. Sengar and H. K. Sharma, J. Food Sci. Technol., 2014, 51, 1686–1696 CrossRef CAS PubMed.
- P. F. Fox, in Advanced Dairy Chemistry Volume 1* Proteins, ed. P. F. Fox and P. L. H. McSweeney, Kleuwer Academic/Plenum, 2003, pp. 1–48 Search PubMed.
- C. G. de Kruif, T. Huppertz, V. S. Urban and A. V. Petukhov, Adv. Colloid Interface Sci., 2012, 171–172, 36–52 CrossRef CAS PubMed.
- D. N. Morton, C. J. Roberts, M. J. Hey, J. R. Mitchell, J. Hipkiss and J. Vercauteren, J. Food Sci., 2003, 68, 1411–1415 CrossRef CAS.
- L. Donato and F. Guomarc'h, Dairy Sci. Technol., 2009, 89, 3–29 CrossRef CAS.
- A. Sauer and C. I. Moraru, J. Dairy Sci., 2012, 95, 6339–6350 CrossRef CAS PubMed.
- M. G. Semenova, L. E. Antipova and A. S. Belyakova, Curr. Opin. Colloid Interface Sci., 2002, 7, 438–444 CrossRef CAS.
- Y. Liang, L. Matia-Merino, H. Patel, A. Ye, G. Gillies and M. Golding, Food Hydrocolloids, 2014, 41, 332–342 CrossRef CAS.
- S. I. F. S. Martins, W. M. F. Jongen and M. A. J. S. van Boekel, Trends Food Sci. Technol., 2000, 11, 364–373 CrossRef CAS.
- D. J. McClements, Food Emulsions: Principles, Practices, and Techniques, CRC Press, 2nd edn, 2004 Search PubMed.
- E. Dickinson, Food Hydrocolloids, 2012, 28, 224–241 CrossRef CAS.
- J. Chen, E. Dickinson, H. S. Lee and W. P. Lee, in Food Colloids: Fundamentals of formulation, ed. E. Dickinson and E. Miller, Royal Society of Chemistry, Cambridge, 2001 Search PubMed.
- S. R. Euston and R. L. Hirst, Int. Dairy J., 1999, 9, 693–701 CrossRef CAS.
- Y. H. Roos, Annu. Rev. Food Sci. Technol., 2010, 1, 469–496 CrossRef CAS PubMed.
- V. A. Vaclavik and E. W. Christian, Essentials of Food Science, Springer, New York, 2008, p. 336 Search PubMed.
- M. S. Chung, R. R. Ruan, P. L. Chen and X. Wang, Lebensm.-Wiss. Technol., 1999, 32, 162–166 CrossRef CAS.
- A. E. Steiner, E. A. Foegeding and M. Drake, J. Sens. Stud., 2003, 18, 277–289 CrossRef.
- J. Ahmed, H. S. Ramaswamy and P. K. Pandey, Lebensm.-Wiss. Technol., 2006, 39, 216–224 CrossRef CAS.
- J. E. Martin, D. Adolf and J. P. Wilcoxon, Phys. Rev. A: At., Mol., Opt. Phys., 1989, 39, 1325–1332 CrossRef CAS.
- D. Adolf and J. E. Martin, J. Macromol. Chem., 1990, 23, 3700–3704 CrossRef CAS.
- J. E. Martin, D. Adolf and J. Odinek, Makromol. Chem., Macromol. Symp., 1990, 40, 1–21 CrossRef CAS.
- R. G. Larson, Rheol. Acta, 1985, 24, 327–334 CrossRef CAS.
- R. G. Larson, The Structure and Rheology of Complex Fluids, Oxford University Press, Oxford, 1999 Search PubMed.
- J. D. Ferry, Viscoelastic Properties of Polymers, Wiley, Chischester, 3rd edn, 1980 Search PubMed.
- V. Trappe and D. A. Weitz, Phys. Rev. Lett., 2000, 85, 449–452 CrossRef CAS PubMed.
- A. S. Krishnan and R. J. Spontak, Soft Matter, 2012, 8, 1334–1343 RSC.
- W. H. Shih, W. Y. Shih, S. I. Kim, J. Liu and I. A. Aksay, Phys. Rev. A: At., Mol., Opt. Phys., 1990, 42, 4772–4779 CrossRef CAS.
- W. H. Shih, J. Liu, W. Y. Shih, M. Sarikaya and I. A. Aksay, Mater. Res. Soc. Symp. Proc., 1989, 155, 83–92 CrossRef CAS.
- R. Buscall, P. D. A. Mills, J. W. Goodwin and D. W. Lawson, J. Chem. Soc., Faraday Trans. 1, 1988, 84, 4249–4260 RSC.
- M. Sahimi and S. Arbabi, Phys. Rev. B: Condens. Matter Mater. Phys., 1993, 47, 703–712 CrossRef.
- E. Del Gado, L. de Arcangelis and A. Coniglio, Phys. Rev. E: Stat., Nonlinear, Soft Matter Phys., 2002, 65, 041803 CrossRef PubMed.
- E. Semo, E. Kesselman, D. Danino, Y. L. Livney, Food Hydrocolloids, 2007 Search PubMed.
Footnotes |
| † Electronic supplementary information (ESI) available. See DOI: 10.1039/c5sm01797a |
| ‡ All percentages are weight percents unless otherwise stated. |
| § We use ‘oil’ interchangeably with ‘fat’ unless distinguishing between solid and liquid phases is important. There is ≈0.1% NaCl in the continuous phase, which we do not explicitly discuss. |
| ¶ But not exactly, because, e.g., the boiling points of samples differ. |
| || Note that the constant in eqn (4) is not universal, but depends on, inter alia, the composition of the glucose syrup and sugar–protein interactions. |
| ** Whilst this holds for non-attractive polymer systems, it has not been extensively studied in attractive gel systems, and caution is warranted. |
| †† Note that the sucrose does not crystallize at this composition under our conditions. |
| This journal is © The Royal Society of Chemistry 2016 |

