 Open Access Article
Emissive nanoparticles from pyridinium-substituted tetraphenylethylene salts: imaging and selective cytotoxicity towards cancer cells in vitro and in vivo by varying counter anions†
Yanyan
Huang
ab,
Guanxin
Zhang
*ab,
Fang
Hu
ab,
Yulong
Jin
ab,
Rui
Zhao
*ab and
Deqing
Zhang
*ab
aBeijing National Laboratory for Molecular Sciences, CAS Key Laboratories of Organic Solids and Analytical Chemistry for Living Biosystems, Institute of Chemistry, Chinese Academy of Sciences, Beijing, 100190, China. E-mail: dqzhang@iccas.ac.cn; zhaorui@iccas.ac.cn; gxzhang@iccas.ac.cn
bUniversity of Chinese Academy of Sciences, Beijing 100049, China
First published on 18th July 2016
Abstract
Chemotherapeutics specifically targeting cancer cells without damaging healthy cells is the long-awaited goal of cancer treatment. In this paper, a series of nanoparticles (NanoTPES 1–4) assembled from pyridinium-substituted tetraphenylethylene salts were synthesized and investigated both in vitro and in vivo for this purpose. By changing the counter anions, NanoTPES 1–4 exhibit tunable emission colors, sizes and surface charges. NanoTPES 2 and 3 with tetraphenyl borate and tetra(4-chlorophenyl) borate as the respective anions selectively imaged and targeted mitochondria in cancer cells. Accordingly, these two nanoparticles specifically kill cancer cells with minimal effect on normal cells. Such selective cytotoxicity was attributed to the change of membrane potential and inhibition of ATP synthesis in the mitochondria of cancer cells. Furthermore, both NanoTPES 2 and 3 exhibited efficient tumor accumulation and tumor growth inhibition in vivo, with negligible systemic toxicity.
Introduction
Killing cancer cells without damaging healthy cells has become a long-awaited objective of cancer treatment.1 To this end, theranostic agents capable of passively or actively targeting physiological or molecular signatures of cancer cells are highly desirable.2 Rapid developments in nanoscience and nanotechnology do create new approaches to tackle this challenging issue. In fact, nanoscale targeting materials show attractive advantages in delivering imaging and therapeutic agents to the cancer sites by using the enhanced permeability and retention (EPR) effect in tumor vasculature.3 As the most successful example, liposome-based therapeutic nanocarriers have already been approved for clinical use.4 Inorganic nanomaterials such as gold nanoparticles, silica particles and quantum dots are extensively investigated for their potential for in vivo cancer therapy.5 In order to endow the nanoparticles with targeting abilities and thus avoid possible non-specific uptake, drug resistance and uncontrollable drug effectiveness, the surface features of nanoparticles need to be precisely controlled.5c,6 In this respect, organic nanoparticles capable of providing a wide range of surface chemistries, and thus tuning the surface properties, become ideal candidates to realize targeting, imaging and therapeutic functions simultaneously.7Tetraphenylethylene (TPE) is known as one of the aggregation-induced emission (AIE) fluorogens.8 By manipulating the aggregation and deaggregation of TPE molecules, chemo-/biosensors have been successfully constructed.9 TPE molecules with targeting groups have also been utilized for cell and organelle bioimaging and phototherapy.10 Moreover, TPE molecules in poor solvents can assemble into nanoparticles, and the emissive dots formed in the presence of amphiphiles have been employed for bioimaging.10a,11 However, selective cytotoxicity of TPE molecules towards cancer cells has never been reported.
In this work, we report nanoparticles self-assembled from pyridinium-substituted tetraphenylethylene with different counter anions (NanoTPES 1–4, Scheme 1). The sizes and surface zeta-potentials of NanoTPES 1–4 can be tuned by varying the counter ions. Interestingly, it was discovered that these nanoparticles interact with normal and cancer cells differently. The cytotoxicity of the nanoparticles can be tuned by the respective counter anions. The in vivo anti-cancer activity of NanoTPES was also examined with tumor-bearing mice. The targeting of NanoTPES 2 and 3 (with tetraphenyl borate and tetra(4-chlorophenyl) borate as the respective anions) to the tumor site facilitated the selective accumulation, efficacious tumor inhibition and minimal systemic cytotoxicity.
Results and discussion
Molecular design, preparation and characterization of the nanoparticles
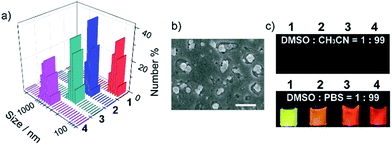
The unusually hyperpolarized mitochondrial membrane potential is emerging as a bioelectric sign of cancer cells.12 Owing to the vital roles of mitochondria in programmed cell death and power supply of cells,13 targeting agents capable of destroying mitochondria are effective in killing cancer cells.14 Herein, based on the fact that cationic compounds have the tendency to accumulate in mitochondria,15 pyridinium was linked to TPE to introduce delocalized positive charge. The derivatization of the pyridinium group is also intended to shift the blue emission of TPE to the long wavelength region, which is appealing for bioimaging. Counter anions with different hydrophobicities were chosen, including toluenesulfonate, tetraphenyl borate, tetra(4-chlorophenyl) borate and tetra(3,5-bis(trifluoromethyl)phenyl) borate (Scheme 1). Compounds 1–4 were prepared using ion-exchange procedures starting from the corresponding salt with iodide. Their chemical structures were characterized with NMR and FT-IR. The purities were confirmed by elemental analysis (Fig. S1–S4, ESI†).The nanoparticles were prepared by adding 10 μL of DMSO solutions of compounds 1–4 separately to 990 μL of phosphate buffer saline (PBS), and the resulting nanoparticles were referred to as NanoTPES 1, NanoTPES 2, NanoTPES 3 and NanoTPES 4, respectively. On the basis of DLS (dynamic light scattering) data (Fig. 1a), the average sizes of NanoTPES 1–4 were estimated to be 108 nm, 219 nm, 255 nm and 609 nm, respectively (Table 1). The resulting nanoparticles were also characterized with scanning electron microscopy (SEM) (Fig. 1b and S6†). The size difference of these nanoparticles is expected to arise from the different hydrophobic properties of the counter anions, which lead to different self-assembled structures. Apart from sizes, the surface charges reflected by zeta-potentials of these nanoparticles can also be tuned by varying the counter anions. As listed in Table 1, the surfaces of NanoTPES 2 and 3 are significantly positively charged, whereas the surface of NanoTPES 4 becomes negatively charged. The zeta-potential of NanoTPES 1 is just slightly positive.
| NanoTPES | Average size (nm) | Zeta potential (mV) |
|---|---|---|
| 1 | 108 | 0.7 |
| 2 | 219 | 30.4 |
| 3 | 255 | 36.2 |
| 4 | 609 | −9.9 |
Compounds 1–4 were weakly emissive in good solvents such as DMSO and acetonitrile, but became strongly fluorescent in phosphate buffer (Fig. 1c). The fluorescence quantum yields of NanoTPES 1–4 (20 μM) in PBS containing 1% DMSO were measured to be 24.1%, 16.5%, 26% and 25.1%, respectively. Interestingly, the emission colors were found to be dependent on the counter anions as shown in Fig. 1c; the emission maximum was shifted from 560 nm for NanoTPES 1, to 605 nm, 620 nm and 640 nm for NanoTPES 2, 3 and 4, respectively (Fig. S7 and S8, ESI†). Thus, NanoTPES 2, 3 and 4 became orange-red or red-emissive when the counter anions were replaced by tetraphenyl borate, tetra(4-chlorophenyl) borate and tetra(3,5-bis(trifluoromethyl)phenyl) borate. The different emission colors of these nanoparticles may be attributed to their different self-assembled structures, within which the cation–anion interactions are different owing to the different electronic structures and sizes of the counter anions. In addition, it is expected that the bulky anions in NanoTPES 2, 3 and 4 may allow the tetraphenylethylene frameworks to possess more planar conformations, which can lead to the red-shifts of the emission according to our previous report.16
Cell imaging
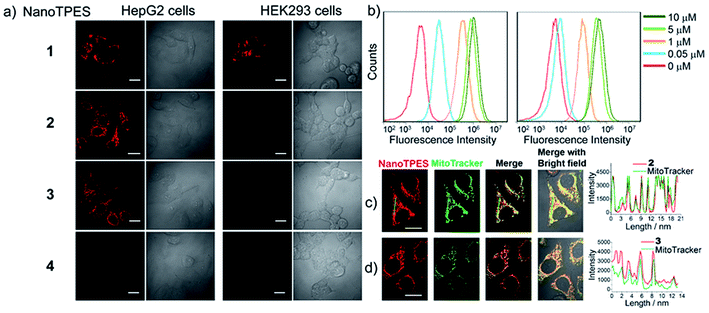
The bright fluorescence of NanoTPES 1–4 enables the monitoring of their interactions with different cells. These nanoparticles were allowed to interact with cancer cells including HepG2 (hepatoblastoma cell line), HeLa (cervical cancer cell line) and A549 (human lung adenocarcinoma epithelial cells), and normal cells including HEK293 (from normal human kidney), Chang liver and L02 (human hepatic cell lines). From CLSM (confocal laser scanning microscopy) images, both cancer (HepG2, HeLa and A549) and normal (HEK293, Chang liver and L02) cells were fluorescent after incubation with NanoTPES 1 (Fig. 2a and S9†), indicating the non-selective uptake of NanoTPES 1 by cancer and normal cells. In comparison, bright red fluorescence was only detected for HepG2, HeLa and A549 cells after incubation with NanoTPES 2 and 3 (Fig. 2a and S9†), whereas no fluorescence was observed for HEK293, Chang liver and L02 cells with the same treatment. The selective imaging suggests the good permeability of NanoTPES 2 and 3 into cancer cells, and their disability to penetrate normal cells. Interestingly, no fluorescence was detected for both cancer and normal cells after incubation with NanoTPES 4 (Fig. 2a and S9†), revealing that the cellular uptake of NanoTPES 4 had not taken place for either cancer or normal cells.The intracellular delivery of nanoparticles is usually via an endocytosis/phagocytosis pathway in which interactions with the cell membrane may be involved.17 Compared with those of normal cells, membranes of cancer cells possess significantly negative charges due to the presence of more anionic biomolecules.18 Thus, the selectivity of NanoTPES 2 and 3 may be related to the sizes and surface charges of these nanoparticles. As listed in Table 1, the surfaces of NanoTPES 2 and 3 are more positively charged; accordingly, they can interact with cancer cells more strongly. In addition, the hydrophobic TPE fragment in NanoTPES 2 and 3 can facilitate the uptake and interaction with lipid bilayers of cancer cells, which resulted in their efficient internalization into cancer cells. With regards to normal cells, the absence of the essential electrostatic interaction dramatically weakens the interaction and uptake of NanoTPES 2 and 3 into cells. The significant differences in size and surface charge of NanoTPES 1 and 4, in comparison with NanoTPES 2 and 3, can explain the observation that they cannot specifically target cancer cells (see page s18 in ESI†).
On the basis that NanoTPES 2 and 3 can selectively target cancer cells, flow cytometry, a powerful tool for quantitation, was also used to analyze stained cells. As depicted in Fig. 2b, gradual fluorescence enhancement was observed from HepG2 cells as the concentrations of NanoTPES 2 and 3 increased, indicating the continuous uptake of these two nanoparticles. The saturation uptake behaviors of NanoTPES 2 and 3 by HepG2 cells confirm their high affinity and specificity toward cancer cells (Fig. S10, ESI†). In addition, a time-course assay clearly demonstrated the intracellular trafficking of the nanoparticles from cell membrane into cytoplasm (see page s19 in ESI†). After incubation for 60 min, a very clear target-to-background image was acquired (Fig. S11†), indicating the completion of subcellular localization. As examined by fluorescence colocalization assay, NanoTPES 2 and 3 gave high coefficient values of 0.94 and 0.91 with a commercial mitochondrial tracker (MitoTracker Green) (Fig. 2c and d), demonstrating their good localization to mitochondria. No overlapping was detected with fluorescent trackers for other organelles (such as lysosomes and endosomes) and the cell nucleus (Fig. S12 and S13, ESI†). Based on the fact that cancer cells usually contain more mitochondria and their mitochondrial membrane is unusually negatively charged,12,15b the possible pathway for NanoTPES 2 and 3 to selectively target mitochondria in cancer cells is illustrated in Scheme 2.
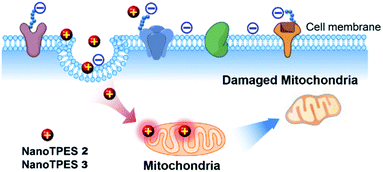 | ||
| Scheme 2 Illustration of possible pathway of NanoTPES 2 and 3 for targeting and damaging mitochondria in cancer cells. | ||
Cytotoxicity tuned by counter anions
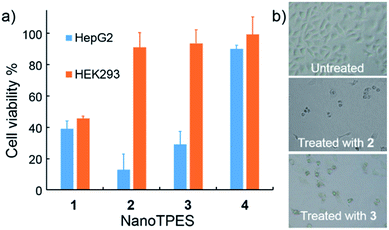
The cytotoxicity of NanoTPES 1–4 towards both cancer cells and normal cells was assayed with the standard MTT (3-(4,5-dimethylthiazol-2-yl)-2,5-diphenyltetrazolium bromide) method. As shown in Fig. 3a, the viability of HepG2 cells was measured to be only 13% and 29% respectively, after treatment with NanoTPES 2 and 3 for 48 h. Accordingly, HepG2 cells also showed typical morphology of dead cells, being shrunken, rounded up and detached after incubation with either NanoTPES 2 or 3 (Fig. 3b). NanoTPES 2 and 3 also displayed high cytotoxicity toward cancerous HeLa and A549 cells. The cell viabilities were only 23% and 8% for HeLa cells, and 23% and 31% for A549 cells after the respective treatments with NanoTPES 2 and 3 (Fig. S14†). In comparison, normal human cells including HEK293, Chang liver and L02 cells were healthy and almost unaffected after the same treatments (Fig. 3a and S14†), and in each case the cell viability was greater than 90%. Clearly, NanoTPES 2 and 3 exhibit high cytotoxicity towards cancer cells with almost no cytotoxicty towards normal cells. The IC50 values of NanoTPES 2 and 3 towards HepG2 cells were estimated to be 2.2 μM and 3.8 μM, respectively (Fig. S15†). In contrast, NanoTPES 1 is cytotoxic towards both cancer and normal cells. Cell viabilities were found to be below 50% for both cancer (HepG2, HeLa and A549) and normal (HEK293, Chang liver and L02) cells (Fig. 3a and S14†). NanoTPES 4, however, shows no cytotoxicity towards both cancer and normal cells.Mechanism for the tunable cytotoxicity
Such tunable cytotoxicity of NanoTPES with different counter anions is in good agreement with the above confocal imaging results. To further investigate the roles of cations and anions for cytotoxic effects, two control salts 5 and 6 (Scheme 1), which contain tetraphenyl borate as the anion and Na+ and 1-methyl-4-phenylpyridinium as the respective cations, were prepared. The results reveal that both 5 and 6 show negligible cellular uptake and no cytotoxicity to HepG2 cells based on the MTT assay (Fig. S16†). Therefore, it can be inferred that the cation, pyridinium-substituted tetraphenylethylene, and the respective anions within NanoTPES 2 and 3 work cooperatively to achieve targeted imaging and selective cytotoxicity. Pyridinium-substituted tetraphenylethylene plays a central role in their cytotoxicities, while different anions tune the cytotoxicities to be selective.Further studies indicate that the accumulation of NanoTPES 2 and 3 in mitochondria of cancer cells can induce a change of membrane potential (ΔΨm), which is an indicator of the health status of mitochondria and is closely related with early cell apoptosis. ΔΨm was measured with a commercial JC-10 dye. From both CLSM observation and microplate quantitation assay, a critical drop in ΔΨm of HepG2 after treatment with NanoTPES 2 and 3 was detected (Fig. S17, ESI†). These results hint that the selective cytotoxicity of NanoTPES 2 and 3 towards HepG2 cells may operate via the mitochondria damage-mediated cell apoptosis pathway as illustrated in Scheme 2. Additionally, NanoTPES 2 and 3 were also found to affect the generation of adenosine triphosphate (ATP) in HepG2 cells as indicated by an ATP bioluminescent assay kit. The amounts of ATP generated in HepG2 cells after incubation with NanoTPES 2 and 3 decreased by 67% and 57% of that before the treatments based on the relative emission intensities (Fig. S17†). These results suggest that NanoTPES 2 and 3 can inhibit the oxidative phosphorylation process in mitochondria. The reduced ATP supply in the mitochondria of HepG2 cells finally leads to cell death.
In vivo xenografted tumor therapy
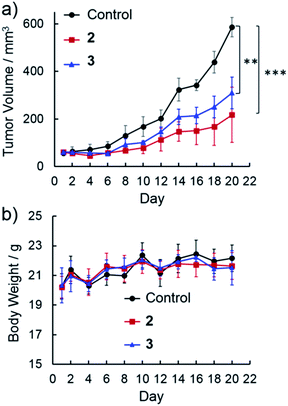
Benefiting from their cancer cell-specific internalization and mitochondria-damaging ability, NanoTPES 2 and NanoTPES 3 were applied for in vivo antitumor therapy. To this end, a tumor-bearing mouse model was established by xenografting HepG2 cells into BALB/c nude mice subcutaneously. After tumor initiation, PBS containing 1% DMSO (v/v), NanoTPES 2 and NanoTPES 3 were administrated separately by either intratumor or intravenous injection every other day.After intratumor injection of NanoTPES 2 and 3, the mice showed significantly lower tumor growth rates than control ones administrated with PBS (1% DMSO) (Fig. 4a). With 20 day treatment, the average tumor volumes were 217 mm3 and 310 mm3, respectively, being much smaller than that of the control group (587 mm3). Clearly, the rate of tumor growth is slowed significantly after the respective treatments with NanoTPES 2 and 3. This agrees well with the actual photos of tumors after 20 day treatments (see Fig. S18†). The body weight of mice is used to evaluate the side effects. Compared with control mice, their weights remained almost unchanged (Fig. 4b), suggesting that NanoTPES 2 and 3 possess minimal systemic cytotoxicity. To further evaluate the therapeutic efficacy, hematoxylin and eosin (H&E) histopathological analysis was employed. Distinct cell death was observed in the tumor tissues treated by NanoTPES 2 and 3, while tumor cells in the control group retained vigorous and cancerous features (Fig. S18†).
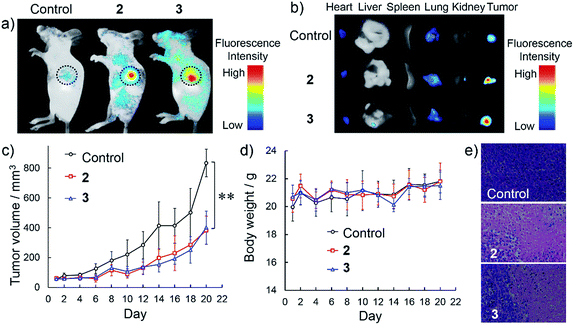
The targetable antitumor efficacy was further examined by intravenous injection of NanoTPES 2 and 3 to tumor-bearing mice. Body imaging was carried out by monitoring the respective red emissions. As shown in Fig. 5a, significant fluorescence was detected in the tumors after intravenous injections of NanoTPES 2 and 3 separately, indicating the specific delivery of these nanoparticles to the tumor sites. After sacrifice, bright red emission was clearly observed in tumor tissues (Fig. 5b), while other organs including the heart, liver, spleen, lung and kidney showed negligible emissions. Such in vivo tumor-targeting and accumulation abilities of NanoTPES 2 and 3 are appealing for their antitumor performance.
The in vivo therapeutic outcomes after intravenous injection of NanoTPES 2 and 3 are shown in Fig. 5c–e. In comparison with those of the control group, the tumor volumes were obviously reduced after injections of these two nanoparticles. The average volumes of the tumors after intravenous injections of NanoTPES 2 and 3 for 20 days were 383 mm3 and 401 mm3, respectively, which were reduced by 54% and 52%, respectively, in comparison with that (834 mm3) of the control group. Moreover, the NanoTPES-treated mice did not show significant loss in body weight (Fig. 5d), suggesting intravenous injections of NanoTPES 2 and 3 have almost no obvious side toxicity. H&E histopathological analysis indicates that tumor cell death was only observed for mice treated with NanoTPES 2 and 3 (Fig. 5e). This further verifies their selective toxicity to cancer cells. No obvious physiological morphology changes were found in the heart, liver, spleen, lung and kidney (Fig. S19†), demonstrating the negligible side effect of NanoTPES 2 and 3 during blood circulation. The tumor targeting effect and cancer cell-specific damage capability provides NanoTPES 2 and 3 with superior therapeutic outcome and minimal systemic toxicity. Notably, such antitumor function has never been reported for AIE luminogens before.
Conclusions
In summary, we report the nanoparticles NanoTPES 1–4, derived from pyridinium-substituted tetraphenylethylene with different counter anions, for bioimaging and selective cytotoxicity towards cancer cells. The results reveal that the emissions, sizes and surface charges of these nanoparticles can be tuned by varying the counter anions. The suitable sizes and positively charged surfaces enable NanoTPES 2 and 3 to selectively image and target mitochondria in cancer cells rather than normal cells. Furthermore, the targeting of mitochondria in cancerous HepG2 cells by either NanoTPES 2 or 3 induces the decrease of mitochondrial transmembrane potential and affects ATP generation, thus resulting in mitochondrial damage (Scheme 2). In this manner, both NanoTPES 2 and 3 show selective cytotoxicity towards cancer cells, whilst they are almost non-toxic to normal cells. Inspired by this discovery, both NanoTPES 2 and 3 were applied for in vivo xenografted tumor therapy. To our delight, they specifically accumulate in tumor sites and exhibit efficient tumor suppression during in vivo therapy, whereas their systemic toxicity is negligible. These interesting results clearly demonstrate that the combination of pyridinium-substituted tetraphenylethylene and appropriate anions can lead to new multifunctional nanomaterials which can be used simultaneously for bioimaging and as antitumor agents.Acknowledgements
Financial support from the National Natural Science Foundation of China (21375134, 21475140, 21135006 and 21321003), the Ministry of Science and Technology of China (2015CB856300, 2013CB733700, 2013CB834700), the Beijing Natural Science Foundation (2162048) and the Chinese Academy of Sciences (XDB12010300) is gratefully acknowledged.Notes and references
- (a) G. Szakács, J. K. Paterson and J. A. Ludwig, Nat. Rev. Drug Discovery, 2006, 5, 219 CrossRef PubMed; (b) X. Wang and Z. Guo, Chem. Soc. Rev., 2013, 42, 202 RSC.
- (a) L. Gu and D. J. Mooney, Nat. Rev. Cancer, 2016, 16, 56 CrossRef CAS PubMed; (b) F. Danhiera, O. Feronb and V. Préat, J. Controlled Release, 2010, 148, 135 CrossRef PubMed; (c) N. Bertrand, J. Wu, X. Xu, N. Kamaly and O. C. Farokhzad, Adv. Drug Delivery Rev., 2014, 66, 2 CrossRef CAS PubMed.
- (a) R. A. Petros and J. M. DeSimone, Nat. Rev. Drug Discovery, 2010, 9, 615 CrossRef CAS PubMed; (b) H. Maeda, J. Wu, T. Sawa, Y. Matsumura and K. Hori, J. Controlled Release, 2000, 65, 271 CrossRef CAS; (c) E.-K. Lim, T. Kim, S. Paik, S. Haam, Y.-M. Huh and K. Lee, Chem. Rev., 2015, 115, 327 CrossRef CAS PubMed.
- T. M. Allena and P. R. Cullis, Adv. Drug Delivery Rev., 2013, 65, 36 CrossRef PubMed.
- (a) S. Kolemen, T. Ozdemir, D. Lee, G. M. Kim, T. Karatas, J. Yoon and E. U. Akkaya, Angew. Chem., Int. Ed., 2016, 55, 1 CrossRef PubMed; (b) A. Riedinger, T. Avellini, A. Curcio, M. Asti, Y. Xie, R. Tu, S. Marras, A. Lorenzoni, S. Rubagotti, M. Iori, P. C. Capponi, A. Versari, L. Manna, E. Seregni and T. Pellegrino, J. Am. Chem. Soc., 2015, 137, 15145 CrossRef CAS PubMed; (c) M. E. Davis, Z. G. Chen and D. M. Shin, Nat. Rev. Drug Discovery, 2008, 7, 771 CrossRef CAS PubMed.
- (a) M. Ferrari, Nat. Rev. Cancer, 2005, 5, 161 CrossRef CAS PubMed; (b) T. Sun, Y. S. Zhang, B. Pang, D. C. Hyun, M. Yang and Y. Xia, Angew. Chem., Int. Ed., 2014, 53, 12320 CAS.
- (a) D. K. Bwambok, B. El-Zahab, S. K. Challa, M. Li, L. Chandler, G. A. Baker and I. M. Warner, ACS Nano, 2009, 3, 3854 CrossRef CAS PubMed; (b) P. K. S. Magut, S. Das, V. E. Fernand, J. Losso, K. McDonough, B. M. Naylor, S. Aggarwal and I. M. Warner, J. Am. Chem. Soc., 2013, 135, 15873 CrossRef CAS PubMed; (c) B. Wang, H. Yuan, Z. Liu, C. Nie, L. Liu, F. Lv, Y. Wang and S. Wang, Adv. Mater., 2014, 26, 5986 CrossRef CAS PubMed; (d) C. Zhu, L. Liu, Q. Yang, F. Lv and S. Wang, Chem. Rev., 2012, 112, 4687 CrossRef CAS PubMed; (e) A. Shao, Y. Xie, S. Zhu, Z. Guo, S. Zhu, J. Guo, P. Shi, T. James, H. Tian and W. Zhu, Angew. Chem., Int. Ed., 2015, 54, 7275 CrossRef CAS PubMed; (f) Y. Li, A. Shao, Y. Wang, J. Mei, D. Niu, J. Gu, P. Shi, W. Zhu, H. Tian and J. Shi, Adv. Mater., 2016, 28, 3187 CrossRef CAS PubMed; (g) W. Lin, T. Sun, Z. Xie, J. Gu and X. Jing, Chem. Sci., 2016, 7, 1846 RSC.
- (a) J. Mei, N. L. C. Leung, R. T. K. Kwok, J. W. Y. Lam and B. Z. Tang, Chem. Rev., 2015, 115, 11718 CrossRef CAS PubMed; (b) J. Mei, Y. Hong, J. W. Y. Lam, A. Qin, Y. Tang and B. Z. Tang, Adv. Mater., 2014, 26, 5429 CrossRef CAS PubMed; (c) Y. Hong, J. W. Y. Lam and B. Z. Tang, Chem. Commun., 2009, 29, 4332 RSC; (d) Z. Zhao, J. W. Y. Lam and B. Z. Tang, J. Mater. Chem., 2012, 22, 23726 RSC.
- (a) R. T. K. Kwok, C. W. T. Leung, J. W. Y. Lam and B. Z. Tang, Chem. Soc. Rev., 2015, 44, 4228 RSC; (b) M. Wang, G. Zhang, D. Zhang and D. Zhu, J. Mater. Chem., 2010, 20, 1858 RSC; (c) G. Zhang, F. Hu and D. Zhang, Langmuir, 2015, 31, 4593 CrossRef CAS PubMed; (d) W. Chen, Q. Li, W. Zheng, F. Hu, G. Zhang, Z. Wang, D. Zhang and X. Jiang, Angew. Chem., Int. Ed., 2014, 53, 13734 CrossRef CAS PubMed; (e) S. Gui, Y. Huang, F. Hu, Y. Jin, G. Zhang, L. Yan, D. Zhang and R. Zhao, Anal. Chem., 2015, 87, 1470 CrossRef CAS PubMed.
- (a) D. Ding, K. Li, B. Liu and B. Z. Tang, Acc. Chem. Res., 2013, 46, 2441 CrossRef CAS PubMed; (b) Y. Huang, F. Hu, R. Zhao, G. Zhang, H. Yang and D. Zhang, Chem.–Eur. J., 2014, 20, 158 CrossRef CAS PubMed; (c) F. Hu, Y. Huang, G. Zhang, R. Zhao, H. Yang and D. Zhang, Anal. Chem., 2014, 86, 7987 CrossRef CAS PubMed; (d) X. Gu, E. Zhao, J. W. Y. Lam, Q. Peng, Y. Xie, Y. Zhang, K. S. Wong, H. H. Y. Sung, I. D. Williams and B. Z. Tang, Adv. Mater., 2015, 27, 7093 CrossRef CAS PubMed; (e) L. Zhang, W. Liu, X. Huang, G. Zhang, X. Wang, Z. Wang, D. Zhang and X. Jiang, Analyst, 2015, 140, 5849 RSC; (f) N. Zhao, M. Li, Y. Yan, J. W. Y. Lam, Y. L. Zhang, Y. S. Zhao, K. S. Wong and B. Z. Tang, J. Mater. Chem., 2013, 1, 4640 CAS; (g) Y. Yuan, C.-J. Zhang, S. Xu and B. Liu, Chem. Sci., 2016, 7, 1862 RSC.
- (a) K. Li, W. QinM, D. Ding, N. Tomczak, J. Geng, R. Liu, J. Liu, X. Zhang, H. Liu, B. Liu and B. Tang, Sci. Rep., 2013, 3, 1150 Search PubMed; (b) K. Li, Y. Jiang, D. Ding, X. Zhang, Y. Liu, J. Hua, S. Feng and B. Liu, Chem. Commun., 2011, 47, 7323 RSC; (c) D. Ding, K. Li, W. Qin, R. Zhan, Y. Hu, J. Liu, B. Tang and B. Liu, Adv. Healthcare Mater., 2013, 2, 500 CrossRef CAS PubMed; (d) G. Feng, W. Qin, Q. Hu, B. Z. Tang and B. Liu, Adv. Healthcare Mater., 2015, 4, 2667 CrossRef CAS PubMed.
- (a) S. E. Weinberg and N. S. Chandel, Nat. Chem. Biol., 2015, 11, 9 CrossRef CAS PubMed; (b) G. Yu, D. Wu, Y. Li, Z. Zhang, L. Shao, J. Zhou, Q. Hu, G. Tang and F. Huang, Chem. Sci., 2016, 7, 3017 RSC.
- (a) M. T. Villanueva, Nat. Rev. Cancer, 2015, 15, 456 Search PubMed; (b) G. Kroemer and J. C. Reed, Nat. Med., 2000, 6, 513 CrossRef CAS PubMed.
- (a) C. Lee, H.-K. Park, H. Jeong, J. Lim, A.-J. Lee, K. Y. Cheon, C.-S. Kim, A. P. Thomas, B. Bae, N. D. Kim, S. H. Kim, P.-G. Suh, J.-H. Ryu and B. H. Kang, J. Am. Chem. Soc., 2015, 137, 4358 CrossRef CAS PubMed; (b) K. Suntharalingam, S. G. Awuah, P. M. Bruno, T. C. Johnstone, F. Wang, W. Lin, Y.-R. Zheng, J. E. Page, M. T. Hemann and S. J. Lippard, J. Am. Chem. Soc., 2015, 137, 2967 CrossRef CAS PubMed; (c) S. Imstepf, V. Pierroz, R. Rubbiani, M. Felber, T. Fox, G. Gasser and R. Alberto, Angew. Chem., Int. Ed., 2016, 55, 2792 CrossRef CAS PubMed.
- (a) D. Y. Cho, H. Cho, K. Kwon, M. Yu, E. Lee, K. M. Huh, D. H. Lee and H. C. Kang, Adv. Funct. Mater., 2015, 25, 5479 CrossRef CAS; (b) A. T. Hoye, J. E. Davoren, P. Wipf, M. P. Fink and V. E. Kagan, Acc. Chem. Res., 2008, 41, 87 CrossRef CAS PubMed; (c) A. R. L. Gear, J. Biol. Chem., 1974, 249, 3628 CAS.
- F. Hu, G. Zhang, C. Zhan, W. Zhang, Y. Yan, Y. Zhao, H. Fu and D. Zhang, Small, 2015, 11, 1335 CrossRef CAS PubMed.
- I. Brigger, C. Dubernet and P. Couvreur, Adv. Drug Delivery Rev., 2002, 54, 631 CrossRef CAS PubMed.
- (a) S. Ran, A. Downes and P. E. Thorpe, Cancer Res., 2002, 62, 6132 CAS; (b) P. Chandra, H.-B. Noh and Y.-B. Shim, Chem. Commun., 2013, 49, 1900 RSC.
Footnote |
| † Electronic supplementary information (ESI) available. See DOI: 10.1039/c6sc02395a |
| This journal is © The Royal Society of Chemistry 2016 |


