
 Open Access Article
 This Open Access Article is licensed under a
 Creative Commons Attribution 3.0 Unported Licence
Simultaneous fluorescence imaging of hydrogen peroxide in mitochondria and endoplasmic reticulum during apoptosis†
Haibin
Xiao
,
Ping
Li
*,
Xiufen
Hu
,
Xiaohui
Shi
,
Wen
Zhang
and
Bo
Tang
*
College of Chemistry, Chemical Engineering and Materials Science, Collaborative Innovation Center of Functionalized Probes for Chemical Imaging in Universities of Shandong, Key Laboratory of Molecular and Nano Probes, Ministry of Education, Shandong Provincial Key Laboratory of Clean Production of Fine Chemicals, Shandong Normal University, Jinan 250014, P. R. China. E-mail: tangb@sdnu.edu.cn
First published on 1st June 2016
Abstract
Cell apoptosis is a biochemical and molecular pathway essential for maintaining cellular homeostasis. It is an integrated process involving in a series of signal transduction cascades. Moreover, the apoptotic pathways may be initiated inside various subcellular organelles. Increasing evidence indicates that hydrogen peroxide (H2O2) is closely related to cell apoptosis, particularly in the mitochondria. However, during the apoptotic process, the synergetic variation of H2O2 levels in different compartments is seldom explored, particularly in two important organelles: mitochondria and endoplasmic reticulum (ER). To solve this problem, we developed two new organelle-specific fluorescent probes termed MI-H2O2 and ER-H2O2 that can detect H2O2 in mitochondria and ER, respectively or simultaneously. Experimental results demonstrated that MI-H2O2 and ER-H2O2 display distinguishable excitation and emission spectra, as well as excellent organelle targeting capabilities. Therefore, we used MI-H2O2 and ER-H2O2 to successfully image exogenous or endogenous hydrogen peroxide in the mitochondria and ER. Interestingly, during diverse apoptotic stimuli, dual-color fluorescence imaging results revealed that the changes of H2O2 levels in mitochondria and ER are different. The H2O2 levels are enhanced in both the mitochondria and ER during the L-buthionine sulfoximine (BSO)-treated cell apoptosis process. During mitochondria-oriented apoptosis induced by carbonyl cyanide m-chlorophenylhydrazone (CCCP) or rotenone, H2O2 levels prominently and continuously increase in the mitochondria, whereas the ER H2O2 levels were found to rise subsequently after a delay. Moreover, during ER-oriented apoptosis induced by tunicamycin, ER is the major site for overproduction of H2O2, and delayed elevation of the H2O2 levels was found in the mitochondria. Altogether, this dual-probe and multicolor imaging approach may offer a proven methodology for studying molecular communication events on H2O2-related apoptosis and also other physiological and pathological processes within different subcellular organelles.
Introduction
Apoptosis, a mode of programmed cell death, is critical for maintaining cellular homeostasis. Notably, cell apoptosis is an integrated mechanism involving in a series of signal transduction cascades and the synergistic effects of subcellular organelles.1,2 There are many different pathways related to apoptosis including ligation of plasma membrane death receptors (the ‘extrinsic’ pathway) and perturbation of intracellular homeostasis (the ‘intrinsic’ pathway). Many organelles are major sites of integration of pro-apoptotic signaling, or damage sensing, and can sense stressful and pathogenic alterations to initiate cell apoptosis.3,4 In particular, mitochondria-elicited and endoplasmic reticulum (ER) stress-regulated apoptosis are of wide concern. However, the interaction and interplay, as well as synergistic variations of the corresponding signal molecules, during mitochondria-triggered and ER-triggered apoptosis have not been elucidated. H2O2, as one type of reactive oxygen species (ROS) is an inevitable byproduct of cell metabolism and a common marker and signal molecule for oxidative stress that is associated with apoptosis.5–8 Therefore, research on H2O2 biology will play a vital role in revealing the relationship between cell apoptosis and H2O2 as well as molecular communication within different organelle-derived apoptosis processes (signal pathways). For instance, H2O2 is generated in mitochondria as an early major mediator in rotenone-induced or ceramide-induced apoptosis.9,10 And vice versa, H2O2 can induce apoptosis via a mitochondria-related apoptotic pathway.3,11,12 Excessive, or inaccurate, protein folding in the ER may lead to ER stress, and chronic or unresolved ER stress can trigger cell apoptosis, which is responsible for a significant proportion of H2O2 elevation.13–17 However, due to lack of ideal tools, the cooperation of mitochondria and ER in H2O2 biology during apoptosis has not been interpreted. In particular, when cells initiate the apoptotic cascades through one subcellular organelle under certain stimulation, the changes of H2O2 levels in the other involved organelles have not been studied up to now, which impedes the better understanding of H2O2-related physiology and pathology in apoptosis within different subcellular organelles. As a consequence, there is an urgent need to exploit new approaches for simultaneously visualizing H2O2 levels in different organelles sensitively and selectively.Fluorescent probes are well-suited tools to map the spatial and temporal distribution of interested species within living cells.18–21 In particular, simultaneous fluorescence imaging of an active molecule in different subcellular organelles will facilitate understanding of complicated chemical and biological processes because this approach, with real time operation, can offer reliable data. Motivated to meet this need, specific conditions must be considered: (1) the probes must possess outstanding organelle-targeting abilities; (2) the probes must display distinguishable excitation or emission spectra that can be monitored simultaneously with multicolor confocal fluorescence imaging. In recent years, mounting synthetic fluorescent H2O2 indicators has been developed, which greatly contributes to the understanding of H2O2 biological chemistry. Among them, a series of organelle-targeting fluorescent probes have been exploited, especially for the mitochondria,22–29 the lysosome,30–33 and the nucleus.34,35 However, no report in which simultaneous fluorescence imaging of hydrogen peroxide in different organelles, such as the mitochondria and ER, was presented and utilized to study the H2O2-related chemical events up to now.
In this study, we reported the synthesis and application of two H2O2-selective fluorescent probes, termed MI-H2O2 and ER-H2O2, based on a boronic acid/ester deprotection36–40 mechanism (Scheme 1). MI-H2O2 and ER-H2O2 can preferentially accumulate in the mitochondria and ER, respectively, because of the lipophilic cationic and methyl sulphonamide moieties, respectively.41,42 Additionally, they display obviously discriminable spectra that benefits live cell multicolor imaging. MI-H2O2 is comprised of merocyanine as a fluorescence reporter and boronic acid as a specific masking group. The boronic acid group can be removed upon reaction with hydrogen peroxide and converted to an oxygen anion, forming an intense push–pull conjugated system that fluoresces strongly (Scheme 1). Meanwhile, ER-H2O2 consists of a 1,8-naphthalimide fluorophore and a boronic ester recognition group. After reaction of H2O2, an electron donor and an acceptor conformation was engendered, and that has been continually used in ratiometric fluorescent probes owing to its outstanding internal charge transfer (ICT) structure. As expected, our results indicated that MI-H2O2 and ER-H2O2 can visualize exogenous or endogenous H2O2 in mitochondria and ER, respectively. Also, simultaneous multicolor fluorescence imaging utilizing these two probes revealed that H2O2 levels changed differentially in the mitochondria and the ER during different apoptotic stimuli.
 | ||
| Scheme 1 The chemical structures of MI-H2O2 and ER-H2O2 and corresponding response mechanism. | ||
Results and discussion
Chemical synthesis
The target probes MI-H2O2 and ER-H2O2 were composed of three parts, i.e., fluorophores, recognition units, and organelle-targeting moieties (Scheme 1). The fluorophores were constructed based on the merocyanine and 1,8-naphthalimide scaffolds due to their outstanding photophysical characteristics and easy preparation. The recognition units were universal boronic acid/ester and the lipophilic cationic and methyl sulphonamide served as the mitochondria and ER targeting moieties, respectively. The detailed synthetic routes of MI-H2O2 and ER-H2O2 are provided in the ESI.† All the compounds and probes were characterized by 1H NMR, 13C NMR and HR-MS.In vitro optical properties of MI-H2O2 and ER-H2O2 to H2O2
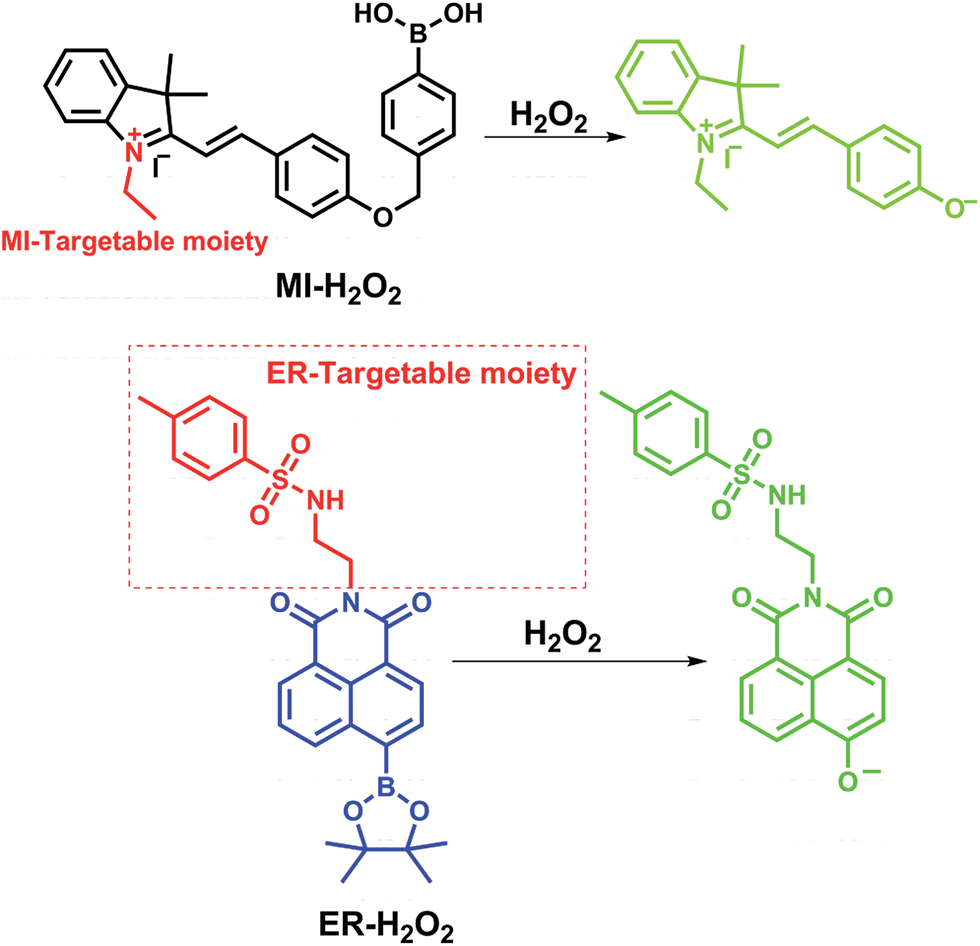
To understand the effect of H2O2 on the photophysical properties of MI-H2O2 and ER-H2O2, we examined the absorption and fluorescence emission spectra of MI-H2O2 and ER-H2O2 in the absence and presence of H2O2. As shown in Fig. 1A, MI-H2O2 was almost colorless with an absorption maximum at 425 nm. Upon addition of H2O2, the solution turned to light pink with increasing absorption bands at 525 nm. For ER-H2O2, its solution changed from colorless to yellow, and the absorption red-shifted from 360 nm to 460 nm (Fig. 1B). This demonstrated these two probes can serve as “naked-eye” sensors for colorimetric detection of H2O2. We subsequently investigated the fluorescence responses of MI-H2O2 and ER-H2O2 to H2O2 under physiological conditions (10 mM PBS, pH 8.0 for MI-H2O2 and 7.4 for ER-H2O2). For MI-H2O2, in the presence of H2O2, the fluorescence emission peak at 555 nm increased dramatically when excited at 525 nm (Fig. 1C). It showed an about 13-fold fluorescence enhancement upon addition of 40 μM H2O2, and the fluorescence quantum yield increased from 0.0087 to 0.11. Moreover, two linear regressions were obtained between the fluorescence intensity at 555 nm and the H2O2 concentration in the range of 15–40 μM and 0.5–15 μM with a detection limit of 80 nM (Fig. S1†). For ER-H2O2, upon addition of H2O2, the maximum emission peak exhibited a 100 nm red shift from about 458 nm to 558 nm when excited at 400 nm, which makes ER-H2O2 suitable for ratiometric detection due to the introduction of an electron-donating oxygen anion (Fig. 1D). It displayed an about 19-fold fluorescence enhancement at 558 nm upon addition of 200 μM H2O2, and the fluorescence quantum yield increased from 0.007 to 0.24. The ratio F558/F458 increased from 0.161 to 3.639 in the absence and presence of H2O2 (200 μM). There was good linearity between the fluorescence intensity ratio, F558/F458, and the concentrations of H2O2 in the range of 0 to 40 μM with a detection limit of 120 nM (Fig. S2†). The detection limit of MI-H2O2 and ER-H2O2 was favorable and comparable to many previously reported H2O2 sensors.43 All these results indicated that MI-H2O2 and ER-H2O2 could detect H2O2 with excellent sensitivity.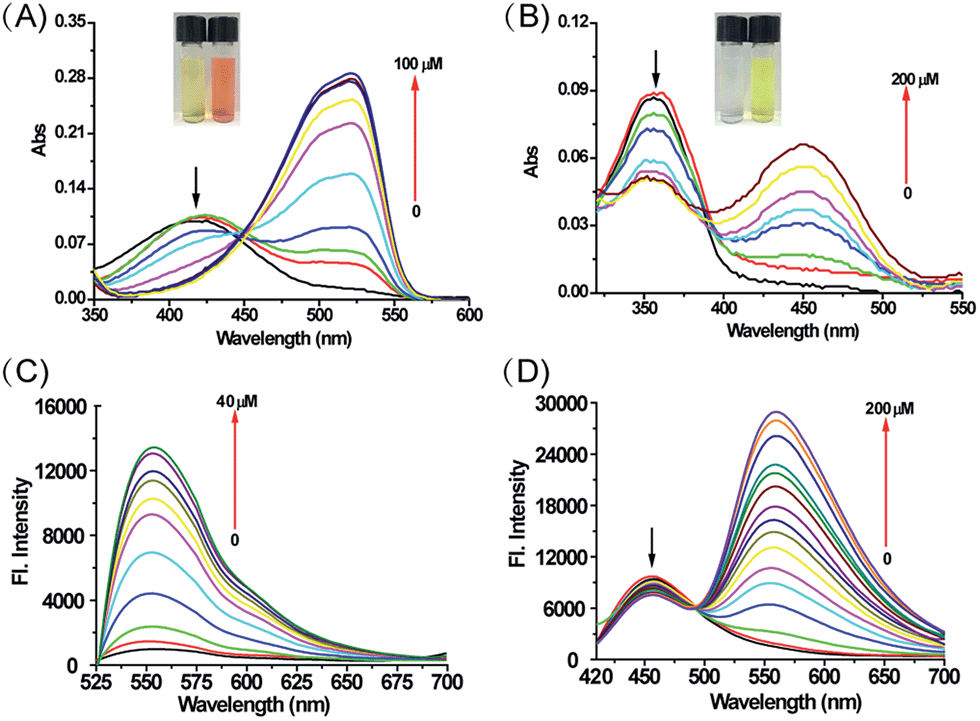 | ||
| Fig. 1 The absorption and fluorescence spectra changes of MI-H2O2 (A and C) and ER-H2O2 (B and D) to H2O2. The excitation wavelength was 525 nm or 400 nm for MI-H2O2 and ER-H2O2, respectively. Inset: color changes of MI-H2O2 and ER-H2O2 solution (50 μM) in the absence or presence of H2O2 (500 μM). | ||
The selectivity and reaction kinetics
Afterwards we evaluated the selectivity of these two probes towards other ROS and metal ions. As illustrated in Fig. S3 and S4,† almost no fluorescence intensity and ratio changes were observed in the presence of NaClO, OH˙, O2˙−, TBHP, ONOO−, and other common metal ions for MI-H2O2 and ER-H2O2. In addition, the response kinetic studies for the reactions and photostable experiments were examined in Fig. S5 and S6.† The pseudo-first-order rate constants were determined as k′ = 4.35 × 10⁻³ S−1 and 2.35 × 10⁻³ S−1 for the reaction of MI-H2O2 and ER-H2O2 with 100 equiv. of H2O2 respectively. All of the above experiments imply that both MI-H2O2 and ER-H2O2 possess high selectivity and reaction speed to H2O2 as well as excellent photostability before and after reaction with H2O2.Organelle-targeting ability of MI-H2O2 and ER-H2O2
Subsequently, the subcellular distribution of MI-H2O2 and ER-H2O2 in HepG2 cells were studied. As shown in Fig. 2A–D, fluorescence of MI-H2O2 was well co-localized with that of Mito-Tracker Deep Red (overlap coefficient 0.90), the commercial mitochondria-specific dye, which demonstrated that MI-H2O2 exhibited excellent mitochondria-targeting abilities that are attributable to the lipophilic cationic merocyanine moiety. At the same time, the commercial specific staining probe ER-Tracker Red was used to co-stain live cells with ER-H2O2. As displayed in Fig. 2E–H, the fluorescence of ER-H2O2 was well co-localized with that of ER-Tracker Red with an overlap coefficient of 0.91. The results verified our design and implied a preferential distribution of MI-H2O2 and ER-H2O2 into the mitochondria and ER, respectively. Furthermore, the intrinsic organelle-targeting ability of MI-H2O2 and ER-H2O2 was investigated in 4T1 cells. A consistent and perfect targeting capability was found (Fig. S7†). In addition, the MTT assay indicated MI-H2O2 and ER-H2O2 had low cytotoxicity (Fig. S8†).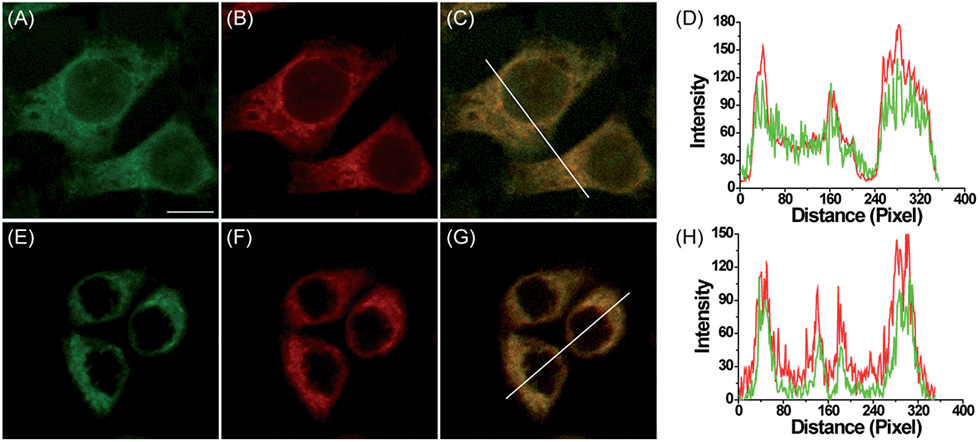 | ||
| Fig. 2 Confocal fluorescence images of HepG2 cells stained with MI-H2O2 or ER-H2O2 with corresponding commercial organelle-specific dyes. (A) Fluorescence image of MI-H2O2 (10 μM, green channel, Ex = 514 nm, collected 520–580 nm) in cells pretreated with 200 μM H2O2 for 60 min. (B) Fluorescence image of Mito-Tracker Deep Red (0.5 μM, red channel, Ex = 633 nm, collected 640–700 nm). (C) Overlay of (A) and (B). (D) Intensity profile of the white line in image C. (E) Fluorescence image of ER-H2O2 (10 μM, green channel, Ex = 405 nm, collected 500–620 nm) in cells pretreated with 200 μM H2O2 for 60 min. (F) Fluorescence image of ER-Tracker Red (0.5 μM, red channel, Ex = 543 nm, collected 580–630 nm). (G) Overlay of (E) and (F). (H) Intensity profile of the white line in image G. Scale bar: 10 μm. | ||
With these two excellent organelle-targeting probes in hand, we next intended to explore their optical performance in live cells. To completely avoid the spectral overlap for confocal fluorescence imaging, we chose 543 nm as excitation wavelength for MI-H2O2. It is because ER-H2O2 cannot be excited at 543 nm, but can be easily excited by 405 nm. In stark contrast, fluorescence enhancement of MI-H2O2 by H2O2 can be readily excited by 543 nm but not 405 nm (Fig. S9†). This enabled multicolor fluorescence imaging simultaneously utilizing ER-H2O2 and MI-H2O2 by excitation wavelengths of 405 and 543 nm, respectively. Therefore, we performed the confocal fluorescence imaging of H2O2 in live cells with both ER-H2O2 and MI-H2O2. After treating with 200 μM H2O2 for 1 h, HepG2 cells were incubated with ER-H2O2 and MI-H2O2 for 1 h, and the probes can fluoresce well under excitation of 405 and 543 nm. As shown in Fig. 3E, there is basically no overlap fluorescence between the green channel of ER-H2O2 (image A, excited by 405 nm and collected at 500–620 nm) and the red channel of MI-H2O2 (image C, excited by 543 nm and collected at 550–600 nm). An enlarged image from Fig. 3E indicated it indeed exhibited remarkable intensity difference in these two images (Fig. 3F). All the date established ER-H2O2 and MI-H2O2 have differentiable excitation and emission spectra and enable multicolor fluorescence imaging of exogenous H2O2 in the mitochondria and the ER simultaneously.
 | ||
| Fig. 3 Confocal fluorescence images of live HepG2 cells stained simultaneously with ER-H2O2 and MI-H2O2 (10 μM). ER-H2O2 was excited by 405 nm, and collected at 500–620 nm for the green channel (image A) and at 430–470 nm for the blue channel (image B). MI-H2O2 was excited by 543 nm, and collected at 550–600 nm for the red channel (image C). (D) was the bright-field image. (E) was overlay of (A) and (C). (F) was the enlarged image from the square marked in image (E). Scare bar: 20 μm. | ||
Endogenous H2O2 imaging in live cells with MI-H2O2 and ER-H2O2
We next visualized the endogenous H2O2 in live cells induced by different stimulus in the mitochondria and the ER respectively. Phorbol 12-myristate 13-acetate (PMA) may trigger production of ROS in mitochondria via activating of PKC (protein kinase C).44via The fluorescence of MI-H2O2 increased obviously upon addition of PMA for 60 min (Fig. S10A†). Tunicamycin (Tm) produced by several bacteria, is known to inhibit glycosylation during protein or glycolipid synthesis, which can cause the accumulation of proteins or lipids in the ER, leading to acute ER stress.45 To image the endogenous production of H2O2 in live cells by utilizing ER-H2O2 in this condition, we performed the ratiometric fluorescence imaging of Tm-treated HepG2 cells. As illustrated in Fig. S10B,† Tm-treated (10 μg mL−1, 8 h) cells showed obviously bright fluorescence in the green channel compared to that of DMSO-treated cells (Fig. S10B6 and B2†). The ratiometric image between the two channels (green to blue) further validated that H2O2 was produced in this Tm-induced ER stress model (Fig. S10B7 and B3†). The similar results were observed in the mouse 4T1 cells (Fig. S11†). In addition, ER-H2O2 was utilized to detect the production of H2O2 in live cells treated with dithiothreitol (DTT), a reducing agent that can disturb the formation of protein disulfide bonds and induce ER stress.46,47 The results presented in Fig. S12† displayed that there was an obvious fluorescence increase in the green channel, indicating a rise in the H2O2 concentration. Furthermore, to explore whether there is a burst of H2O2 concentration in live cells treated with anticancer drugs targeting the ER, ER-H2O2 was applied for fluorescence imaging in live HepG2 cells treated with nelfinavir, a lead HIV protease inhibitor and broad-spectrum anticancer drug that can lead to ER stress.48–50 As shown in Fig. S13,† upon treated with 200 μg mL−1 nelfinavir for 160 min, the fluorescence intensity of the green channel increased (Fig. S13B and F†) and the ratio between the green channel and the blue channel was higher (Fig. S13C and G†). Additionally, the cells showed shrinking morphological changes (Fig. S13D and H†), indicating the apoptosis of cells involved in the ER-stress pathway. At the same time, a similar experimental result was observed in the nelfinavir-induced 4T1 cells (Fig. S14†). Collectively, all this data demonstrated that MI-H2O2 and ER-H2O2 can image endogenous H2O2 well in the corresponding subcellular organelles under different stimuli.Simultaneous fluorescence imaging of H2O2 with MI-H2O2 and ER-H2O2 during apoptosis with different stimuli
In an effort to explore the practicability of ER-H2O2 and MI-H2O2 for the simultaneous imaging of H2O2 in live cells, we first carried out fluorescence imaging of H2O2 in 4T1 cells treated with apoptotic stimulant i.e.L-buthionine sulfoximine (BSO). BSO is an inhibitor of gamma glutamyl cysteine synthetase (γGCS), which can induce a decline of glutathione (GSH) and increase of ROS within the whole cell that further results in cell apoptotic behavior.51 The 4T1 cells were simultaneously incubated with ER-H2O2 and MI-H2O2 for 30 min at 37 °C. Then, the cells were washed three times with PBS after the incubation medium was removed. BSO (5 mM) was added to induce apoptosis. As shown in Fig. 4, when the 4T1 cells were treated with BSO for various times, the fluorescence intensity of ER-H2O2 (green channel) and MI-H2O2 (red channel) gradually elevated simultaneously, implying the H2O2 concentration increased in both mitochondria and ER. At the same time, the shrinking morphologic changes of cells were observed, indicating the occurrence of apoptosis. A similar result was found in the HepG2 cells incubated with higher concentrations of BSO at different times (Fig. S15†). These results displayed that H2O2 levels both in the mitochondria and ER would rise during BSO induced apoptosis, presumably because attenuation of cellular GSH levels induced by BSO disturbed the cellular redox status.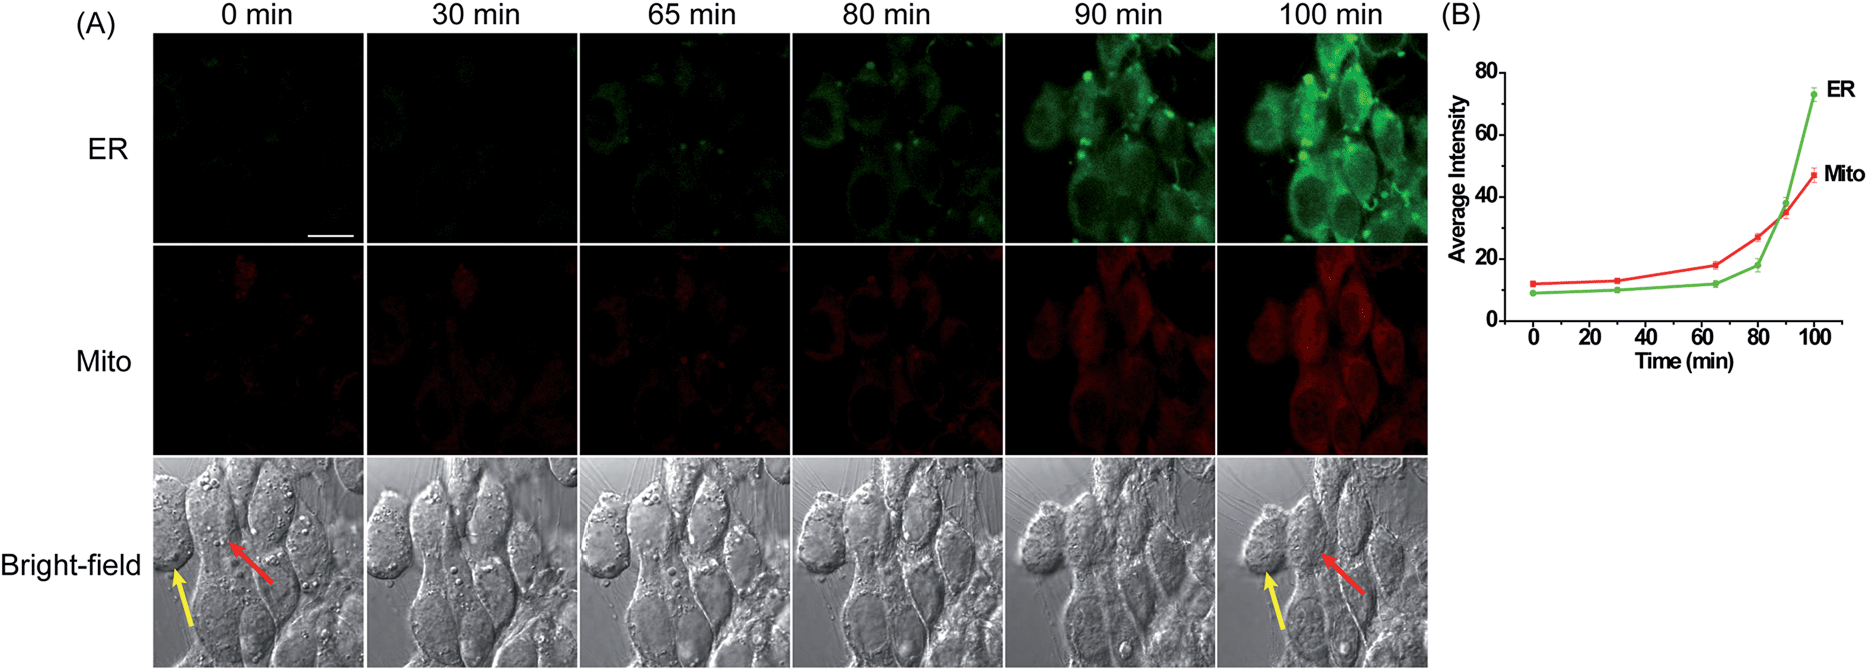 | ||
| Fig. 4 (A) Confocal fluorescence images of 4T1 cells stained simultaneously with ER-H2O2 and MI-H2O2 (10 μM) in the presence of BSO (5 mM) at different times. The first row (green channel) contains fluorescence images for ER-H2O2 collected at 500–620 nm by excitation at 405 nm. The second row (red channel) contains fluorescence images for MI-H2O2 collected at 550–600 nm by excitation at 543 nm. The third row contains bright-field images. (B) The output of average fluorescence intensity changes in image A at different times. Scale bar: 20 μm. | ||
Inspired by the above interesting results, we next intended to investigate the synergistic variations of H2O2 levels within these two organelles in cells treated with organelle-specific apoptotic stimuli. We first examined the changes on H2O2 levels in HepG2 cells treated with carbonyl cyanide m-chlorophenylhydrazone (CCCP). CCCP, an un-coupler of mitochondrial photophosphorylation, can induce apoptosis through a mitochondria-dependent pathway by disturbing the mitochondrial membrane potential, which can increase ROS generation in mitochondria.52,53 To explore the variations of H2O2 levels in the ER under this stimulant, the HepG2 cells were simultaneously incubated with ER-H2O2 and MI-H2O2 for 30 min at 37 °C. Then, the cells were washed three times with PBS after the incubation medium was removed. CCCP (100 μM) was added to induce mitochondria-oriented apoptosis. As indicated in Fig. 5, when the HepG2 cells were treated with CCCP for various times, the fluorescence intensity of MI-H2O2 (red channel) gradually enhanced, indicating the elevation of H2O2 levels in the mitochondria under this stimulus. Whereas, the fluorescence intensity of ER-H2O2 (green channel) was weak for the first 20 min, indicating no rise of H2O2 in the ER under CCCP induced apoptosis in the initial stage. However, the persistent stimulus resulted in a moderate fluorescence increase of ER-H2O2, suggesting a rise of H2O2 in the ER. In addition, the fluorescence imaging of HepG2 cells induced by rotenone,54,55 an inhibitor of mitochondrial respiratory chain complex I, produced similar results. H2O2 levels remained elevated in the mitochondria and a delayed rise in H2O2 levels occurred in the ER (Fig. S16†). All of this data showed that H2O2 levels prominently and continuously increased in mitochondria during mitochondria-oriented apoptotic stimulus, and sustaining apoptosis led to a subsequent H2O2 rise in the ER. The reason presumably results from the fact that dysfunction of mitochondria may elicit interplay with other organelles,4 such as the ER, the lysosome, and the nucleus, which may promote the coordinated variation of active molecules or inter-organellar cross-talk.
 | ||
| Fig. 5 (A) Confocal fluorescence images of HepG2 cells stained simultaneously with ER-H2O2 and MI-H2O2 (10 μM) in the presence of CCCP (100 μM) at different times. The first row (green channel) contains fluorescence images for ER-H2O2 collected at 500–620 nm by the excitation at 405 nm. The second row (red channel) contains fluorescence images for MI-H2O2 collected at 550–600 nm by the excitation at 543 nm. The third row contains bright-field images. (B) The output of average fluorescence intensity changes in image (A) at different times. Scale bar: 25 μm. | ||
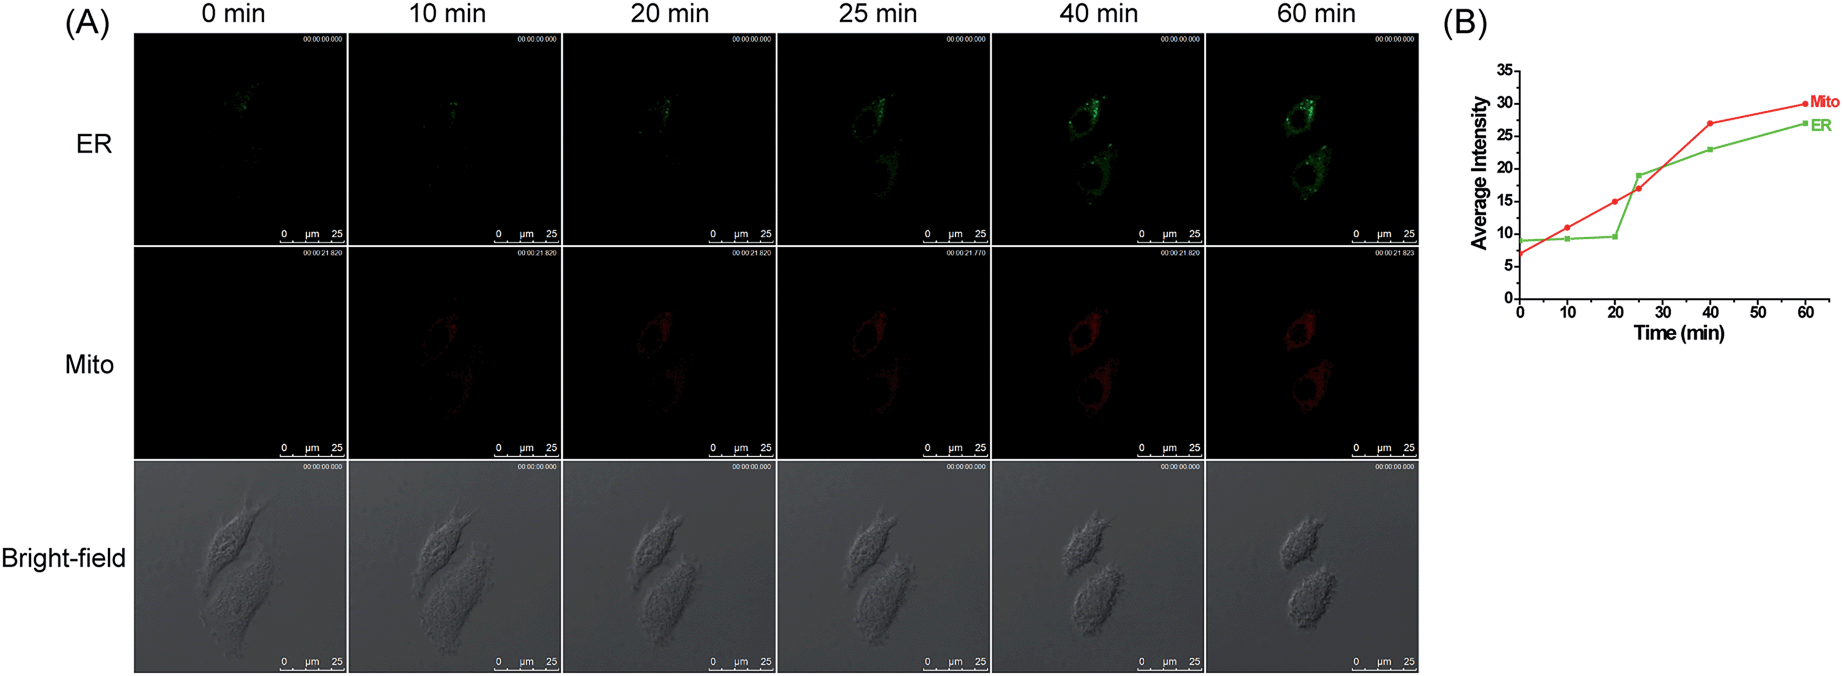
At last, ER-H2O2 and MI-H2O2 were utilized for simultaneous fluorescence imaging of H2O2 in 4T1 cells treated with Tm, an ER-oriented apoptotic stimulant. To explore whether the H2O2 levels would change in the mitochondria under this stimulant, the 4T1 cells were simultaneously incubated with ER-H2O2 and MI-H2O2 for 30 min at 37 °C. Then, cells were washed three times with PBS after the incubation medium was removed. Tm (100 μg mL−1) was added to induce ER-associated apoptosis. As illustrated in Fig. 6, when the 4T1 cells were treated with Tm for various times, the fluorescence intensity of ER-H2O2 (green channel) gradually enhanced from about 90 min after addition of Tm, indicating the rise of H2O2 concentration in the ER under this stimulus. In the meantime, the fluorescence intensity of MI-H2O2 was weak and almost stable within 120 min, and the fluorescence intensity increased progressively from 120 min to 200 min. All this data demonstrated that ER stress-derived apoptosis will upgrade H2O2 levels within the ER. Meanwhile, a delayed rise in H2O2 levels was observed in the mitochondria. We speculate that this phenomenon probably resulted from direct diffusion of H2O2 among different compartments56,57 or indirect generation in the mitochondria stimulated by calcium influx from the ER to the mitochondria during conditions of ER stress.58
 | ||
| Fig. 6 (A) Confocal fluorescence images of 4T1 cells stained simultaneously with ER-H2O2 and MI-H2O2 (10 μM) in the presence of Tm (100 μg mL−1) at different times. The first row (green channel) contains fluorescence images for ER-H2O2 collected at 500–620 nm by the excitation at 405 nm. The second row (red channel) contains fluorescence images for MI-H2O2 collected at 550–600 nm by the excitation at 543 nm. The third row contains bright-field images. (B) The output of average fluorescence intensity changes in image A at different times. Scale bar: 50 μm. | ||
Conclusions
In conclusion, we have presented the application of two organelle-targeting fluorescent probes termed MI-H2O2 and ER-H2O2 for imaging H2O2 in the mitochondria and the ER of live cells during apoptosis with real-time operability and reliability. The data shows that ER-H2O2 and MI-H2O2 can selectively and sensitively detect exogenous and endogenous H2O2 under a myriad of stimuli. More importantly, MI-H2O2 and ER-H2O2 display distinct excitation and emission spectra, which favors multicolor fluorescence imaging in live cells. By utilizing MI-H2O2 and ER-H2O2 for simultaneous fluorescence imaging of H2O2 in live cells, we found that the variations in H2O2 levels in the mitochondria and the ER were different during apoptosis induced by various stimuli. H2O2 levels were enhanced in both the mitochondria and the ER during the BSO-treated apoptosis process. During mitochondria-related apoptosis, H2O2 levels are prominently and consistently increased in the mitochondria, and subsequently H2O2 elevation was found in the ER. Whereas, during ER-associated apoptosis, the ER is the major site for overproduction of H2O2, while a delayed rise in H2O2 levels was also observed in the mitochondria. Although precise H2O2 biology during apoptosis involving the mitochondria and the ER should be further studied, this was the first example of simultaneous fluorescence imaging of H2O2 in the mitochondria and the ER during apoptosis. This may offer a useful platform for further elucidating the molecular mechanism of apoptosis regulated by different organelles.Acknowledgements
This work was supported by 973 Program (2013CB933800) and National Natural Science Foundation of China (21390411, 21535004, 21227005, and 21475079).Notes and references
- N. N. Danial and S. J. Korsmeyer, Cell, 2004, 116, 205–219 CrossRef CAS PubMed.
- S. Elmore, Toxicol. Pathol., 2007, 35, 495–516 CrossRef CAS PubMed.
- H. U. Simon, A. Haj-Yehia and F. Levi-Schaffer, Apoptosis, 2000, 5, 415–418 CrossRef CAS PubMed.
- K. F. Ferri and G. Kroemer, Nat. Cell Biol., 2001, 3, E255–E263 CrossRef CAS PubMed.
- J. A. Imlay, Annu. Rev. Biochem., 2008, 77, 755–776 CrossRef CAS PubMed.
- E. Cadenas and K. J. A. Davies, Free Radical Biol. Med., 2000, 29, 222–230 CrossRef CAS PubMed.
- M. Ott, V. Gogvadze, S. Orrenius and B. Zhivotovsky, Apoptosis, 2007, 12, 913–922 CrossRef CAS PubMed.
- T. Finkel and N. J. Holbrook, Nature, 2000, 408, 239–247 CrossRef CAS PubMed.
- A. Quillet-Mary, J. P. Jaffrezou, V. Mansat, C. Bordier, J. Naval and G. Laurent, J. Biol. Chem., 1997, 272, 21388–21395 CrossRef CAS PubMed.
- S. Tada-Oikawa, Y. Hiraku, M. Kawanishi and S. Kawanishi, Life Sci., 2003, 73, 3277–3288 CrossRef CAS PubMed.
- C. Fleury, B. Mignotte and J. Vayssière, Biochimie, 2002, 84, 131–141 CrossRef CAS PubMed.
- M. Giorgio, M. Trinei, E. Migliaccio and P. G. Pelicci, Nat. Rev. Mol. Cell Biol., 2007, 8, 722–728 CrossRef CAS PubMed.
- E. Gross, C. S. Sevier, N. Heldman, E. Vitu, M. Bentzur, C. A. Kaiser, C. Thorpe and D. Fass, Proc. Natl. Acad. Sci. U. S. A., 2006, 103, 299–304 CrossRef CAS PubMed.
- C. S. Sevier and C. A. Kaiser, Biochim. Biophys. Acta, 2008, 1783, 549–556 CrossRef CAS PubMed.
- G. S. Hotamisligil, Cell, 2010, 140, 900–917 CrossRef CAS PubMed.
- B. P. Tu and J. S. Weissman, J. Cell Biol., 2004, 164, 341–346 CrossRef CAS PubMed.
- É. Margittai, B. Enyedi, M. Csala, M. Geiszt and G. Bánhegyi, Free Radical Biol. Med., 2015, 83, 331–340 CrossRef PubMed.
- J. Chan, S. C. Dodani and C. J. Chang, Nat. Chem., 2012, 4, 973–984 CrossRef CAS PubMed.
- Y. Tang, D. Lee, J. Wang, G. Li, J. Yu, W. Lin and J. Yoon, Chem. Soc. Rev., 2015, 44, 5003–5015 RSC.
- J. Yin, Y. Hua and J. Yoon, Chem. Soc. Rev., 2015, 44, 4619–4644 RSC.
- T. Terai and T. Nagano, Curr. Opin. Chem. Biol., 2008, 12, 515–521 CrossRef CAS PubMed.
- D. Srikun, A. E. Albers, C. I. Nam, A. T. Iavaron and C. J. Chang, J. Am. Chem. Soc., 2010, 132, 4455–4465 CrossRef CAS PubMed.
- L. Yang, N. Li, W. Pan, Z. Yu and B. Tang, Anal. Chem., 2015, 87, 3678–3684 CrossRef CAS PubMed.
- B. C. Dickinson and C. J. Chang, J. Am. Chem. Soc., 2008, 130, 9638–9639 CrossRef CAS PubMed.
- B. C. Dickinson, D. Srikun and C. J. Chang, Curr. Opin. Chem. Biol., 2010, 14, 50–56 CrossRef CAS PubMed.
- B. C. Dickinson, V. S. Lin and C. J. Chang, Nat. Protoc., 2013, 8, 1249–1259 CrossRef PubMed.
- G. Masanta, C. H. Heo, C. S. Lim, S. K. Bae, B. R. Cho and H. M. Kim, Chem. Commun., 2012, 48, 3518–3520 RSC.
- H. Guo, H. Aleyasin, S. S. Howard, B. C. Dickinson, V. S. Lin, R. E. Haskew-Layton, C. Xu, Y. Chen and R. R. Ratan, J. Biomed. Opt., 2013, 18, 106002–106007 CrossRef PubMed.
- J. Xu, Y. Zhang, H. Yu, X. Gao and S. Shao, Anal. Chem., 2015, 1–19 Search PubMed.
- D. Kim, G. Kim, S. J. Nam, J. Yin and J. Yoon, Sci. Rep., 2015, 5, 8488 CrossRef CAS PubMed.
- D. Song, J. M. Lim, S. Cho, S. J. Park, J. Cho, D. Kang, S. G. Rhee, Y. You and W. Nam, Chem. Commun., 2012, 48, 5449–5451 RSC.
- M. Ren, B. Deng, J. Y. Wang, X. Kong, Z. R. Liu, K. Zhou, L. He and W. Lin, Biosens. Bioelectron., 2015, 79, 237–243 CrossRef PubMed.
- J. Jing and J. L. Zhang, Chem. Sci., 2013, 4, 2947–2952 RSC.
- B. C. Dickinson, Y. Tang, Z. Chang and C. J. Chang, Chem. Biol., 2011, 18, 943–948 CrossRef CAS PubMed.
- Y. Wen, K. Y. Liu, H. R. Yang, Y. Li, H. C. Lan, Y. Liu, X. Y. Zhang and T. Yi, Anal. Chem., 2014, 86, 9970–9976 CrossRef CAS PubMed.
- D. Srikun, E. W. Miller, D. W. Domaille and C. J. Chang, J. Am. Chem. Soc., 2008, 130, 4596–4597 CrossRef CAS PubMed.
- B. C. Dickinson, C. Huynh and C. J. Chang, J. Am. Chem. Soc., 2010, 132, 5906–5915 CrossRef CAS.
- A. E. Albers, V. S. Okreglak and C. J. Chang, J. Am. Chem. Soc., 2006, 128, 9640–9641 CrossRef CAS PubMed.
- M. C. Y. Chang, A. Pralle, E. Y. Isacoff and C. J. Chang, J. Am. Chem. Soc., 2004, 126, 15392–15393 CrossRef CAS PubMed.
- E. W. Miller, A. E. Albers, A. Pralle, E. Y. Isacoff and C. J. Chang, J. Am. Chem. Soc., 2005, 127, 16652–16659 CrossRef CAS PubMed.
- A. T. Hoye, J. E. Davoren and P. Wipf, Acc. Chem. Res., 2008, 41, 87–97 CrossRef CAS PubMed.
- B. K. McMahon, R. Pal and D. Parker, Chem. Commun., 2013, 49, 5363–5365 RSC.
- K. Żamojć, M. Zdrowowicz, D. Jacewicz, D. Wyrzykowski and L. Chmurzyński, Crit. Rev. Anal. Chem., 2016, 46, 171–200 CrossRef PubMed.
- M. Alasubramanyam, A. Koteswari, R. Kumar, S. Monickaraj, J. Maheswari and V. Ohan, J. Biosci., 2003, 28, 715–721 CrossRef.
- T. Nakagawa, H. Zhu, N. Morishima, E. Li, J. Xu, B. A. Yankner and J. Yuan, Nature, 2000, 403, 98–103 CrossRef CAS PubMed.
- I. Braakman, J. Helenius and A. Helenius, EMBO J., 1992, 11, 1717–1722 CAS.
- F. Cusinato, I. Pighin, S. Luciani and L. Trevisi, Biochem. Pharmacol., 2006, 71, 1562–1569 CrossRef CAS PubMed.
- P. Pyrko, A. Kardosh, W. Wang, W. Xiong, A. H. Schonthal and T. C. Chen, Cancer Res., 2007, 67, 10920–10928 CrossRef CAS PubMed.
- J. J. Gills, J. Lopiccolo, J. Tsurutani, R. H. Shoemaker, C. J. Best, M. S. Abu-Asab, J. Borojerdi, N. A. Warfel, E. R. Gardner, M. Danish, M. C. Hollander, S. Kawabata, M. Tsokos, W. D. Figg, P. S. Steeg and P. A. Dennis, Clin. Cancer Res., 2007, 13, 5183–5194 CrossRef CAS PubMed.
- J. J. Gills, J. LoPiccolo and P. A. Dennis, Autophagy, 2015, 4, 107–109 CrossRef.
- J. S. Armstrong, K. K. Steinauer, B. Hornung, J. M. Irish, P. Lecane, G. W. Birrell, D. M. Peehl and S. J. Knox, Cell Death Differ., 2002, 9, 252–263 CrossRef CAS PubMed.
- R. A. Goldsby and P. G. Heytler, Biochemistry, 1963, 2, 1142–1147 CrossRef CAS PubMed.
- A. A. Chaudhari, J. W. Seol, S. J. Kim, Y. J. Lee, H. S. Kang, I. S. Kim, N. S. Kim and S. Y. Park, Oncol. Rep., 2007, 18, 71–76 CAS.
- N. Li, K. Ragheb, G. Lawler, J. Sturgis, B. Rajwa, J. A. Melendez and J. P. Robinson, J. Biol. Chem., 2003, 278, 8516–8525 CrossRef CAS PubMed.
- S. Tada-Oikawa, Y. Hiraku, M. Kawanishi and S. Kawanishi, Life Sci., 2003, 73, 3277–3288 CrossRef CAS PubMed.
- M. Malinouski, Y. Zhou, V. V. Belousov, D. L. Hatfield and V. N. Gladyshev, PLoS One, 2011, 6, e14564 CAS.
- B. Chance, H. Sies and A. Boveris, Physiol. Rev., 1979, 59, 527–605 CAS.
- S. S. Cao and R. J. Kaufman, Antioxid. Redox Signaling, 2014, 21, 396–413 CrossRef CAS PubMed.
Footnote |
| † Electronic supplementary information (ESI) available: Detailed experimental procedures, characterization of compounds, some fluorescence images. See DOI: 10.1039/c6sc01793b |
| This journal is © The Royal Society of Chemistry 2016 |