
 Open Access Article
 This Open Access Article is licensed under a Creative Commons Attribution-Non Commercial 3.0 Unported Licence
The rational design of specific SOD1 inhibitors via copper coordination and their application in ROS signaling research†
Xiongwei
Dong‡
,
Zhe
Zhang‡
,
Jidong
Zhao
,
Juan
Lei
,
Yuanyuan
Chen
,
Xiang
Li
,
Huanhuan
Chen
,
Junli
Tian
,
Dan
Zhang
,
Chunrong
Liu
* and
Changlin
Liu
*
Key Laboratory of Pesticide & Chemical Biology, Ministry of Education, School of Chemistry, Central China Normal University, Wuhan 430079, Hubei, China. E-mail: liuchl@mail.ccnu.edu.cn; liucr@mail.ccnu.edu.cn
First published on 16th June 2016
Abstract
Efficient methods for the regulation of intracellular O2˙− and H2O2 levels, without altering intracellular processes, are urgently required for the rapidly growing interest in ROS signaling, as ROS signaling has been confirmed to be involved in a series of basic cellular processes including proliferation, differentiation, growth and migration. Intracellular H2O2 is formed mainly via the catalytic dismutation of O2˙− by SODs including SOD1, SOD2 and SOD3. Thus, the intracellular levels of O2˙− and H2O2 can directly be controlled through regulating SOD1 activity. Here, based on the active site structure and catalytic mechanism of SOD1, we developed a new type of efficient and specific SOD1 inhibitors which can directly change the intracellular levels of H2O2 and O2˙−. These inhibitors inactivate intracellular SOD1 via localization into the SOD1 active site, thereby coordinating to the Cu2+ in the active site of SOD1, blocking the access of O2˙− to Cu2+, and breaking the Cu2+/Cu+ catalytic cycle essential for O2˙− dismutation. The reduced ERK1/2 phosphorylation induced by the specific SOD1 inactivation-mediated decrease of intracellular H2O2 levels reveals the potential of these specific SOD1 inhibitors in understanding and regulating ROS signaling. Furthermore, these specific SOD1 inhibitors also lead to selectively elevated cancer cell apoptosis, indicating that these kinds of SOD1 inhibitors might be candidates for lead compounds for cancer treatment.
Introduction
Reactive oxygen species (ROS) are formed upon incomplete reduction of dioxygen and include the superoxide anion (O2˙−), hydrogen peroxide (H2O2) and the hydroxyl radical (HO˙). Over the past two decades, physiological roles of H2O2 and perhaps O2˙− have been established in cell signaling and transcription regulation. Diverse signaling pathways regulated by ROS include extracellular signal-regulated kinase1/2 (ERK1/2), nuclear factor κB (NF-κB), c-Jun N-terminal kinase (JNK), focal adhesion kinase (FAK), hypoxia-inducible factor (HIF), AP-1, Nrf2, PI3K/Akt, Ras, Rac, HIP, and JAK-STAT.1–5 A current concept is that ROS regulate the signaling pathways triggered by both cytokines and transcription factors that ultimately control cell proliferation and differentiation, all of which are important hallmarks of tumorigenesis and angiogenesis.6–9 Furthermore, ROS act as a mediator of inflammation in neurodegeneration via regulation of the signaling pathways including NF-κB and AP-1.10 Thus, ROS regulation of signaling pathways has attracted much interests and research.1–12 Although the research on ROS signaling in the past two decades has rapidly shaped our understanding of a range of topics, including metabolic regulation, innate immunity, stem cell biology, pathogenesis of related diseases such as cancer, and aging, questions still remain: e.g., the question of how and at which level the intracellular ROS can function within various signaling pathways, and whether controlling intracellular ROS levels could be used in the treatment of related diseases. To provide answers to these questions, an efficient method for controlling intracellular ROS levels (especially H2O2) without altering cellular processes is required. Furthermore, there are also several drawbacks to be overcome in current ROS signaling research. First, because the signaling regulation is dependent on the concentration of H2O2, the research is always carried out via direct exposure of cells to external H2O2 at concentrations much higher than the intracellular basal levels of H2O2.13–24 Evidently, the external H2O2 of high concentrations can notably interfere with many normal cellular processes. Then, growth factors are used to stimulate cells to produce high levels of ROS, but they can also alter the expression of many genes in the cells.20,25–27 It is possible that the stimulation with either external H2O2 or growth factors leads the treated cells to produce artificial phenomena. Therefore, if the intracellular ROS level can directly be altered without these two kinds of external stimulations, it is possible to avoid certain artificial phenomena in both the understanding and regulation of ROS signaling.The signaling species H2O2 is formed via the catalytic dismutation of O2˙− (with a rate constant up to 109 M−1 s−1) mainly by copper/zinc superoxide dismutase (SOD1), a key antioxidant enzyme that is widely distributed in a cell.28,29 This indicates that the intracellular ROS levels can be controlled by regulating SOD1 activity, i.e., ROS signaling can be regulated by inhibiting or elevating SOD1 activity because of the dependence of the signaling regulation on intracellular ROS levels.14–27 Indeed, SOD1 is essential for H2O2-mediated oxidation and inactivation of protein tyrosine phosphatases (PTPs) in growth factor signaling,30 and can integrate signals from oxygen and glucose to repress respiration with its normal enzymatic activity.31 Both too high and too low SOD1 activities can lead to aberrant cellular ROS signaling that is linked to inflammation, amyotrophic lateral sclerosis (ALS), malignant cell proliferation, tumorigenesis and angiogenesis,32–35 which makes the enzyme a key target for drug design for cancer and ALS therapy.36,37 Moreover, controlling the intracellular SOD1 activity is essential to address the long-standing problem that intracellular ROS levels can't be directly regulated without external stimulation in the research and regulation of ROS signaling.
SOD1 activity can be inhibited by either SOD1 siRNAs or small molecular inhibitors. Although the siRNAs can specifically reduce the expression of the SOD1 protein via targeting SOD1 mRNA, their inhibition efficacy is limited.30 Several small molecular inhibitors of SOD1 have been developed and can be divided into two classes: the chelators that target the copper ion in the active site of SOD1, because each subunit in the homodimeric enzyme hosts a copper ion responsible for its function; and the organic molecules that bind to other sites in SOD1, e.g., 4,5-dichloro-2-m-tolyl pyridazin-3(2H)-one (LCS-1).37 Among these inhibitors, diethyldithiocarbamate (DDC) and tetrathiomolybdate (TM) are two of the most studied kinds of copper-chelating inhibitors of SOD1. On the one hand, in vitro tests showed that DDC and its derivatives can efficiently inhibit SOD1 at more than millimolar concentrations, but whether they can specifically inactivate SOD1 activity or not remains to be explored.38–42 On the other hand, TM was found to efficiently inhibit SOD1 via partially removing copper from the enzyme.43,44 The TM inhibition of SOD1 leads to the down-regulation of growth factor-mediated phosphorylation of ERK1/2 (ref. 30), and the expression of both cytokines and transcription factors such as NF-κB.45,46 A derivative of TM (ATN-224) was reported to efficiently suppress angiogenesis and tumor growth through targeting SOD1,47–49 and is being tested in phase I and II clinical studies as an anticancer drug.45–50 However, in addition to inhibition of SOD1, TM can also inactivate a series of copper enzymes including cytochrome c oxidase (CcO), ascorbate oxidase, ceruloplasmin, tyrosinase, and the Enterococcus hirae adenosine triphosphatase, and binds to copper ions in metallothioneins.51–53 Moreover, the copper trafficking essential for normal cellular functions is blocked by the formation of a TM–Cu cluster in the copper chaperone Atox1, rather than by the removal of copper from Atox1.54 In addition, the antibiotic clioquinol was also reported to be capable of inhibiting SOD1 in solutions, but without evidence to exclude other intracellular targets.55 Thus, the development of specific and effective inhibitors of SOD1 is urgently required not only for the research into and regulation of ROS signaling, but also for the design of drugs targeting SOD1.
Here, based on the copper coordination chemistry and catalytic cycle in the active site of SOD1, for the first time to our knowledge, a series of specific copper-coordinating inhibitors of SOD1 were designed by combining phenol, thiosemicarbazone, pyridine derivatives, and chromone. The IC50 values for the inhibition of intracellular SOD1 activity approach nano-molar levels, and the SOD1 activity within the treated cells can be reduced to ≤20% of that within the untreated cells. Furthermore, the activity of not only the copper enzymes including CcO and tyrosinase, but also the copper trafficking proteins including Atox1 is completely unaffected by these inhibitors. The inhibition of SOD1 leads to reduced intracellular H2O2 and increased intracellular O2˙− levels. These alterations in the intracellular ROS levels are correlated well with the reduction of ERK1/2 phosphorylation, a key step in the mitogen-activated protein kinase (MAPK) pathway. Thus, this study established the power of this kind of specific SOD1 inhibitor in the understanding and regulation of ROS signaling. Moreover, these inhibitors also promote apoptosis of cancer cells, revealing their potential to be harnessed as anti-cancer leading structures.
Results and discussion
Design of the copper-coordinating inhibitors of SOD1
When copper-coordinating inhibitors of SOD1 are designed based on both the copper coordination chemistry and the catalytic cycle in the active site of the enzyme (Fig. 1a),56 the pivotal factors to be considered include: (1) the stability constants of their copper complexes, which should be much higher than the affinity constant of SOD1 proteins for copper (Kd ∼ 10−16 M for Cu+,57 and ∼10−14 M for Cu2+ (ref. 43)); (2) their coordination to copper, which could block the cyclic redox reactions of copper with O2˙− in SOD1, and (3) their appropriate localization, which can not only prevent the access of O2˙− to the copper ion in SOD1 through the electrostatic channel with positive potential, but can also disrupt the noncovalent interactions between the Cu2+-bound O2˙− and the residue Arg141 in the catalytic cycle of SOD1.56 Based on these considerations, a series of Cu2+-chelating agents were designed via a combination of thiosemicarbazone and phenol or pyridine derivatives (Fig. 1b). The thiosemicarbazone contains a strongly copper-chelating and a H-bonding moiety –C(SH)–NH–. The thiosemicarbazone complexes formed with Cu2+ (e.g., CuATSM, ATSM = diacetyl(bis-N(4)-methylthiosemicarbazone)) have potential uses in chemotherapeutics, and diagnostic and therapeutic radiopharmaceuticals,58 whereas the phenolic hydroxyl or pyridine nitrogen in these chelators further facilitates the coordination of copper. To directly observe the entrance of the chelators into a cell, a fluorescent group chromone was covalently linked to the chelators (Fig. 1b, LD93, 94, 100).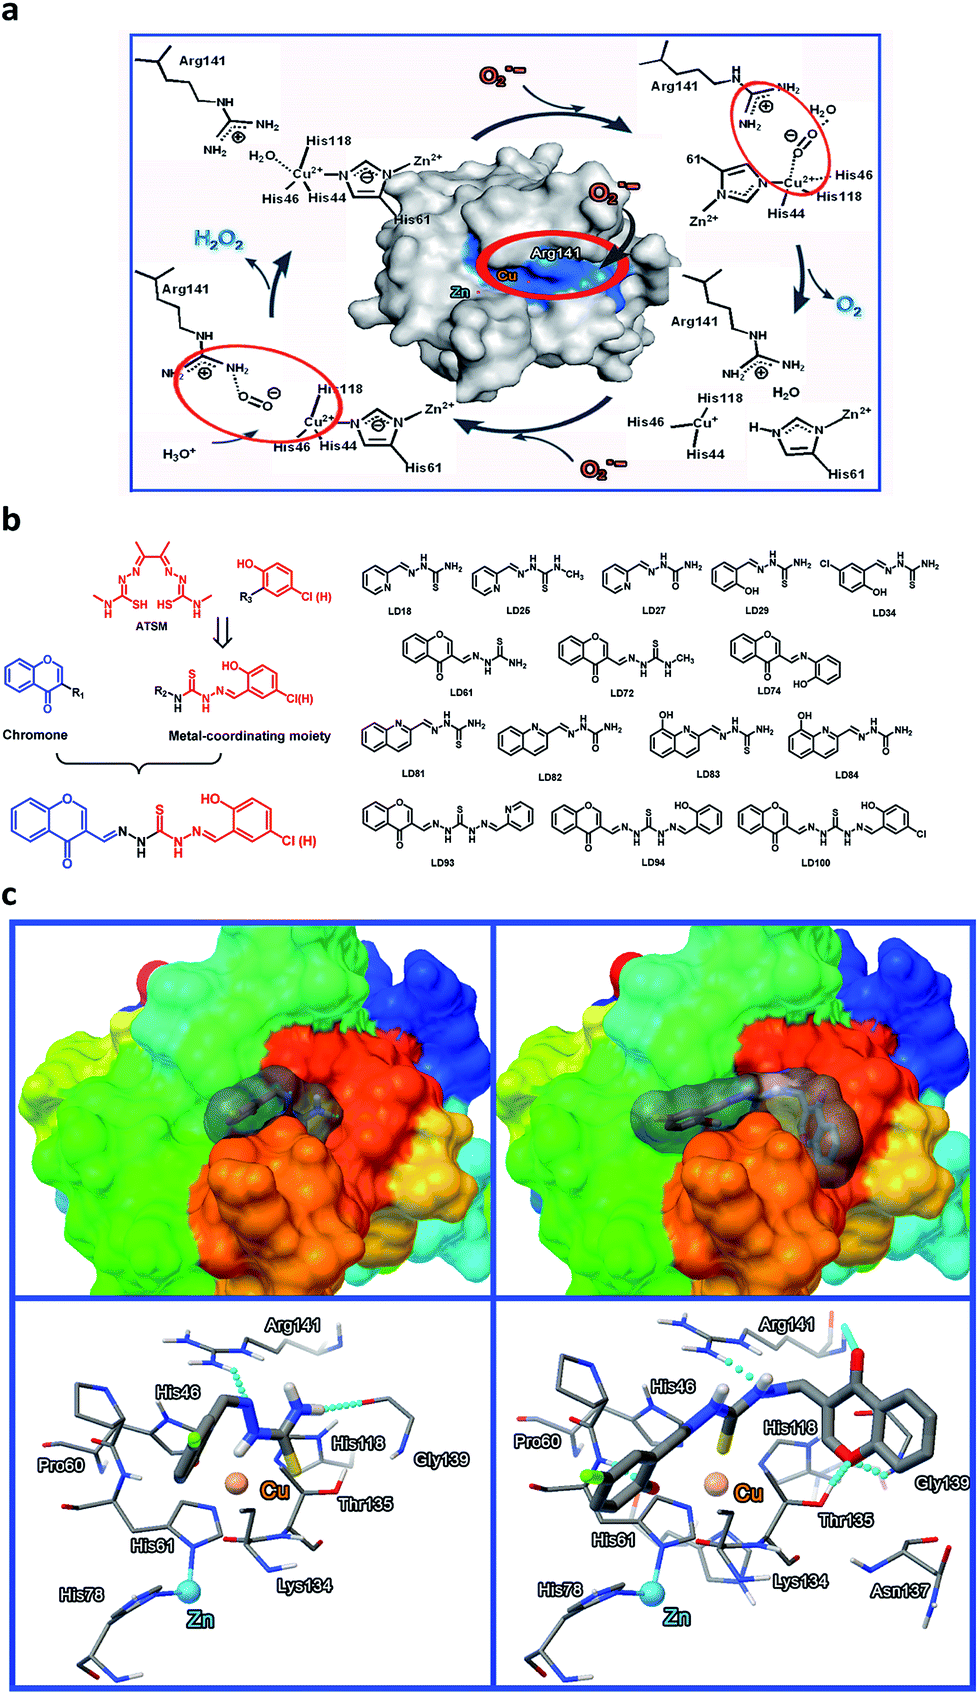 | ||
| Fig. 1 The design of SOD1 inhibitors. (a) The proposed inhibitor-targeted sites (blue) in the active site and catalytic cycle of SOD1 are indicated by the red circles. (b) The design strategy and representatives of the Cu2+-coordinating inhibitors of SOD1. (c) The proposed interactions between a SOD1 molecule and the inhibitor LD34 (left) or LD100 (right) based on molecular docking simulations. | ||
In order to obtain data to support this design, based on the SOD1 structural data (PDB SOD1, 1CBJ), molecular docking simulations were carried out using the AutoDock program (version 4.2.0). The well-docked clusters (RMSD, Root-Mean-Square Deviation < 2.0 Å) in the top-ranked poses were enumerated. The results indicate that the flexible chelator molecules can be localized into the active site in SOD1 because of their perfect match with both the active site and the substrate channel of SOD1 in both size and hydrophobicity, and this localization can be stabilized mainly via both the coordination of the sulfur atom in the chelators to Cu2+ in the SOD1 active site (Cu2+–S distances = 3.46–4.27 Å) and the H-bonds between the chelators and the SOD1 residues, in particular, the unexpected H-bonds between the LD100 chromone group and the SOD1 residues Thr135 and Gly139 (Fig. 1c). Obviously, this localization of the chelators can not only hinder the access of O2˙− to the active site Cu2+ ion, but can also disrupt the noncovalent interactions between the Cu2+-bound O2˙− and Arg141 because of the H-bonds between the chelator –NH– group and the residue Arg 141 (Fig. 1c).
Because the design strategy was supported by the molecular docking simulations, a series of copper chelators for the inhibition of SOD1 activity were synthesized and characterized (see ESI† for synthesis programs). The fluorescence properties and metal ion selectivity of the chelators modified with chromone are displayed in ESI Fig. 1.†
Characterization of coordination of the chelators to copper
The acidity constants of the chelators and the stability constants of their complexes formed respectively with Cu2+, Zn2+, Mn2+ and Fe2+ were determined via potentiometric titrations at 25 °C. The acidity constants (pKa1 to pKa4) of the chelators are listed in ESI Table 1.† The calculations performed using the titration data showed that (1) the Cu2+ complexes have large stability constants (KCu2+ ≥ 1018 M−1, i.e., Kd,Cu2+ ≤ 10−18 M, Table 1) when the chelators contain a sulfur atom as a coordination atom to Cu2+, and (2) covalent linking of the chromone can significantly elevate the coordination ability of the chelators (LD93, 94, 100). Evidently, these results demonstrated that the Cu2+ affinity of all of the designed chelators is much greater than the Cu2+ affinity of SOD1 proteins.43 In addition, the stability constants of the Cu2+ complexes are 1–3 orders of magnitude higher than those of the complexes with the other divalent metal ions tested (Table 1), indicating that the chelators have notable selectivity for Cu2+ over the other divalent metal ions tested.| Chelators | LD18 | LD25 | LD27 | LD29 | LD34 | LD93 | LD94 | LD100 |
|---|---|---|---|---|---|---|---|---|
log![[thin space (1/6-em)]](https://www.rsc.org/images/entities/char_2009.gif) KCu2+, n = 1, M−1 KCu2+, n = 1, M−1 |
19.90 | 18.43 | 16.74 | 17.97 | 19.12 | 19.46 | 20.01 | 20.06 |
| logKZn2+, n = 1, M−1 |
17.82 | 17.37 | 16.65 | 17.64 | 15.93 | 18.40 | 17.07 | 17.34 |
| logKMn2+, n = 1, M−1 |
17.62 | 15.89 | 16.11 | 15.20 | 16.62 | 16.66 | 16.20 | 16.30 |
| logKFe2+, n = 1, M−1 |
17.09 | 17.08 | 16.13 | 17.24 | 17.02 | 17.94 | 17.42 | 18.24 |
| K Cu2+/KZn2+ | 1.20 × 10² | 1.15 × 101 | 1.23 | 2.14 | 1.55 × 10³ | 1.15 × 101 | 8.71 × 10² | 5.25 × 10² |
| K Cu2+/KMn2+ | 1.91 × 10² | 3.47 × 10² | 4.27 | 5.89 × 10² | 3.16 × 10³ | 6.31 × 10² | 6.46 × 10³ | 5.75 × 10³ |
| K Cu2+/KFe2+ | 6.46 × 101 | 2.24 × 101 | 4.07 | 5.37 | 1.26 × 10² | 3.31 × 101 | 3.89 × 10² | 6.6 × 101 |
| pH range for Cu2+ complexes | 4–8 | 7–10 | 5–8 | 5–8 | 4–8 | 4–8 | 5–10 | 4–9 |
| ΔEp, mV | 0.137 | 0.130 | 0.135 | 0.132 | 0.159 | 0.123 | 0.172 | 0.155 |
| i pa/ipc | 0.21 | 0.18 | — | 0.19 | 0.15 | — | — | 0.071 |
| IC50, μM | 12.31 | 2.12 | 2.92 | 1.36 | 0.79 | 1.46 | 0.21 | 0.18 |
Solution speciation diagrams were calculated for the coordination of the chelators to Cu2+ (ESI Fig. 2†) using the stability constants (Table 1). These diagrams suggested that the 1:1 and 2:2 Cu2+–chelator complexes are the predominant species formed in the range of pH 5–8 (Table 1). This pH range requisite for the formation of stable complexes completely covers the pH range of the optimal SOD1 activity. The 1:1 and 2:2 complexes were confirmed by the X-ray crystal structures of the Cu2+ complexes formed with some of the chelators (ESI Fig. 3†).
In order to examine whether the coordination of the chelators can make the Cu2+ ion become redox-inactive, we observed the redox behavior of the Cu2+ complexes with cyclic voltammograms. The cyclic voltammograms of all of the complexes showed only a distinct cathode peak at ∼−0.3 V in anhydrous DMF at a glassy carbon working electrode (ESI Fig. 4,† see Table 1 for the separation data between the anode and cathode peak potentials), indicating that the Cu2+ ion in the complexes does not undergo a reversible redox process.59 Therefore, the binding of the chelators may partly disrupt the reversible redox cycle between Cu2+ and Cu+ of the chelated copper.
Inhibition of SOD1 activity
The above-described results indicated that the chelators could compete for the Cu2+ ion in the SOD1 active site via coordination. Thus, first, we determined the inhibition of bovine SOD1 activity caused by this competition for Cu2+ in pH 7.4 buffer. The results show that the treatment with 5 μM chelators for 60 min causes the SOD1 (1 μM) activity to be reduced to 16–40% of the control, whereas the SOD1 treated with either 5 μM ATSM or DDC, in comparison, maintains >60% activity under the conditions tested (Fig. 2a). Obviously, these data indicated that the chelators designed here are strong inhibitors of SOD1 under neutral conditions, and the inhibitory effect decreased in the order of LD100 > 94 ∼ 27 ∼ 29 ∼ 34 > 93 ∼ 74 ∼ 25 > 18 ∼ 61 ∼ 81 ∼ 82 > 72 ∼ 83 ∼ 84.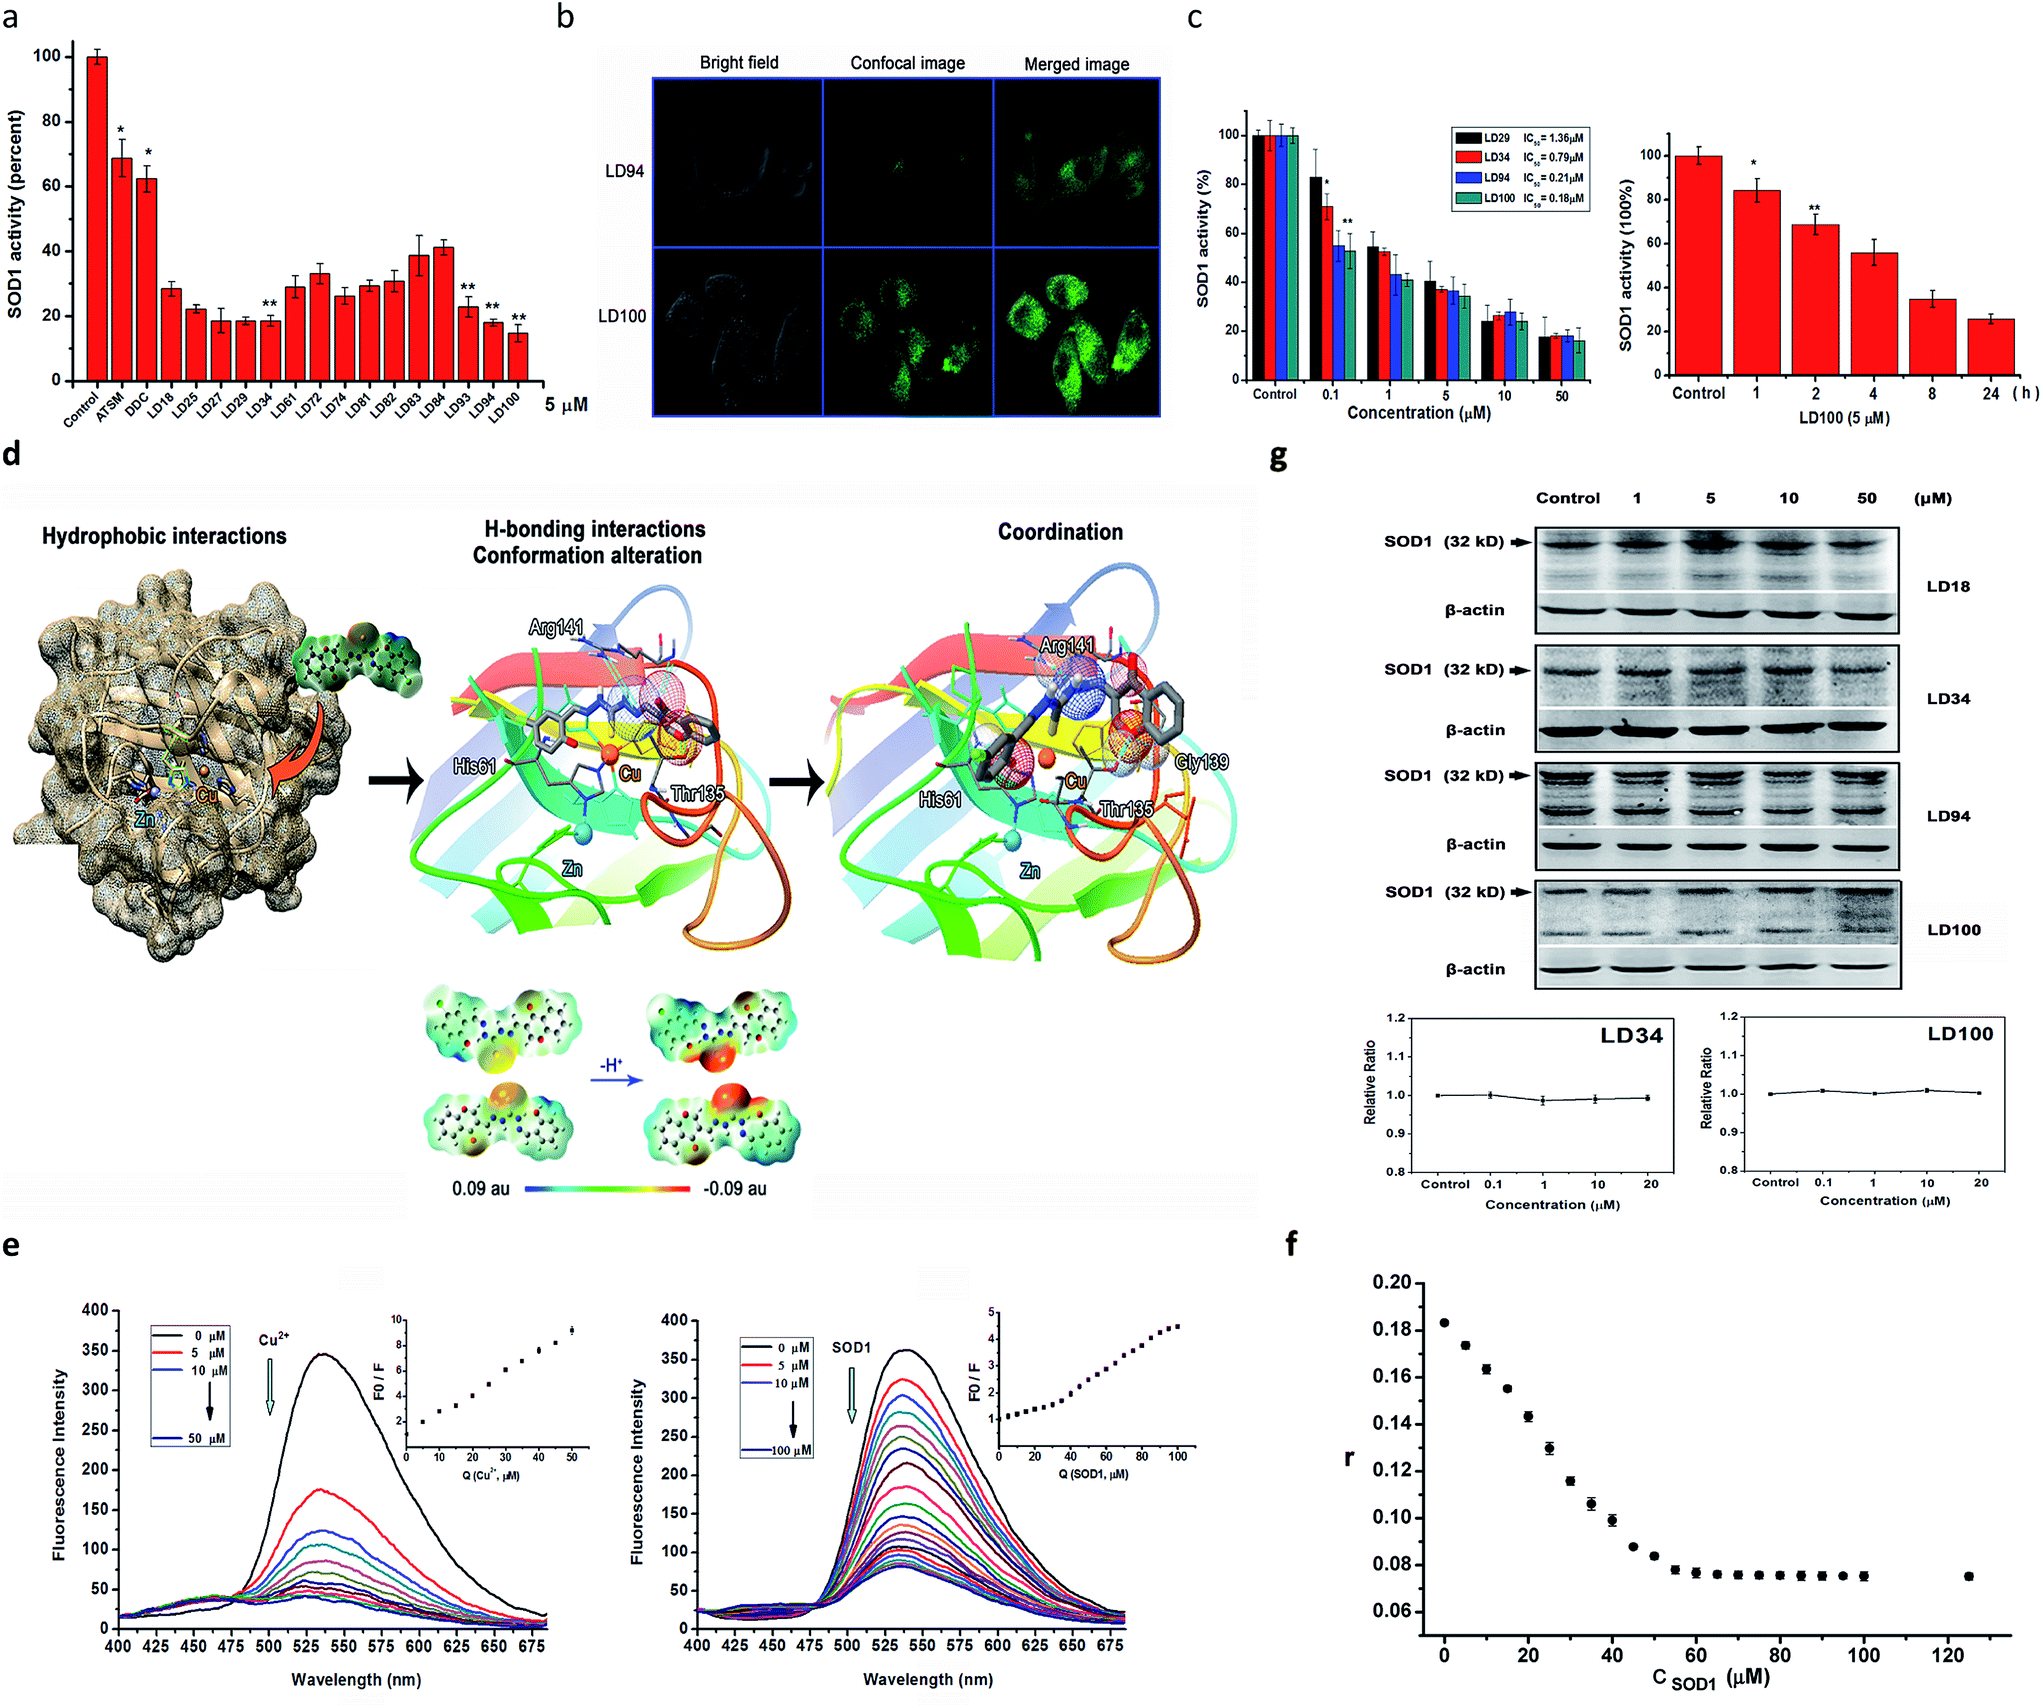 | ||
| Fig. 2 Characterizations of SOD1 inhibition. (a) Inhibition of the activity of 1 μM SOD1 by 5 μM of chelator, ATSM or DDC in the pH 7.4 buffer containing 1% DMSO. The SOD1 was incubated with the chelators for 60 min at 37 °C prior to measurements. n ≥ 3, *P < 0.05, and **P < 0.01, relative to the control. (b) Visualization of 50 μM LD94 (up) and LD100 (down) taken up by HeLa cells, using confocal microscopy. Incubation occurred for 2 h prior to imaging. Two-photon excitation wavelength: 710 nm. (c) Inhibition of intracellular SOD1 activity. Left, dependences of the intracellular SOD1 inhibition on the concentration of LD29, 34, 94 or 100, right, dependences of the intracellular SOD1 inhibition on the incubation period at 5 μM of LD100. n ≥ 3, *P < 0.05, and **P < 0.01, relative to the control. The control was pH 7.4 buffer containing 1% DMSO; (d) molecular docking simulation on the interactions between a SOD1 molecule and LD100 (up), and DFT calculations of electrostatic potential surfaces for LD94 and 100 (down) (the electron density isosurface is 0.0004 electrons per au3). (e) Quenching of 50 μM LD100 fluorescence (λex = 355 nm) upon increased addition of 0–50 μM Cu2+ (left) or 0–100 μM SOD1 (right) in pH 7.4 buffer containing 1% DMSO. Inset: Stern–Volmer plots for the quenching of LD100 fluorescence by Cu2+ or SOD1, where F0 and F respectively represent the fluorescence intensity of LD100 (at 536 nm) in the absence and in the presence of Cu2+ or SOD1. (f) Fluorescence anisotropy of LD100 (50 mM) titrated with SOD1 (0–150 μM) in pH 7.4 buffer containing 1% DMSO at 37 °C. r is the fluorescence anisotropy of the LD100–SOD1 system, (λex = 355 nm, and slit = 5 nm). (g) Western blotting of the SOD1 protein level and RT-PCR assays of the SOD1 mRNA level. The cells were treated for 24 h with 0.1–50 μM LD18, LD34, LD94 or LD100. | ||
Then, we examined HeLa cell uptake of the chelators prior to the determination of the inhibition of intracellular SOD1 activity, because only the chelators taken up by the cell may approach the SOD1 active site in the cytoplasm. The chelators LD94 and 100 were selected to perform this examination because they carry the covalently linked fluorescent group chromone and facilitate visualization of the intracellular chelators under a confocal microscope. The confocal imaging shows that (1) the fluorescent chelators distribute over all of the intracellular area besides the nucleus following incubation for 2–4 h, and the incubation for 2 h leads to the strongest green fluorescence, and (2) the cells exposed to LD100 display much more brilliant green fluorescence than those exposed to LD94 (Fig. 2b). These results indicated that (1) the chelators tested are not only easily taken up by the cell, but also maintain a long stay in the cytoplasm, and (2) the chlorine substituent in LD100 can elevate the cell uptake of the chelator compared to LD94.
The easy entrance into cells and the intracellular long stay observed above could underlie the inhibition of intracellular SOD1 activity by the chelators. Thus, the chelators LD18, 25, 27, 29, 34, 93, 94, and 100 were selected for tests of the intracellular SOD1 inhibition. The SOD1 activity within the HeLa cells after being treated, respectively, with the chelators, ATSM and TM, was assayed under the conditions tested. Following treatment for 24 h, the examination of the dependence of the intracellular SOD1 inhibition on chelator concentrations showed that (1) the SOD1 activity is reduced to ∼20% of and even less than 20% of the initial activity as concentrations of the chelators are increased from 0.1 μM to 50 μM, and (2) the different inhibitors do not display significantly different inhibition when their concentrations are ≥10 μM (Fig. 2c). The 50% inhibitory concentrations (IC50, μM) of the SOD1 activity were obtained using these concentration dependences of the SOD1 inhibition (Table 1 and ESI Fig. 5†), indicating that half of the chelators tested have IC50 values that approach nM scales (e.g., LD94, 100) and are much less than those of TM (one of the strongest inhibitors of SOD1 activity tested so far30) and ATSM. In addition, the SOD1 activity within the cells incubated for varied periods with LD100 was observed to be reduced with prolonging incubation time, indicating the time dependence of the SOD1 inhibition (Fig. 2c). These results proved that incubation with the chelators can efficiently inactivate the intracellular SOD1.
In order to understand the strong inhibition of SOD1 activity, the possible interactions between the chelators and SOD1 were examined using molecular docking simulations using an AutoDock program. The simulation suggested that the chelators approach the metal active site in SOD1 likely via the hydrophobic and H-bonding interactions with some interior groups of the enzyme. The chelator molecules must alter their conformation to adapt to the shape of the active site and to form H-bonds between their certain groups and the SOD1 residues Arg141, His61, Thr135, and Gly139 (see the H-bonds indicated in Fig. 1c). The H-bond between the chromone C![[double bond, length as m-dash]](https://www.rsc.org/images/entities/char_e001.gif) O group and Arg141 not only disrupts the noncovalent interactions between Arg141 and the Cu2+-bound O2˙− that are essential for the catalytic dismutation of O2˙−, but also fills the substrate channel in SOD1. Both the conformational alteration and the formation of these H-bonds could facilitate the coordination of the chelator sulfur atom to the active site Cu2+ ion (Cu2+–S distances = 3.46–4.27 Å, Fig. 2d). This Cu2+–S coordination is supported by Gaussian calculations that indicate a high negative potential over the sulfur atom of the chelators, because the sulfur atom with a negative potential easily binds to Cu2+ (Fig. 2d). Obviously, the chelator occupancy of the SOD1 active site can block the long-range access of O2˙− to the Cu2+ ion.
O group and Arg141 not only disrupts the noncovalent interactions between Arg141 and the Cu2+-bound O2˙− that are essential for the catalytic dismutation of O2˙−, but also fills the substrate channel in SOD1. Both the conformational alteration and the formation of these H-bonds could facilitate the coordination of the chelator sulfur atom to the active site Cu2+ ion (Cu2+–S distances = 3.46–4.27 Å, Fig. 2d). This Cu2+–S coordination is supported by Gaussian calculations that indicate a high negative potential over the sulfur atom of the chelators, because the sulfur atom with a negative potential easily binds to Cu2+ (Fig. 2d). Obviously, the chelator occupancy of the SOD1 active site can block the long-range access of O2˙− to the Cu2+ ion.
In order to prove the coordination of the chelators to the Cu2+ ion in SOD1, we examined the quenching of LD100 fluorescence via titration of the chelator with either Cu2+ or SOD1. Although the fluorescence of LD100 at 536 nm is progressively quenched with increasing concentrations of the quenchers, the fluorescence is much less quenched by SOD1 than by Cu2+ at the concentrations tested (Fig. 2e). Moreover, a new fluorescent peak appears in the range of 425–475 nm with increasing concentrations of the quenchers (Fig. 2e). Because the formation of LD100–Cu2+ complexes can lead to the quenching of the LD100 fluorescence and appearance of this new emission, the fluorescence quenching and the new emission caused by SOD1 can be ascribed to the coordination of LD100 to Cu2+ in SOD1. On the other hand, the localization into the hydrophobic site of a protein can significantly intensify the fluorescence of a fluorescent molecule. Thus, the reduced fluorescence quenching of LD100 localized into the active site within the SOD1 molecule is a consequence of the competition between the copper coordination-mediated quenching and the hydrophobic localization-mediated intensification of fluorescence, as indicated by the distinct Volmer–Stern fluorescence quenching plots (the insets in Fig. 2e).
In order to further confirm the binding of the chelators into the interior of SOD1, the affinity of LD100 for the SOD1 protein was determined using fluorescence anisotropy. The results indicated that the complexes formed with LD100 have a large stability constant of K = 1.91 × 10⁷ M−1 (Fig. 2f, and ESI Fig. 6†), i.e., the affinity of LD100 for SOD1 reaches 52 nM, which could be ascribed to both the coordination of the LD100 sulfur atom to the active site Cu2+ ion and to the H-bonds between LD100 and the SOD1 residues.
The significant reduction in the intracellular SOD1 activity might also be ascribed to both downregulated expression and upregulated degradation of the SOD1 proteins caused by the exposure to the chelators. To rule out these two possibilities, the levels of both intracellular SOD1 proteins and SOD1 mRNAs were determined, respectively, using western blotting and real-time PCR (RT-PCR). On the one hand, the western blotting results show that the intracellular SOD1 protein level is not altered with the concentrations of the chelators following incubation with the chelators (1–50 μM) for 24 h (Fig. 2g), indicating that the exposure to increased concentrations of the chelators does not lead to upregulated degradation of the SOD1 proteins. On the other hand, the RT-PCR data shows that the SOD1 mRNA level remains unchanged within the cells exposed to increasing concentrations of the chelators (Fig. 2g, ESI Fig. 7†), revealing that the exposure to increased concentrations of the chelators does not alter the expression of the SOD1 gene. Thus, these results prove that treatment with the chelators does not alter the level of intracellular SOD1, and the dramatic reduction in the intracellular SOD1 activity is caused by the chelator localization into the active site of SOD1.
Effect of the chelators on the activity of other copper enzymes and proteins
The multiple results described above proved that the chelators are strong copper-coordinating inhibitors of intracellular SOD1 activity. However, the specificity of the SOD1 inhibition remains to be explored. To illustrate the specificity of the intracellular SOD1 inhibition, first, the activity of a typical cuproenzyme CcO within the cells treated with increased concentrations of the chelators was determined with a Human CcO Elisa kit.The cells were lysed following treatment for 24 h with 50 μM LD34, 94 or 100. The data indicated that the CcO activity in these lysates is almost identical to that in the control (Fig. 3a, ESI Fig. 8†). However, as a comparison, the treatment with 50 μM TM leads to the CcO activity in these lysates being reduced to half of that of the control under the conditions tested, which is well consistent with the previously reported result.51 Moreover, the exposure to 50 μM NaN3 (a nonspecifically effective inhibitor of SOD1) results in the complete inactivation of CcO in these lysates (Fig. 3a). This result revealed that the intracellular CcO activity is not attenuated by the treatment with the copper-coordinating inhibitors of SOD1, but is in part or completely inactivated by the nonspecific inhibitors of SOD1. To provide additional evidence for this observation, the CcO activity in the lysates of untreated cells were assayed using a Human CcO Elisa kit following incubation for 30 min with 50 μM of the SOD1 inhibitors. The data demonstrated that the CcO activity is also not modified with increased addition of the chelators, while TM or NaN3 leads to partial or complete inactivation of CcO (Fig. 3b), which is well consistent with the results obtained with the lysates from the treated cells. Because CcO localizes at one terminal of intracellular copper trafficking (ESI Fig. 9†),57 these results allow us to hypothesize that the copper-coordinating inhibitors of SOD1 do not impair either the intracellular CcO activity or the activities of copper trafficking proteins.
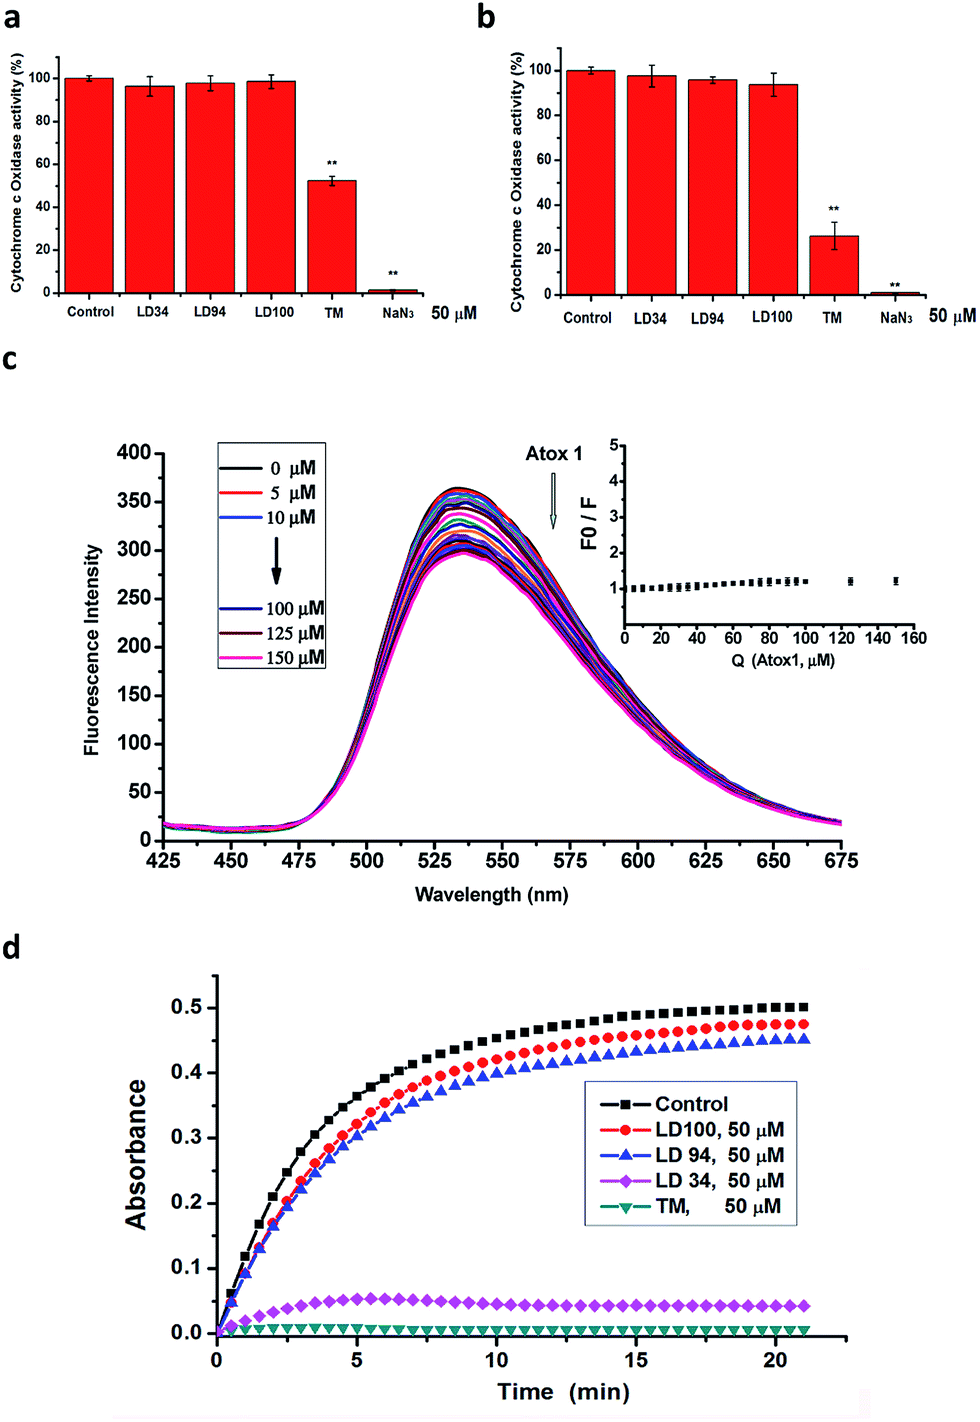 | ||
| Fig. 3 Tests of inhibition towards other copper enzymes and proteins. (a) CcO activity was measured using UV-vis absorption spectroscopy in Hela cells treated for 24 h with 50 μM SOD1 inhibitors. n ≥ 3, and **P < 0.01, relative to the control. (b) CcO activity in the lysates of the untreated HeLa cells following incubation for 30 min with 50 μM SOD1 inhibitors assayed using a Human CcO Elisa kit. n ≥ 3, and **P < 0.01, relative to the control. (c) Quenching of 50 μM LD100 fluorescence (λex = 355 nm) upon addition of 0–150 μM Atox1 in pH 7.4 Tris–HCl containing 1% DMSO; inset, Stern–Volmer plots for the quenching of LD100 fluorescence by Atox1, where F0 and F respectively represent the fluorescence intensity of LD100 (at 536 nm) in the absence and in the presence of Atox1. (d) Activity of tyrosinase isolated from potato in the presence of 50 μM SOD1 inhibitors following incubation with the chelators for 15 min at 30 °C. | ||
In order to prove the above-mentioned hypothesis, the effect of LD100 on the copper trafficking activity of Atox1, a typical copper chaperone (ESI Fig. 9†), was examined via the fluorescence quenching of LD100 titrated with Atox1. The data showed that the fluorescence intensity of LD100 at 536 nm is almost not reduced, and a new emission peak is not found between 425 and 475 nm with increasing concentrations of Atox1 (Fig. 3c). Obviously, this result was different from that of the treatment of LD100 with SOD1 (Fig. 2e) and indicated that LD100 cannot chelate the copper ion in Atox1, revealing that the functions of the intracellular copper trafficking proteins are not modified by SOD1 inhibition.
The observations that the activity of CcO is not altered by the chelators, and that the chelators could not bind to Atox1 suggested no access of the chelators to the copper ions in CcO and Atox1, otherwise the copper ions would be removed or chelated from these two proteins, because their copper affinity is much weaker than that of SOD1.57 To obtain data to support this suggestion, molecular docking simulations were performed, as in the case of SOD1. The result showed that there is not any access of the copper-coordinating inhibitors of SOD1 to the copper sites in these two protein molecules. Thus, the SOD1 inhibitors cannot inactivate these two copper proteins because they neither remove copper nor coordinate to copper in the proteins.
In addition, we observed the effect of the copper-coordinating inhibitors of SOD1 on the activity of tyrosinase from potato. Tyrosinase, which catalyzes the reaction of L-tyrosine with water, is a dicopper-containing multisubunit enzyme whose structures are conserved across all species. The data showed that the incubation for 0–20 min with 50 μM LD94 or 100 leads to only a <10% reduction in the activity relative to the control, whereas 50 μM TM results in complete inactivation of the enzyme under the conditions tested (Fig. 3d), indicating that the copper-coordinating inhibitors LD94 and 100 almost do not at all inactivate tyrosinase, as supported by the molecular docking results (ESI Fig. 10†). Taken together with the observations performed with both CcO and Atox1, the copper-chelating agents not only do not inhibit both CcO and tyrosinase, but also do not impair the functions of the trafficking proteins that transfer copper to these two kinds of enzymes for their maturation, i.e., the activity of the intracellular SOD1 can specifically be inhibited by the chelators.
Changes of intracellular basal ROS levels
SOD1 catalyzes the dismutation of O2˙− into H2O2 and O2. Thus, one of the consequences of the specific SOD1 inhibition should be that the intracellular O2˙− level is elevated and the H2O2 level is decreased. To prove this expectation, the intracellular O2˙− and H2O2 levels were evaluated, respectively, with the O2˙−- and H2O2-sensitive fluorescence dyes dihydroethidium (DHE) and dichlorofluorescein (H2DCFDA). The intracellular fluorescence intensity of these dyes was measured using flow cytometry. The fluorescence data shows that (1) treatment for 24 h with the different 5 μM inhibitors results in significantly elevated O2˙− and decreased H2O2 levels within the cells (Fig. 4a), (2) the O2˙− level is increased and the H2O2 level is decreased with increasing concentrations of the inhibitors (Fig. 4b), and (3) treatment with 1 μM LD94, and 100 leads the O2˙− and H2O2 levels to be elevated to 150–160% of and reduced to 60–70% of the control, respectively. These results indicate that both the increase of O2˙− and the decrease of H2O2 levels within the treated cells can be not only correlated with types of SOD1 inhibitors, but also depend on their concentrations, as observed for the intracellular SOD1 inactivation (Fig. 2c). Moreover, the reduction in the H2O2 level (LD100 > 94 > 34 > 27 ∼ 61 > 29 > 25 ∼ 72 > 18) is well consistent with the IC50 values of the intracellular SOD1 inhibition (Fig. 2c). Therefore, the intracellular basal levels of O2˙− and H2O2 can reasonably be regulated with the small molecules without the stimulation of either exogenous H2O2 or growth factors.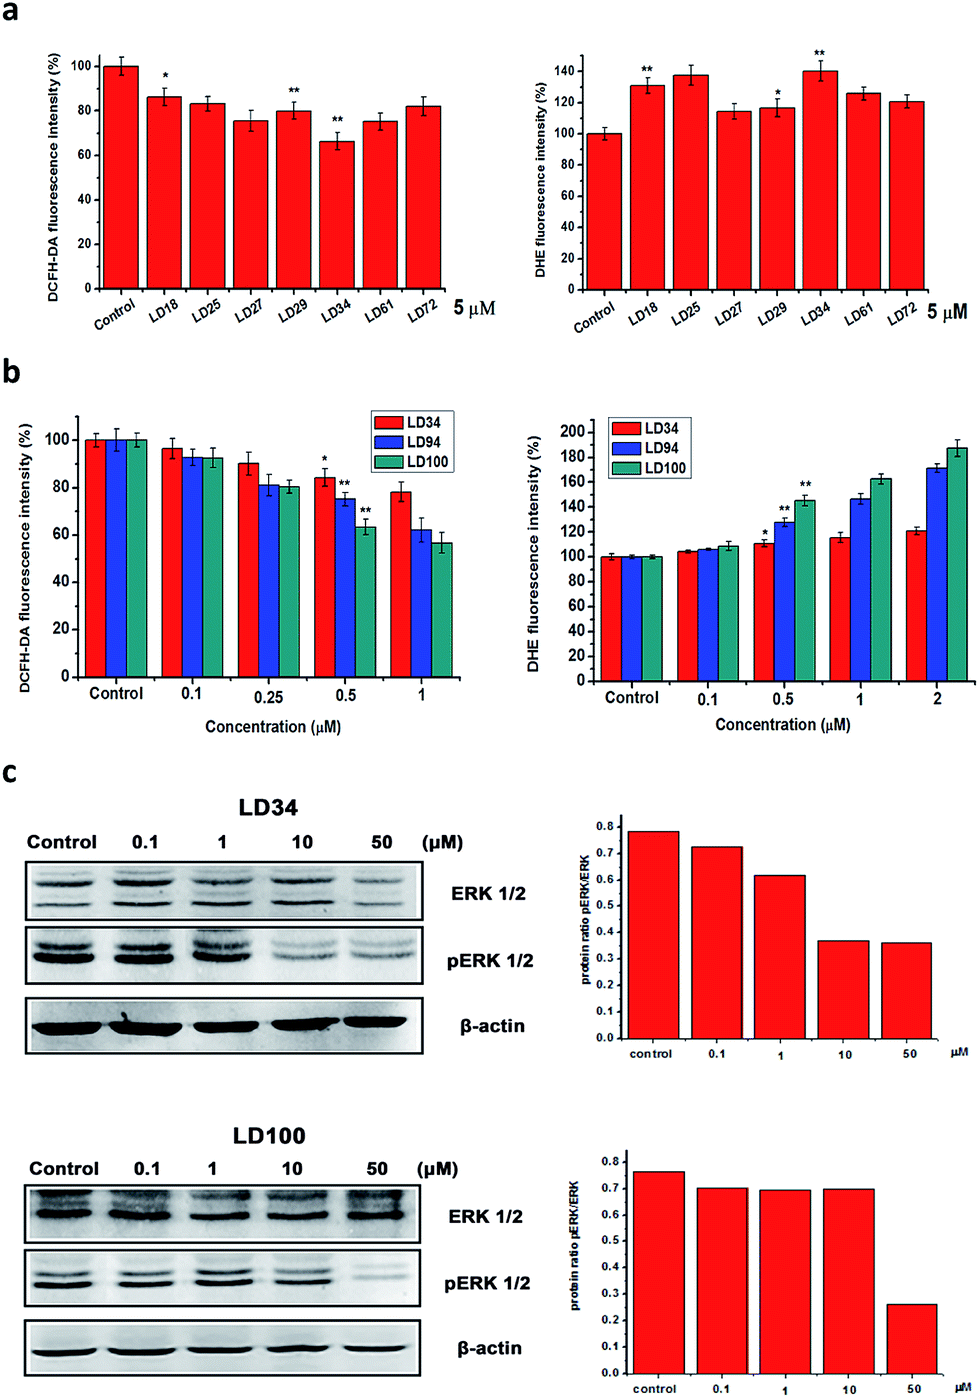 | ||
| Fig. 4 Effects of the SOD1 inhibition on intracellular ROS levels and pERK1/2. (a) The DHE or DCFDA fluorescence intensity in the cells treated for 24 h with the SOD1 inhibitors of 5 μM. The DHE and DCFDA fluorescence intensity is positively correlated, respectively, with O2˙− and H2O2 levels. n ≥ 3, *P < 0.05, and **P < 0.01, relative to the control. (b) The dependences of the DHE and DCFDA fluorescence intensity in the treated cells for 24 h on the concentrations of LD34, 94 and 100. n ≥ 3, *P < 0.05, and **P < 0.01, relative to the control. (c) The phosphorylation level of ERK1/2 in the treated HeLa cells is changed with types and concentrations of the SOD1 inhibitors. Quantification of the western bands was performed using the Image G software. | ||
Regulation of intracellular ERK signaling
H2O2 inactivates the protein tyrosine phosphatases via oxidizing the –SH groups in their active site cysteine residues, thereby regulating ERK signaling pathways.1–4 Doñate et al. reported that the decreased intracellular H2O2 levels induced by ATN-224 inhibition of SOD1 can cause the downregulation of ERK phosphorylation in EGF-stimulated cells.30 Thus, we selected the ERK pathway to explore the potential of our inhibitors in ROS signaling research. At which level the alteration of intracellular ROS could affect the ROS signaling pathway is an important issue in ROS signaling research.The phosphorylation of ERK1/2 (pERK1/2) was examined following the treatment for 24 h of HeLa cells with five chelators at different concentrations. As shown in Fig. 4, a slight reduction of ERK1/2 phosphorylation (about 10%) was observed in 0.1 μM LD34- or LD100-treated HeLa cells which also exhibit about a 15% reduction in H2O2 level relative to the untreated cells, whereas the levels of ERK1/2 proteins in the treated cells does not change with types and concentrations of the inhibitors. Moreover, the reduction in pERK1/2 (about 75% at 50 μM LD100) is enhanced with increasing concentrations of the chelators (Fig. 4c), as the intracellular H2O2 level is further decreased (about 45%, Fig. 4b). It is notable that the alteration of pERK in cells before and after the treatment with the inhibitors is so significant that no EGF stimulation is required to augment the differentiation. These results revealed that the specific inhibitors of SOD1 might provide a powerful tool for controlling intracellular ROS levels in the regulation and research of ROS signaling.
Promotion of cancer cell apoptosis
The effect of the copper-coordinating inhibition of SOD1 on cancer cell growth was observed via flow cytometry, because SOD1 has been established as one of the anti-cancer targets. The data showed that the normal cells COS-7 only display a slight elevation in apoptosis following exposure to 10 or 50 μM LD100 for 24 h (Fig. 5a), while the apoptosis of the cancer cells (HeLa) treated with 0–50 μM LD100 for 24 h is significantly increased from 5.85% to 13.54% (Fig. 5b). In addition, the treatment with 50 μM LD94 under the same conditions leads only to a slight increase in the apoptosis of HeLa cells (Fig. 5c). These results indicated that the apoptosis depends not only on the types and concentrations of the chelators, but also likely on the types of cells tested. The cancer cell lines may display more noticeable apoptosis than normal cell lines following treatment with LD100. The promotion of cancer cell apoptosis might be due to the alterations of the basal levels of intracellular ROS via the SOD1 inhibition (Fig. 4a and b). The reduced H2O2 level may lead to programmed cell death through inhibiting the ERK1/2 signaling pathways, and the increased O2˙− level may also promote apoptosis probably because of the formation of peroxynitrite via the reaction of O2˙− with NO.51 | ||
| Fig. 5 Effects of SOD1 inhibition on cell apoptosis. (a) COS-7 cells, and 50 μM LD100. (b) HeLa cells, and 10–50 μM LD100. (c) HeLa cells, and 50 μM LD94. Q1–4, cell debris, cells in the end stage of apoptosis, surviving cells, and apoptotic cells, respectively. Apoptotic cells were identified via dual-staining with recombinant FITC-conjugated Annexin V-PI. | ||
The chelators designed in this study exhibit high selectivity for Cu2+ over the other divalent metal ions tested, and form Cu2+ complexes whose stability constants are much higher than the copper affinity of the proteins including SOD1, CcO and Atox1. The tests in both solutions and cells indicated that the chelators inactivate SOD1 via coordinating to the Cu2+ ion in the SOD1 active site, blocking the redox cyclic reaction between the Cu2+ ion and the substrate O2˙−, and disrupting the noncovalent interactions between the Cu2+-bound O2˙− and the residue Arg141 in SOD1. However, the copper-coordinating inhibition of SOD1 not only does not inactivate both CcO and tyrosinase, but also does not impact on their copper trafficking protein Atox1. The reduced ERK1/2 phosphorylation in the cells treated with the chelators is a consequence of the reduced H2O2 level. Moreover, the inactivation of SOD1 results in inhibitor concentration-dependent elevation and reduction, respectively, of the intracellular O2˙− and H2O2 levels which promotes cancer cell apoptosis.
The functional groups that play a key role in the SOD1 inhibition can be identified based on both the stability constants of the copper complexes and the IC50 data of the SOD1 inhibition (Table 1). First, the group –CS in the chelators is essential for tight chelation to copper, because the copper complexes formed via the coordination of the chelator –CS group have stability constants of at least two orders of magnitude more than those via –CO (LD27). The localization of the chelators in the SOD1 active site leads –CS to coordinate to the SOD1 Cu2+ ion, as indicated by both molecular docking simulations (Fig. 2d) and fluorescent titrations of the chromone-containing chelators with SOD1 (Fig. 2e). The coordination of –CS in the chelators makes the Cu2+ ion in SOD1 become redox-inert, although the coordination of this group to Cu2+ in SOD1 (Cu2+–S distances = 3.46–4.27 Å, Fig. 1c and 2d) may be weaker than that in copper complexes (Cu2+–S bonds = 2.253–2.278 Å) because of the steric restriction from the SOD1 protein structure.Then, the introduction of the H-bonding acceptor (chromone in LD93, 94, and 100) and donor (phenolic hydroxyl in LD29, 34, 74, 94, and 100) into the chelators can significantly decrease the IC50 values of their SOD1 inhibition because the formation of H-bonds between these groups and the SOD1 residues (indicated in Fig. 1c and 2d) can disrupt the noncovalent interactions including the H-bond between the Cu2+-bound O2˙− and the SOD1 residue Arg141 (Fig. 1a). Unexpectedly, the chromone facilitates not only monitoring cell uptake of the chelators through visualization, but also enhancing the SOD1 inhibition via the occupancy of the substrate channel in SOD1. In addition, the chlorine modification of the phenol results in the increased uptake of cells and decreased IC50 values of SOD1 inhibition, since this modification can intensify the H-bonding interaction of the phenolic hydroxyl with the amide group between Pro60 and His61 in SOD1.
The above-mentioned interactions between a SOD1 molecule and each of the chelators could underlie the specific copper-coordinating inhibition of intracellular SOD1 activity. This specific SOD1 inhibition is supported by multiple observations. First, the activity of the copper enzymes CcO and tyrosinase is completely not attenuated by the chelators (Fig. 3), indicating that the chelators also do not impair the functions of the copper trafficking proteins, as indicated by the test with Atox1 (Fig. 3). Then, the intracellular SOD1 activity is continuously decreased with increasing concentrations of the chelators (Fig. 2c). Moreover, the intracellular O2˙− level rises and H2O2 level falls also in a chelator concentration-dependent manner (Fig. 4b). However, a possibility that cannot be ruled out is that the chelators may remove or chelate copper from the copper chaperone for SOD1 (CCS) or target the CCS–SOD1 interaction interface, as revealed currently with a small molecule.60 Obviously, the disruption of the copper trafficking function of CCS can also reduce maturation of the nascent SOD1 protein. This copper-coordinating or CCS–SOD1 interface-targeting inhibition of CCS is actually also able to specifically attenuate the activity of the intracellular total SOD1. Consequently, the chelators are a specific inhibitor of intracellular SOD1 activity.
Many studies directly expose cells to H2O2 at concentrations much higher than the intracellular basal level of H2O2, or stimulate cells to produce high levels of H2O2 with growth factors or cytokines to explore or to regulate ROS signaling pathways.13–27 Our results reveal that the specific copper-coordinating inhibition of SOD1 activity can significantly decrease the intracellular basal level of H2O2. The chelator concentration-dependent decrease in the H2O2 level is parallel to the chelator concentration-dependent reduction in pERK1/2 and the dependent elevation in the apoptosis of HeLa cells (Fig. 4 and 5), i.e., the specific and efficient inhibition of intracellular SOD1 activity can regulate the H2O2 signaling pathways including ERK1/2 via directly decreasing the intracellular basal H2O2 levels, rather than via dramatically increasing intracellular H2O2 levels by the stimulations of added H2O2 or growth factors. Therefore, the small molecules designed here can significantly regulate both ROS ERK signaling and apoptosis of cancer cells under conditions where no amplification of ROS signaling is required.
Conclusions
A kind of specific and efficient copper-coordinating inhibitor of intracellular SOD1 activity was designed based on the structure and catalytic redox cycle of the active site in SOD1. The coordination of the copper in SOD1 to the inhibitors leads to the disruption of the Cu2+/Cu+ catalytic cycle essential for O2˙− dismutation. The copper-coordinating and H-bonding groups in the inhibitors play key roles in the specific inactivation of SOD1. The specific SOD1 inhibition directly changes intracellular basal levels of H2O2 without external stimulations of either H2O2 or growth factors, which enables us to conveniently monitor and regulate both ROS signaling and cancer cell apoptosis. Thus, the copper-coordinating agents might become a powerful tool in further understanding and regulation of ROS signaling, oxidative stress, and redox-involved apoptosis and pathology.Materials and methods
General methods
All reagents were purchased from commercial sources (e.g., Sigma) and directly used unless stated otherwise. Solvents were purified via the most used methods. All of the solutions and buffers were prepared using deionized water that was passed through a Millipore-Q ultrapurification system. Elementary analysis was carried out on a Vario EL III elementary analysis instrument. UV-Vis spectra were recorded on an Analytik Jena Specord 210 spectrophotometer (Analytic Jena AG). 1H and 13C NMR spectra were measured on a Varian Mercury 400 spectrometer. The MS data was obtained using a Quattro II ESI mass spectrometer (Waters, USA).Assays of SOD1 activity
SOD1 activity was determined by measuring the inhibition of the reduction of the water-soluble tetrazolium salt, WST-1 (2-(4-iodophenyl)-3-(4-nitrophenyl)-5-(2,4-disulfo-phenyl)-2H-tetrazolium, monosodium salt), which produced a water-soluble formazan dye upon reduction with O2˙−. The determinations were performed with a HT Superoxide Dismutase Assay Kit (Trevigen) that is specific to SOD1. The concentration of proteins was determined using a Biorad DC protein assay kit. Bovine SOD1 (Sigma), which has been proved to be equivalent to human SOD1,60 was used to generate a standard curve. The results represent the mean ± SD of at least three parallel experiments in which each condition was assayed in duplicate.Assays of CcO activity
The CcO activity in Hela cells was measured using the UV-vis spectrophotometer61 and cytochrome c oxidase assay kit62 (Human CcO Elisa kit, Sigma). Using different testing methods because of the sensitivity for the substrate, CcO activity was measured using UV-vis absorption spectra in the cells with inhibitors. The cells were lysed following incubation for 24 h with 50 μM LD34, LD94, LD100, TM or NaN3. Ferrocytochrome c (reduced cytochrome c with dithiothreitol) was then added to the sample, and the CcO activity was determined by measuring the change of UV absorption at 550 nm. The difference in extinction coefficients between reduced and oxidized cytochrome c is 21.84 at 550 nm.61 The CcO activity in the lysates of untreated cells was assayed following incubation for 30 min with 50 μM of the SOD1 inhibitors by using the Human CcO Elisa. One unit of CcO activity was defined as the oxidization of 1.0 μM of ferrocytochrome c per min at pH 7.4 at 25 °C. The results represent the mean ± SD of at least three experiments in which each condition was assayed in duplicate, the control was a blank containing 1% DMSO.Assays of tyrosinase activity
The tyrosinase enzyme was isolated from potato and purified by using the method described by the literature.63 Tyrosinase activity was determined through measuring the oxidation of 3,4-dihydroxyphenylalanine (L-DOPA, Sigma), which was constructed by Pomerantz et al.:64 50 μL of enzyme extract was added to 450 μL of 0.05 M phosphate buffer (pH 6.8) containing 50 μM chelators, and the mixture was preincubated at 30 °C for 10 min, 500 μL of 5 mM L-DOPA solution was then added, and the increase in absorption at 475 nm (ε = 3600 M cm−1) due to the formation of DOPA chrome was monitored as a function of time. The initial rate could be used to estimate the tyrosinase activity and the control was a blank containing 1% DMSO.Fluorescence quenching assays
Fluorescence spectra were acquired on a Cary Eclipse fluorescence spectrophotometer (Varian, USA). Quenching of 50 μM LD100 fluorescence (λex = 355 nm) was measured upon addition of 0–50 μM Cu2+, 0–100 μM SOD1 or 0–150 μM Atox1 for 15–30 min in 20 mM Tris–HCl (pH 7.4) containing 1% DMSO. All measurements were conducted at 37.0 °C, the fluorescence emission spectra were integrated from 400 to 700 nm.Fluorescence anisotropy
Fluorescence anisotropy was performed with a Cary Eclipse fluorescence spectrophotometer (with polarizer device, Varian, USA), anisotropy data were obtained using an excitation wavelength of 355 nm, and the fluorescence emission was monitored from 532 to 542 nm. The final values were from an average of three scans. Anisotropy values were averaged over the emission range. The G-factor was measured to be 1.73 on average before each experiment.65 All of the samples were in a 20 mM Tris–HCl buffer (pH 7.4). Samples were stirred continuously in a 10 mm Spectrosil quartz cuvette. All measurements were done at 37 °C, which was maintained with a circulating bath. The analysis of binding parameters using fluorescence anisotropy and formula derivation can be found in ESI.†Western blotting of SOD1 and protein phosphorylation
HeLa cells were washed with cold PBS and lysed (175 mM NaCl, 25 mM HEPES, pH 7.4, 10% glycerol, 5 mM EDTA, 1% Triton X, 50 mM sodium fluoride, and 5 mM sodium orthovanadate). The cells lysates were then scraped using a plastic cell lifter, transferred to labeled microfuge tubes and spun at 12000 rpm at 4 °C for 10 min. The supernatant was then transferred to a fresh tube and the total proteins were estimated via Bradford assay (BCA Assay, Pierce Biotechnology Inc). The cell lysates prepared above were mixed with electrophoresis SDS sample buffer (Novex) and separated on 10% Novex SDS-PAGE Tris–glycine gels. The proteins were transferred to PVDF membranes and blocked with BSA solution in TBST before immunoblotting for total or phospho-specific proteins. For the detection of signal transduction molecules, membranes were probed with polyclonal antisera against SOD1, ERK1/2 or phospho-ERK1/2 at 1:1000. The secondary antiserum was goat anti-rabbit-HRP at 1:2000. Blots were developed using a DAB chromogenic reagent kit and imaged on a GeneGenome Chemiluminescence Imager (Syngene, Cambridge). The expression of β-actin was used as a protein loading control when necessary.
RT-PCR
After HeLa cells reached 80% confluence in 96-well plates, the FBS-containing medium was replaced with a FBS-free medium, and incubated for 24 h. Then, chelators (0.1, 1, 10, and 20 μM) were added into the wells (6 parallel wells tested), and further incubated for 24 h at 37 °C. The total RNA was purified from the incubated Hela cells using the High Pure RNA Isolation Kit (Roche). Real-time PCR was performed utilizing the Fast Start Essential DNA Green Master (Roche) with 5 μL of cDNA, and 0.2 μM primers in a total volume of 20 μL in a LightCycler 96 Instrument (Roche). Purified RNA (1 μg) was reverse transcribed into cDNA by the transcriptor first strand cDNA synthesis Kit (Roche) in a total volume of 20 μL. The amplification was monitored via SYBR Green fluorescence. Correct amplification was monitored via post-run melt curve analysis. A 3-step cycling protocol (95 °C, 10 s; 59 °C, 10 s; and 72 °C, 10 s) was used. The annealing temperature could surpass 90% amplification efficiency, and correct amplification was monitored using post-run melt curve analysis. The level of expression of each of the transporters was normalized to that of β-actin assessed by the same assay. The primers for SOD1 were 5′-AAGGCCGTGTGCGTGCTGAA-3′ and 5′-GGCCCACCGTGTTTT CTGGA-3′. The results represent the mean ± SD of at least five experiments in which each condition was assayed in duplicate.Measurements of intracellular ROS levels
Hela cells were incubated with 0.1, 0.5, 1, or 2 μM LD100 for 24 h, and then, trypsinized, washed with PBS, counted, and resuspended in PBS. For superoxide measurements, dihydroethidium (DHE) (Sigma) was added to the cells at 5 μM for 20 min. For H2O2 measurements, dichloro-dihydro-fluorescein diacetate (DCFH-DA) (Sigma) at 5 μM was added to the cells for 20 min. After incubation with the respective dyes, the cells were extensively washed and analyzed using CytoFLEX (Beckman Coulter, Inc. USA). The initial data can be found in ESI.†Apoptosis assays
Hela and COS-7 cells were incubated with 10, 25, 50, or 75 μM LD100 for 24 h, then washed with PBS, and centrifuged at 1000 g for 5 min, resuspended in ice-cold 70% ethanol/PBS, centrifuged at 800 g for another 6 min, and resuspended in PBS. These cells were then incubated with propidium iodide (PI) and fluorescein isothiocyanate (FITC)-labeled annexin V for 30 min at 37 °C. Excess PI and annexin V were then washed off; the cells were fixed, and the stained cells were analyzed via flow cytometry using CytoFLEX (Beckman Coulter, Inc. USA) equipped with a 488 nm argon laser light source, a 525 nm bandpass filter for FITC fluorescence, and a 615 nm bandpass filter for PI fluorescence using CellQuest software.Conflict of interest
The authors declare no competing financial interest.Acknowledgements
This study is supported by NSFC (No. 21271079, 21001047, and 21072074), by Natural Science Foundation of Hubei Province of China (No. 2015CFB305) and by self-determined research funds of CCNU from the colleges' basic research and operation of MOE (No. CCNU14A05004, CCNU14KFY003, and CCNU15A05016). We thank Prof. Yangzhong, Liu at USTC for providing AToX1.References
- B. D'Autreaux and M. B. Toledano, Nat. Rev. Mol. Cell Biol., 2007, 8, 813–824 CrossRef PubMed.
- E. A. Veal, A. M. Day and B. A. Morgan, Mol. Cell, 2007, 26, 1–14 CrossRef CAS PubMed.
- B. C. Dickinson and C. J. Chang, Nat. Chem. Biol., 2011, 7, 504–511 CrossRef CAS PubMed.
- A. Bindoli and M. P. Rigobello, Antioxid. Redox Signaling, 2013, 18, 1557–1593 CrossRef CAS PubMed.
- D. Trachootham, W. Lu, M. A. Ogasawara, R. D. Nilsa and P. Huang, Antioxid. Redox Signaling, 2008, 10, 1343–1374 CrossRef CAS PubMed.
- K. M. Holmstrom and T. Finkel, Nat. Rev. Mol. Cell Biol., 2014, 15, 411–421 CrossRef CAS PubMed.
- T. W. Miller, J. S. Isenberg and D. D. Roberts, Chem. Rev., 2009, 109, 3099–3124 CrossRef CAS PubMed.
- S. S. Sabharwal and P. T. Schumacker, Nat. Rev. Cancer, 2014, 14, 709–721 CrossRef CAS PubMed.
- S. C. Gupta, H. David, P. Sridevi, P. Byoungduck, K. Wonil and B. B. Aggarwal, Antioxid. Redox Signaling, 2012, 16, 1295–1322 CrossRef CAS PubMed.
- C. K. Glass, K. Saijo, B. Winner, M. C. Marchetto and F. H. Gage, Cell, 2010, 140, 918–934 CrossRef CAS PubMed.
- M. Noble, M. Mayer-Pröschel, Z. Li, T. Dong, W. Cui, C. Pröschel and C. Folts, Free Radical Biol. Med., 2015, 79, 300–323 CrossRef CAS PubMed.
- C. R. Reczek and N. S. Chandel, Curr. Opin. Cell Biol., 2015, 33, 8–13 CrossRef CAS PubMed.
- Z. A. Wood, L. B. Poole and P. A. Karplus, Science, 2003, 300, 650–653 CrossRef CAS PubMed.
- H. A. Woo, H. Z. Chae, S. C. Hwang, K. S. Yang, S. W. Kang, K. Kim and S. G. Rhee, Science, 2003, 300, 653–656 CrossRef CAS PubMed.
- N. R. Leslie, D. Bennett, Y. E. Lindsay, H. Stewart, A. Gray and C. P. Downes, EMBO J., 2003, 22, 5501–5510 CrossRef CAS PubMed.
- E. A. Veal, V. J. Findlay, A. M. Day, S. M. Bozonet, J. M. Evans, J. Quinn and B. A. Morgan, Mol. Cell, 2004, 15, 129–139 CrossRef CAS PubMed.
- H. Kamata, S. I. Honda, S. Maeda, L. Chang, H. Hirata and M. Karin, Cell, 2005, 120, 649–661 CrossRef CAS PubMed.
- K. Chen, M. T. Kirber, H. Xiao, Y. Yang and J. F. Keaney, J. Cell Biol., 2008, 181, 1129–1139 CrossRef CAS PubMed.
- J. Cao, J. Schulte, A. Knight, N. R. Leslie, A. Zagozdzon, R. Bronson and C. A. Neumann, EMBO J., 2009, 28, 1505–1517 CrossRef CAS PubMed.
- H. A. Woo, S. H. Yim, D. H. Shin, D. Kang, D. Y. Yu and S. G. Rhee, Cell, 2010, 140, 517–528 CrossRef CAS PubMed.
- D. Anastasiou, G. Poulogiannis, J. M. Asara, M. B. Boxer, J. K. Jiang, M. Shen and C. J. Thomas, Science, 2011, 334, 1278–1283 CrossRef CAS PubMed.
- B. C. Dickinson, J. Peltier, D. Stone, D. V. Schaffer and C. J. Chang, Nat. Chem. Biol., 2011, 7, 106–112 CrossRef CAS PubMed.
- T. J. Cohen, A. W. Hwang, T. Unger, J. Q. Trojanowski and V. M. Lee, EMBO J., 2012, 31, 1241–1252 CrossRef CAS PubMed.
- M. C. Sobotta, W. Liou, S. Stöcker, D. Talwar, M. Oehler, T. Ruppert and T. P. Dick, Nat. Chem. Biol., 2014, 11, 64–70 CrossRef PubMed.
- J. Kwon, S. R. Lee, K. S. Yang, Y. Ahn, Y. J. Kim, E. R. Stadtman and S. G. Rhee, Proc. Natl. Acad. Sci. U. S. A., 2004, 101, 16419–16424 CrossRef CAS PubMed.
- G. J. DeYulia, J. M. Carcamo, O. Borquez-Ojeda, C. C. Shelton and D. W. Golde, Proc. Natl. Acad. Sci. U. S. A., 2005, 102, 5044–5049 CrossRef CAS PubMed.
- R. Wani, J. Qian, L. Yin, E. Bechtold, S. B. King, L. B. Poole and C. M. Furdui, Proc. Natl. Acad. Sci. U. S. A., 2011, 108, 10550–10555 CrossRef CAS PubMed.
- J. M. McCord and I. Fridovich, J. Biol. Chem., 1969, 244, 6049–6055 CAS.
- Y. Sheng, I. A. Abreu, D. E. Cabelli, M. J. Maroney, A. F. Miller, M. Teixeira and J. S. Valentine, Chem. Rev., 2014, 114, 3854–3918 CrossRef CAS PubMed.
- J. C. Juarez, M. Manuia, M. E. Burnett, O. Betancourt, B. Boivin, D. E. Shaw and F. Doñate, Proc. Natl. Acad. Sci. U. S. A., 2008, 105, 7147–7152 CrossRef CAS PubMed.
- A. R. Reddi and V. C. Culotta, Cell, 2013, 152, 224–235 CrossRef CAS PubMed.
- T. Fukai and M. Ushio-Fukai, Antioxid. Redox Signaling, 2011, 15, 1583–1606 CrossRef CAS PubMed.
- V. L. Kinnula and J. D. Crapo, Free Radical Biol. Med., 2004, 36, 718–744 CrossRef CAS PubMed.
- F. D. Oakley, D. Abbott, Q. Li and J. F. Engelhardt, Antioxid. Redox Signaling, 2009, 11, 1313–1333 CrossRef CAS PubMed.
- M. J. Hitchler and F. E. Domann, Antioxid. Redox Signaling, 2014, 20, 1590–1598 CrossRef CAS PubMed.
- P. Huang, L. Feng, E. A. Oldham, M. J. Keating and W. Plunkett, Nature, 2000, 407, 390–395 CrossRef CAS PubMed.
- R. Somwar, H. Erdjument-Bromage, E. Larsson, D. Shum, W. W. Lockwood, G. Yang, C. Sander, O. Ouerfelli, P. J. Tempst, H. Djaballah and H. E. Varmus, Proc. Natl. Acad. Sci. U. S. A., 2011, 108, 16375–16380 CrossRef CAS PubMed.
- M. Kelner and N. Alexander, J. Biol. Chem., 1986, 261, 1636–1641 CAS.
- J. D. Rothstein, L. A. Bristol, B. Hosler, R. H. Brown and R. W. Kuncl, Proc. Natl. Acad. Sci. U. S. A., 1994, 91, 4155–4159 CrossRef CAS.
- A. Warshawsky, I. Rogachev, Y. Patil, A. Baszkin, L. Weiner and J. Gressel, Langmuir, 2001, 17, 5621–5635 CrossRef CAS.
- V. Lushchak, H. Semchyshyn, O. Lushchak and S. Mandryk, Biochem. Biophys. Res. Commun., 2005, 338, 1739–1744 CrossRef CAS PubMed.
- A. Dumay, V. Rincheval, P. Trotot, B. Mignotte and J. L. Vayssiere, Free Radical Biol. Med., 2006, 40, 1377–1390 CrossRef CAS PubMed.
- J. C. Juarez, O. Betancourt, S. R. Pirie-Shepherd, X. Guan, M. L. Price, D. E. Shaw and F. Doñate, Clin. Cancer Res., 2006, 12, 4974–4982 CrossRef CAS PubMed.
- F. Donate, J. C. Juarez, M. E. Burnett, M. M. Manuia, X. Guan, D. E. Shaw and A. P. Mazar, Br. J. Cancer, 2008, 98, 776–783 CrossRef CAS PubMed.
- L. Mandinov, A. Mandinova, S. Kyurkchiev, D. Kyurkchiev, I. Kehayov, V. Kolev and M. J. Post, Proc. Natl. Acad. Sci. U. S. A., 2003, 100, 6700–6705 CrossRef CAS PubMed.
- Q. Pan, C. G. Kleer, K. L. van Golen, J. Irani, K. M. Bottema, C. Bias and G. J. Brewer, Cancer Res., 2002, 62, 4854–4859 CAS.
- A. Glassauer, L. A. Sena, L. P. Diebold, A. P. Mazar and N. S. Chandel, J. Clin. Res. Lett., 2014, 124, 117–128 Search PubMed.
- V. E. Lee, J. M. Schulman, E. I. Stiefel and C. C. Lee, J. Inorg. Biochem., 2007, 101, 1707–1718 CrossRef CAS PubMed.
- R. A. Campbell, M. S. Gordon, O. Betancourt, J. Juarez, F. Donate, A. Mazar and J. R. Berenson, Cancer Res., 2006, 66, 1141 Search PubMed.
- S. A. Lowndes, A. Adams, A. Timms, N. Fisher, J. Smythe, S. M. Watt and M. Middleton, Clin. Cancer Res., 2008, 14, 7526–7534 CrossRef CAS PubMed.
- K. Lee, M. M. Briehl, A. P. Mazar, I. Batinic-Haberle, J. S. Reboucas, B. Glinsmann-Gibson and M. E. Tome, Free Radical Biol. Med., 2013, 60, 157–167 CrossRef CAS PubMed.
- M. V. Chidambaram, G. Barnes and E. Frieden, J. Inorg. Biochem., 1984, 22, 231–239 CrossRef CAS PubMed.
- K. D. Bissig, T. C. Voegelin and M. Solioz, FEBS Lett., 2001, 507, 367–370 CrossRef CAS PubMed.
- H. M. Alvarez, Y. Xue, C. D. Robinson, M. A. Canalizo-Hernández, R. G. Marvin, R. A. Kelly and T. V. O'Halloran, Science, 2010, 327, 331–334 CrossRef CAS PubMed.
- K. Kawamura, Y. Kuroda, M. Sogo, M. Fujimoto, T. Inui and T. Mitsui, Biochem. Biophys. Res. Commun., 2014, 452, 181–185 CrossRef CAS PubMed.
- P. J. Hart, M. M. Balbirnie, N. L. Ogihara, A. M. Nersissian, M. S. Weiss, J. S. Valentine and D. Eisenberg, Biochemistry, 1999, 38, 2167–2178 CrossRef CAS PubMed.
- L. Banci, I. Bertini, S. Ciofi-Baffoni, T. Kozyreva, K. Zovo and P. Palumaa, Nature, 2010, 465, 645–648 CrossRef CAS PubMed.
- B. M. Paterson and P. S. Donnelly, Chem. Soc. Rev., 2011, 40, 3005–3018 RSC.
- J. Heinze, Angew. Chem., Int. Ed., 1984, 23, 831–847 CrossRef.
- J. Wang, C. Luo, C. Shan, Q. You, J. Lu, S. Elf and H. Kang, Nat. Chem., 2015, 7, 968–979 CrossRef CAS PubMed.
- L. Smith and P. W. Camerino, Biochemistry, 1963, 2, 1428–1432 CrossRef CAS PubMed.
- S. I. Ogura, K. Maruyama, Y. Hagiya, Y. Sugiyama, K. Tsuchiya, K. Takahashi and T. Tanaka, BMC Res. Notes, 2011, 4, 66–70 CrossRef CAS PubMed.
- Y. J. Xuan, Y. Endo and K. Fujimoto, J. Agric. Food Chem., 2002, 50, 6575–6578 CrossRef CAS PubMed.
- S. H. Pomerantz, J. Biol. Chem., 1963, 238, 2351–2357 CAS.
- J. R. Lakowicz, Principles of Fluorescence Spectroscopy, Springer Science, New York, 2007, ch. 10 Search PubMed.
Footnotes |
| † Electronic supplementary information (ESI) available: Experimental methods and any associated references. Table S1, Fig. S1–S10. See DOI: 10.1039/c6sc01272h |
| ‡ These authors contributed equally. |
| This journal is © The Royal Society of Chemistry 2016 |