
 Open Access Article
 This Open Access Article is licensed under a
 Creative Commons Attribution 3.0 Unported Licence
Understanding the origin of photoelectrode performance enhancement by probing surface kinetics†
James E.
Thorne
 ,
Ji-Wook
Jang
,
Erik Y.
Liu
and
Dunwei
Wang
*
,
Ji-Wook
Jang
,
Erik Y.
Liu
and
Dunwei
Wang
*
Department of Chemistry, Boston College, Merkert Chemistry Center, 2609 Beacon St., Chestnut Hill, MA 02467, USA. E-mail: dunwei.wang@bc.edu
First published on 11th February 2016
Abstract
Photoelectrochemical (PEC) water splitting holds the potential to meet the challenges associated with the intermittent nature of sunlight. Catalysts have often been shown to improve the performance of PEC water splitting, but their working mechanisms are not well understood. Using intensity modulated photocurrent spectroscopy (IMPS), we determined the rate constants of water oxidation and recombination at the surface of three different hematite-based photoanodes. It was found that the best performing electrodes, in terms of photocurrent onset potential, exhibited the slowest water oxidation rate constants, which was a surprise. The performance of these photoelectrodes was enabled by the slow surface recombination. When amorphous NiFeOx, a water oxidation catalyst, was present, the rate of surface hole transfer actually slowed down; what was slowed more was the recombination rate at the hematite surface, resulting in better water oxidation performance. As such, NiFeOx primarily serves as a passivation layer rather than a catalytic layer. Together a better understanding of the role of catalytic overlayers for water oxidation has been achieved.
Introduction
Solar water splitting is an important first step in photosynthesis. Plants utilize the harvested solar energy to extract electrons from H2O, providing enough thermodynamic energy to reduce carbon dioxide during the dark reactions.1 Given the vast availability of H2O and sunlight, solar water splitting holds great potential for direct solar energy conversion and storage.2 For complete water splitting, two fundamentally important processes, the reduction reaction and the oxidation reaction, need to be balanced. Due to the complex 4-electron/4-proton nature, the water oxidation reaction tends to be more difficult and slower than the reduction reaction. This highlights the necessity for the addition of catalysts to facilitate hole transfer to H2O for O2 evolution.3 A number of materials, including IrOx, CoOx, RuOx, NiFeOx, Co–phosphate, NiOOH, and more recently a molecular heterogenized Ir, have been confirmed as active catalysts toward the O2 evolution reaction (OER).3–10 However, when integrated with light absorbers, the role of these catalysts is often a source of confusion and debate (vide infra). This is because the presence of catalysts on a photoelectrode surface not only changes the charge transfer kinetics, but they can also alter the surface energetics that define the charge separation capabilities near the photoelectrode surface.11 Further development of the water splitting field will require a detailed understanding of the mechanisms that underpin the observed performance, which in turn depends on the quantitative measurement of surface energies and charge transfer kinetics. Using hematite as a prototypical photoelectrode system, we show that surface modifications of hematite by either a re-growth strategy or with an amorphous NiFeOx catalyst serve to reduce surface recombination. Whereas, the charge transfer kinetics are either slower or remain unchanged for all scenarios studied here, strongly supporting that a surface passivation effect is the key reason for the observed improvement in water oxidation by hematite.Hematite was chosen as the material for the present study as it has been at the center of a recent debate about how catalysts alter the photoanodic characteristics of water oxidation.12,13 Despite the appeals of low cost and good stability, hematite faces great challenges as a photoelectrode material due to its low photovoltages and poor catalytic activities.14–16 The slow hole transfer kinetics across the hematite/water interface, in particular, has been considered a key reason for the low photovoltages.17,18 Therefore there have been numerous attempts targeted at reducing the kinetic overpotentials in hopes to overcome the issues connected to the slow surface kinetics and improve the onset potential to more cathodic potentials. For example, Grätzel et al. applied CoII onto hematite's surface and observed appreciable cathodic shift of the steady-state current–voltage relationship (∼80 mV), which was thought as a direct proof of how fast hole transfer improves the photoelectrochemical (PEC) performance.19 A more pronounced effect was observed by Gamelin et al. with a Co–phosphate OER catalyst (Co–Pi; 200 mV),20 with similar phenomena having been reported on other catalyst/photoelectrode combinations.21–23 However, the view that the change in the PEC performance was due to better charge transfer was challenged by Durrant et al.'s transient absorption measurements, where longer surface hole lifetimes, rather than faster hole transfer kinetics, were concluded to be the reason for the cathodic shift.24 Subsequent detailed electrochemical studies by Hamann and Bisquert et al. suggested that Co–Pi on hematite may serve dual functionalities of promoting charge transfer and building up hole concentrations.25 Their results, nevertheless, do not fully settle the debate as a quantitative understanding of the system is still missing. In parallel, our group has conducted studies on combining amorphous NiFeOx with hematite and attributed the cathodic shift in onset potential to better charge separation.26,27 Our key experimental evidence comes from the measurement of the surface energies of the system under equilibrium or pseudo-equilibrium conditions. With the addition of a-NiFeOx to the surface of our regrown hematite samples, we have achieved the best turn on potential observed for hematite (0.45 V vs. RHE).28 However, our initial studies indicate that the cathodic shift in onset potential is mostly, if not entirely, due to surface energetics rather than improved water oxidation kinetics. Again, for a complete understanding of the system, quantitative measurements of the surface charge transfer kinetics are necessary. The results reported herein fill in this knowledge gap.
On a fundamental level, the key driving force of a photoanodic reaction is the accumulation of energetic holes on the photoelectrode surfaces. While the detailed dependence of the reaction rate on the hole concentration may be intricate, as revealed by several recent studies, a high steady-state surface hole concentration is generally desired,29 where a higher concentration of surface holes results in higher photovoltages that help reduce the need for externally applied potentials. To the first order approximation, the rate at which the holes are generated depends on the light absorption and charge separation of the photoelectrode, as well as the light intensity. The rate at which the holes disappear depends on the rate of surface recombination and hole transfer into the solution. Note that contributions by bulk recombination may be regarded as part of the photoelectrode charge separation and is not considered here. We see from this simplified argument that, for a given system under fixed lighting conditions, detailed knowledge of surface recombination rates and charge transfer kinetics is critically important. Although the information may be inferred by probing hole concentrations using, for instance, spectroscopic methods, or by fitting electrochemical impedance data,30–32 a direct measure of these kinetic parameters is of great value. For this purpose, we employed a technique pioneered by Peter et al., known as intensity modulated photocurrent spectroscopy (IMPS).33 In using IMPS, we are presented with an opportunity to systematically compare samples of different surfaces that feature different PEC performance. This information leads to a better understanding of the kinetics at the photoelectrode/water interface that has been missing in the literature. By examining hematite prepared by three different methods (atomic layer deposition (denoted as aH), solution synthesis (denoted as sdH), and re-growth treated (denoted as rgH); see Experimental section for details) with and without surface modifications (amorphous NiFeOx catalysts), we show that in all cases the cathodic shift of PEC water oxidation is only driven by the suppression of surface recombination, while no contribution by faster hole transfer kinetics was observed.
IMPS is a form of impedance spectroscopy that measures the phase shift in photocurrent in relation to a sinusoidal modulation of the light source.33 By assuming that the small changes in the light intensity only alter surface charge concentrations but not the degree of band bending, IMPS probes how the photocurrent of a PEC system responds to these changes in light intensity. The complex photocurrent, as a function of the light modulation frequency, may be presented in a Nyquist plot (Fig. 1). In this plot, at the high-frequency intercept with the real photocurrent axis, the surface recombination rate is insufficient to match the rate at which the surface hole concentrations change as a result of light intensity modulations. This value provides a measure of the hole flux moving toward the photoelectrode surface. Note that in hematite samples the bulk recombination kinetics are much faster than the surface recombination kinetics, and a separate technique is needed in order to study bulk recombination rates. At the low frequency intercept, it reports on the steady-state photocurrent, which measures the rate at which the charges are transferred to the solution for water oxidation. The ratio of the photocurrents between the low-frequency intercept and the high-frequency one provides the charge transfer efficiency (TE), defined as ktran/(ktran + krec), where ktran and krec are the surface charge transfer and recombination rate constants, respectively. The rate constants at the apex of the semicircle, where the maximum phase shift is measured, reports on the combined rate of charge transfer and recombination (ktran + krec), where the effective hole transfer from the semiconductor is the measured ktran. The theoretical basis for IMPS was developed by Peter et al. in a series of publications,33,34 and has been recently applied to study hematite.35,36 By extending the technique to a systematic study of a series of photoelectrodes with the same crystal structure but different surfaces, we unambiguously confirm that the passivation effect, rather than better surface catalytic activities, is the true reason for the observed PEC performance improvement. As such, the results presented here are new and significant.
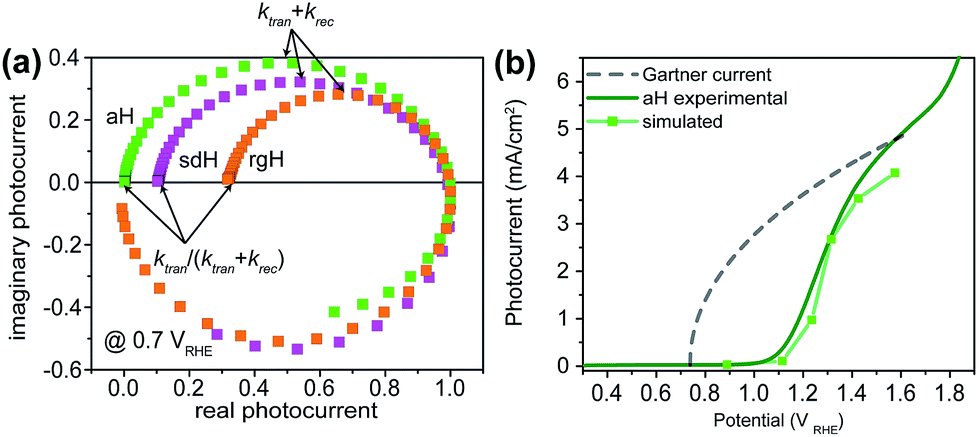 | ||
| Fig. 1 Representative IMPS and PEC data for hematite under monochromic illuminations (λ = 405 nm; intensity: 134 mW cm−2). (a) Nyquist plots of the three bare samples, aH, sdH, and rgH, at an applied potential of 0.7 V vs. RHE (reversible hydrogen electrode). The sample IDs are explained in the main text. The two key parts in the plots used for data analysis are highlighted by arrows. The real and imaginary photocurrents are normalized to the high frequency intercept, which represents the hole flux toward the surface. (b) Using transfer efficiency extracted from IMPS data and the Gärtner equation, we obtained the photocurrent for ALD hematite (light green between squares), which is in agreement with the experimental steady-state current–voltage curve (dark green). | ||
Results and discussion
Summary of samples studied
A total of 6 types of samples were studied here. They were based on three different synthesis methods, (1) atomic layer deposition (ALD) grown hematite (aH); (2) solution derived hematite (sdH); and (3) hematite subjected to surface regrowth (rgH; note that here rgH refers to hematite that has been subjected to regrowth treatments twice). The details of their syntheses have been recently reported elsewhere and are summarized in the Experimental section.28 Among these samples, aH features a high degree of surface states and the highest turn-on voltages (Von, as defined by the lowest applied potential at which appreciable photocurrents are measured). The rgH samples exhibit the lowest Von's. In addition to samples with bare surfaces, studies were performed on samples coated with amorphous NiFeOx and GaOx.IMPS data and validation of the technique for the present study
A set of representative Nyquist plots for bare hematite are shown in Fig. 1a, from which the surface charge transfer efficiencies (TE = ktran/(ktran + krec)) were extracted. The hole flux into the photoelectrode surface can be calculated following the Gärtner relation (eqn (1)). Here the Gärtner equation is employed for its simplicity. A more complete treatment that considers the recombination in the space charge region and back flow of electrons to the electrolyte has been developed by Reichman.37 Intriguingly, when the charge transfer efficiency is combined with the Gärtner model, a close match with the experimental data is already obtained, raising a question as to how significant the recombination in the space charge region is in limiting the performance of hematite. Here we assume the depletion width (WSC) changes with the applied potential (Vapp) following, WSC = (2εε0(Vapp − Vfb)/ND)1/2, where ε = 60 is the dielectric constant of hematite; ε0 is vacuum permittivity; Vfb = 0.73 V vs. RHE (reversible hydrogen electrode) is the flatband potential for aH; and ND = 2.65 × 1019 cm−3 is the carrier concentration. Both Vfb and ND were measured by the Mott–Schottky method (see ESI†). The measurable photocurrent was then obtained by combining the Gärtner hole flux with TE, as is described in eqn (1):| J = J0(1 − exp(αWSC/(1 + αLp)))TE | (1) |
At λ = 405 nm, an absorption coefficient (α) of 1.0 × 105 cm−1 was used. The hole diffusion distance of 3 nm was used, as hematite typically has a value of 2–4.38 Guided by our previous research, a reflection of 20% was considered for the light intensity (J0).28 Finally, the potential drop within the Helmholtz layer was compensated for (see ESI†). As seen in Fig. 1b, a close match between the simulated photocurrent, based on the TE obtained from the IMPS data, and the experimental data was obtained. Importantly, since all parameters have physical significance, the match was achieved without adjusting any parameters. Seeing how the TE can correct the Gärtner current for surface processes shows the power of IMPS as a tool to examine surface kinetics, and encouraged us to employ it in a systemic study of hematite's surfaces.
Rate constants of charge transfer and surface recombination for bare hematite
The charge transfer rate constant (ktran) and surface recombination rate constant (krec) were obtained by combining the TE at the low-frequency intercept with ktran + krec, as determined by the apex of the semicircle in Fig. 1a. Note that a first order dependence of the reaction rate on the hole concentration is assumed here. The assumption is consistent with experimental results reported to date. Recently, Durrant et al. observed that at 1.5 V a transition from 1st to 3rd order reactions took place at high light intensities.29 The third order reactions would indeed make the data interpretation more difficult. Nevertheless, we have found a close correlation between our measured water oxidation rate constants with previously reported values, confirming that the water oxidation as measured in our experiments is likely first order. As shown in Fig. 2, a monotonic decrease of krec is observed for all three bare hematite samples studied here. Notably, the recombination rate constants across the entire potential range are much higher for aH than sdH or rgH. This trend agrees with our previous observation by X-ray absorption that greater defect densities are present on aH and lowest for rgH.28 The second notable feature of this set of data is the ktran for aH is on the rising curve at V > Von, whereas ktran's for sdH and rgH plateau at ∼120 s−1 and ∼35 s−1, respectively. The results suggest that the mechanisms involved in water oxidation may be different for hematite with different surfaces. This is consistent with literature reports that water oxidation by hematite is mediated by surface-adsorbed species (also denoted as “surface states”).27,39 Thirdly, krec for aH is considerably higher near the turn-on potential (167 s−1 at 1.1 V) than that for sdH (110 s−1 at 0.9 V), which is still higher than that for rgH (27 s−1 at 0.8 V). This supports that surface regrowth treatment indeed reduces surface recombination, as we previously concluded by open-circuit potential measurements.28 Lastly, the potential at which ktran surpasses krec coincides with the Von, further proving that IMPS provides a valid measure of the surface kinetic constants.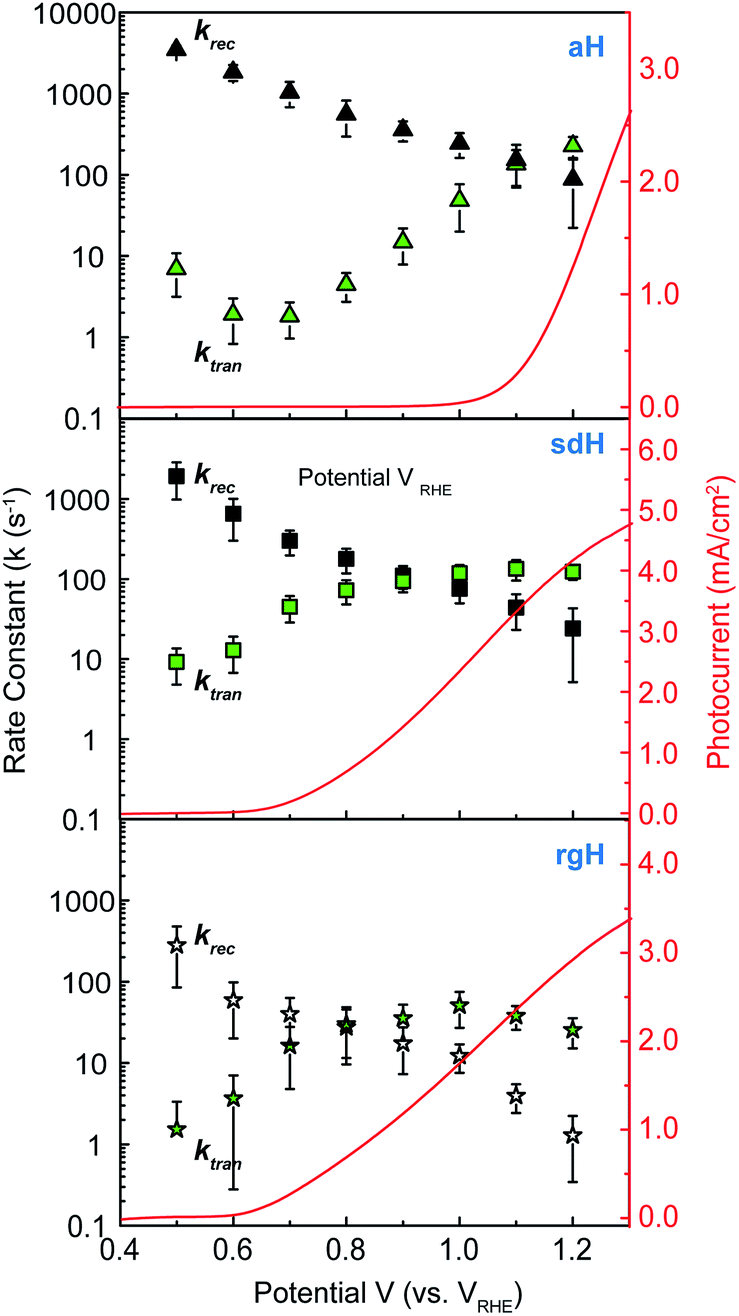 | ||
| Fig. 2 Rate constants extracted from IMPS data at different applied potentials. Top: aH; middle: sdH; and bottom: rgH. Rate constants of recombination are shown as black symbols; rate constants for surface charge transfer are shown as green symbols. The error bar is the standard deviation between different samples (typically 4 to 5 samples are measured for each group of data). | ||
It is further noted that for a PEC system, a higher light intensity is expected to lead to a greater degree of quasi-Fermi level splitting. The corresponding driving force for hole transfer would increase, as well. Consequently, faster charge transfer (i.e., greater ktran) is expected as light intensity is increased. This trend is indeed observed in our control experiments, where ktran increases with light intensity monotonically (Fig. S6†).
Rate constants of hematite photoelectrodes with NiFeOx catalysts
With the presence of NiFeOx as an OER catalyst, a distinctly different trend of krec and ktran was observed than when compared to the bare hematite photoelectrodes. As shown in Fig. 3, ktran appeared to be independent of Vapp. A similar phenomenon has been previously observed by Peter et al. on Co-treated hematite photoelectrodes.35 However, there are several features of this set of data that deserve further discussion. First, ktran's for all photoelectrodes decorated by NiFeOx are equal to or smaller than those without the catalyst. This is a surprise since the presence of a catalyst was expected to increase water oxidation rates. Rather, a significant suppression of the krec's was found, as shown in Fig. 3a. It is therefore concluded that the main function of NiFeOx is to passivate the hematite surfaces against recombination by reducing the surface Fermi pinning, effectively increasing the band bending at the surface, rather than activating the surface for water oxidation. Note that the smaller ktran measured here on NiFeOx does not suggest water oxidation is slower. After all, NiFeOx has been confirmed as a good water oxidation catalyst.3ktran, as measured by IMPS, likely reports on the rate determining steps (RDS) of the complex charge transfer processes from the photoelectrode to water. These results agree with Durrant et al. measurements of Co–Pi coated hematite photoelectrodes.17,40 They also agree with our open-circuit potential measurements.26,27,41 Second, the ktran's for aH and sdH are comparable when NiFeOx is present on the surfaces across the entire voltage range (Fig. 3a). It supports that the water oxidation processes are now governed by NiFeOx. But the ktran's for rgH photoelectrodes are considerably lower, by almost a factor of 5. A possible reason is that the NiFeOx employed here is ca. 10 nm in thickness. Its functionality may be influenced by the interface between hematite and NiFeOx. Another reason is that ktran as measured here is the apparent charge transfer rate constant of the RDS that follows a first order dependence on the hole concentration, which may be an oversimplification of the complex water oxidation process. More research is needed to fully understand the differences. Despite rgH's slow ktran's, the krec's for the rgH photoelectrodes are much slower than krec's for sdH or aH, by more than 10 times across the entire voltage range, further highlighting the importance of measuring photocurrent is a high TE but not necessarily a high ktran (vide infra).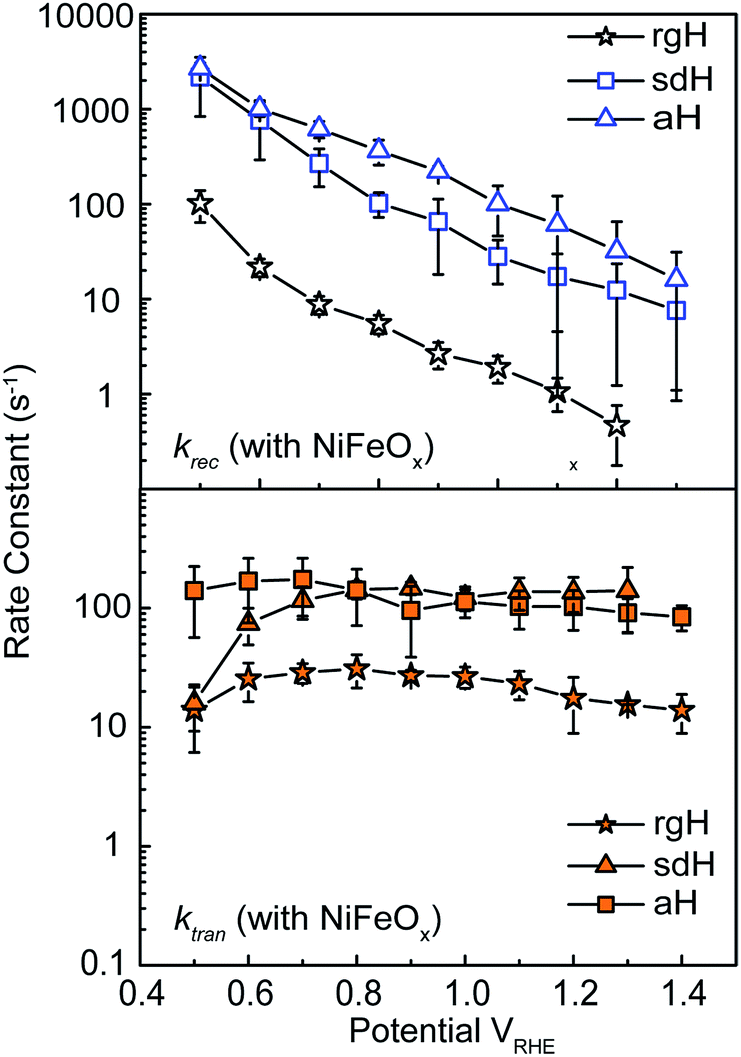 | ||
| Fig. 3 Rate constants for hematite photoelectrodes with NiFeOx surface decorations. Top: recombination rate constants for photoelectrodes by three different preparation methods; bottom: surface charge transfer rate constants for the same photoelectrodes. The error bars are standard deviations between different samples. | ||
The large decrease in krec led to rgH photoelectrodes having the best measured TE (Fig. 4), consistent with the observation that the best PEC performance, in terms of photovoltages and photocurrents, was measured on rgH. It highlights that as far as PEC performance is concerned, it is equally, if not more, important to consider krec as well as ktran, as defined by the TE. Examining eqn (1), we see that so long as the light absorption and charge separation by the photoelectrode are fixed, the determining factor for the measurable photocurrent is the TE. In other words, under the likely assumption that the main mechanisms to dissipate surface holes are charge transfer for water oxidation and surface recombination, fast water oxidation kinetics is not a prerequisite for good anodic PEC performance, so long as surface recombination can be minimized. This understanding has major implications for water oxidation reactions because, as the overall reactions are multi-electron, multi-proton in nature, they are considered inherently slow, with the characteristic rate constants in the range of millisecond (ms) or longer.32,35 Our data in Fig. 2 and 3 support such an estimate. By comparison, charge lifetimes within the bulk of semiconductors are typically in the microsecond (μs) or shorter time scales. This disparity of time scales creates a major challenge. In order to beneficially balance the effects of the solid state and water oxidation processes it is necessary to consider their resulting interactions. It is known that the thermodynamic energy of holes on the surface of a photoanode is connected to the hole concentration by: Vph = (kBT/q)ln(Ps/P0s), where Vph is the photovoltage as defined by the difference between the quasi-Fermi level of holes (Ef,h) and flatband potential (Vfb): Vph = Ef,h − Vfb; kB is the Boltzmann constant, T is the temperature, q is the fundamental charge of electrons, Ps is the steady-state surface hole concentration under light, and P0s is the equilibrium surface hole concentration under dark. It is seen that greater steady-state surface hole concentration, which is determined by the transfer efficiency, translates to higher Vph and is desired for greater oxidation power. From this standpoint, the slow kinetic constants in both recombination and charge transfer, but more so in the slow recombination, is desired as it contributes to the build-up of surface hole concentrations, which translates to greater photovoltages. The interplay between Vph and TE has been confirmed by our earlier work, where Vph of 0.56 V and 0.8 V was measured on rgH without and with NiFeOx, respectively.28 As a comparison, only 0.24 V was measured on bare aH, whereas 0.42 V and 0.66 V was measured on sdH without and with NiFeOx, respectively.28
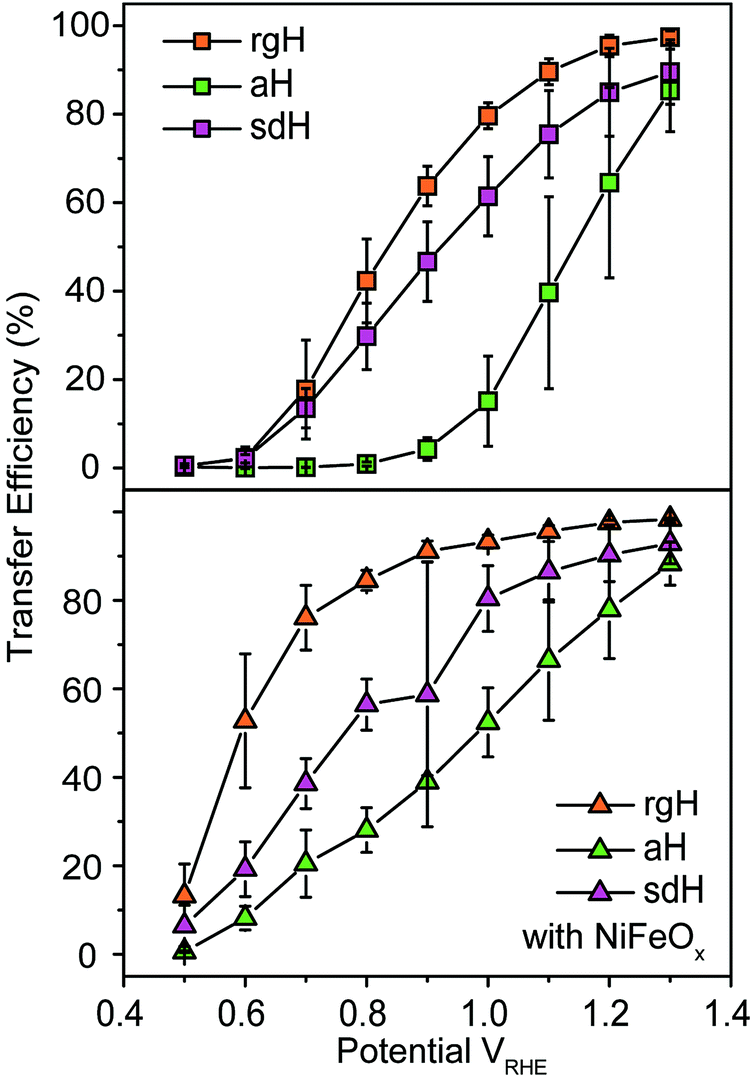 | ||
| Fig. 4 Charge transfer efficiencies for various hematite photoelectrodes without (top panel) and with (bottom panel) NiFeOx decorations at different applied potentials. | ||
Rate constants of hematite photoelectrodes decorated with GaOx passivation
As a control experiment, we next performed IMPS characterizations on GaOx-treated hematite photoelectrodes (sdH was studied here). GaOx was chosen here as it has previously been shown by Grätzel et al. to passivate the surfaces of hematite,42 and Durrant et al. have also shown that GaOx behaves similarly to Co–Pi on hematite when they studied the transient decay kinetics.40 No known catalytic effects of water oxidation were reported on GaOx. The IMPS data as shown in Fig. 5 are to be compared with those in Fig. 2 and 3. It is seen that within the range of 0.6 and 1.0 V vs. VRHE, ktran's for both hematite with and without GaOx only increased marginally. In contrast, krec's are significantly reduced due to the application of GaOx. The trend is consistent with that in Fig. 2 for bare sdH. These data further support Grätzel's proposition that GaOx improves the PEC performance of hematite by passivating the surfaces.42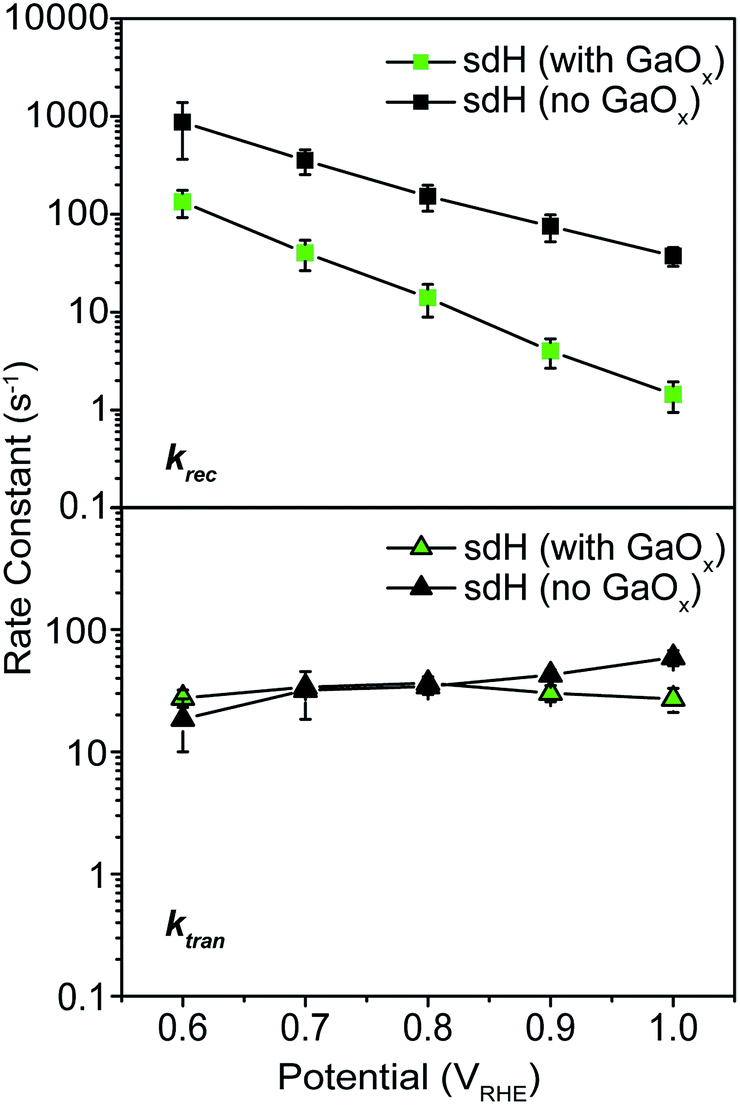 | ||
| Fig. 5 Rate constants for hematite treated with GaOx passivation. Top: recombination; bottom: transfer. | ||
IMPS studies of PEC systems with H2O2 as hole scavengers
As a hole scavenger that features fast charge transfer, H2O2 has been frequently used in studies on photoanodes.43,44 For instance, it is so efficient in receiving holes that in its presence the charge collection efficiency has been considered unity. Our next task was to carry out IMPS studies with H2O2 present, and the purpose was to measure charge transfer efficiencies (TE). As expected, near unity TE was obtained (Fig. 6) when 0.05 M H2O2 was added to the electrolyte. Under these conditions, because ktran is significantly greater than krec, the same analysis as outlined above in extracting ktran and krec is no longer suitable. For this reason, no quantitative rate constant calculations were performed using IMPS. | ||
| Fig. 6 Characterizations with H2O2 as hole scavengers. (a) Steady-state current–voltage curves for sdH with (red) and without (black) H2O2. (b) IMPS data of sdH with (red) and without (black) H2O2 at 0.7 V vs. RHE. | ||
Intensity modulated photovoltage characterizations with and without hole scavengers
An alternative measurement enabled by the varying light intensities is IMVS (intensity modulate photovoltage spectroscopy). Different from IMPS, IMVS probes the how the photovoltage changes as a function of the frequency of the perturbation to the light intensity under open circuit conditions. Since the external circuit is open, the net exchange current is expected to be zero. Changes in the surface hole concentration as probed by the photovoltage are expected to chiefly respond to surface recombination. When presented in Bode plots (Fig. 7), the peak frequencies report on the characteristic rate constants of surface charge recombination. In the absence of H2O2, two peaks are observed (top panel, Fig. 7). The first peak, at the higher rate constant, corresponds to a rate constant of approximately 1000 s−1 or faster for all three electrodes studied. When understood as surface recombination rate constants, these values agree with those obtained by analyzing IMPS data (Fig. 2). The corresponding processes are likely connected to states due to H2O adsorption onto hematite. This agrees with our previous research that these states are due to chemical adsorption rather than structural defects.27 It is also consistent with a recent EIS study by Hamann et al. on hematite for methanol oxidation.39 That the peak positions by and large remain the same for all three types of hematite electrodes further supports this understanding. Furthermore, the addition of H2O2 does not shift these peaks (Fig. 7, bottom panel) because the majority chemicals are still H2O in the latter case. It is noted that the measured steady-state open circuit potentials under the same lighting conditions for this set of experiments were 0.53 V, 0.52 V, and 0.49 V (vs. VRHE) for aH, sdH, and rgH, respectively. These values need to be taken into account when comparing the rate constants obtained in Fig. 7 and with those in Fig. 2.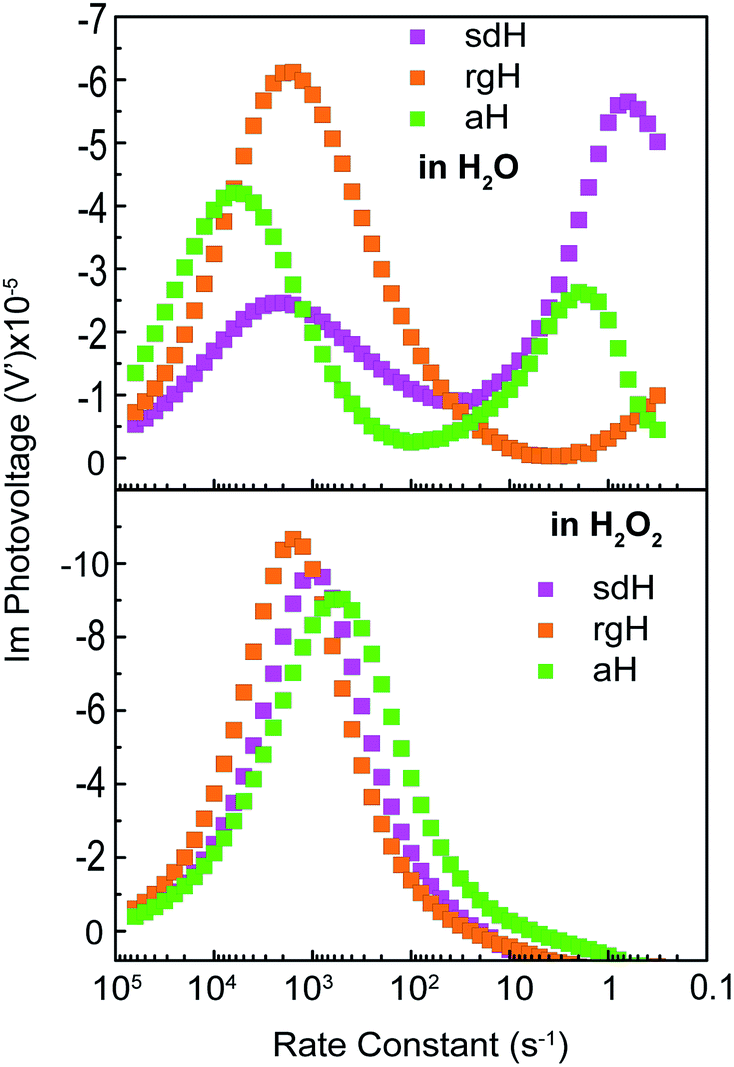 | ||
| Fig. 7 Intensity modulate photovoltage spectroscopy (IMVS) of various hematite photoelectrodes in H2O (top) and in H2O2 (bottom). Data presented as Bode plots, where the Y axis shows the imaginary component of the complex photovoltage, and the X axis shows the rate constants converted from the modulation frequencies. | ||
The second peak, only observed in the absence of H2O2, appears at much lower frequencies. At 5 s−1 or slower, this rate constant likely corresponds to recombination by states directly connected to water oxidation. Under open circuit conditions, although the net exchange current is zero, charge transfer to oxidize H2O still takes places, albeit in a transient fashion as a continued H2O oxidation cannot be sustained. That is, the transferred charges will be annihilated by processes akin to back electron transfer that has been observed in studies on dye-sensitized solar cells.45,46 As such, it is reasonable to understand the second rate constants as water oxidation kinetics. There are two pieces of evidence that support this understanding. First, the peak rate constant for aH is the highest, followed by that of sdH. The peak for rgH is still developing, and the corresponding rate constants are likely slower than 0.1 s−1. The trend and the rate constants quasi-quantitatively agree with those presented in Fig. 2. Second, while the first group of peaks remains unchanged in the presence of H2O2, the second group disappeared completely, supporting that the second peaks are indeed connected to water oxidation (but not H2O2 oxidation). Taken as a whole, we understand the IMVS data as an additional proof that measurements under modulated lighting conditions can provide valuable surface kinetic information.
Conclusions
In conclusion, we measured the surface charge recombination and transfer rate constants in a quantitative fashion. As summarized in Fig. 8, our key results are that the regrowth procedures and surface decorations by NiFeOx OER catalyst improve the PEC performance by reducing surface recombination. Charge transfer rate constants remained unchanged for all samples studied. It was understood that slower surface recombination rates help to increase surface hole concentrations, which is measured as greater surface photovoltages. Together, with a higher charge transfer efficiency, more holes with higher energies are transferred to the solution for water oxidation. As such, for all surface decorations studied here, a passivation effect prevails. We envision that while maintaining a slow surface recombination rate, faster charge transfer should indeed lead to even better PEC performance. | ||
| Fig. 8 Surface decorations on hematite improves the overall PEC performance by reducing surface recombination. Compared with bare hematite (left), NiFeOx does not change ktran (right). Instead, it reduces the recombination rate constant (krec) greatly. | ||
Experimental
Hematite preparation
For the sdH and rgH syntheses, β-FeOOH was first grown on fluorine-doped tin oxide (FTO) substrates (∼7 Ω sq−1, Sigma) in a solution containing 0.15 M iron(III) chloride hexahydrate (FeCl3, 97%, Alfa Aesar) and 1 M sodium nitrate (NaNO3, 99%, Alfa Aesar). The deposition was carried out at 100 °C for 1 h. After rinsing, the electrodes were annealed in a tube furnace at 800 °C for 5 minutes to convert β-FeOOH into hematite. For the rgH electrodes they were subjected to the same procedure one more time.For aH (ALD) samples a Cambridge Nanotech, Savannah 100 atomic layer deposition apparatus was used. Iron tert-butoxide (heated to 125 °C) and water (25 °C) were used as the precursors for hematite and were pulsed alternatingly into the deposition chamber (heated to 180 °C) with a 10 cm3 min−1 flow of N2 as carrier gas. 500 cycles was used to produce films between 20–30 nm thick, grown onto FTO.26 Following the deposition, the samples were annealed at 500 °C for 15 minutes in air to assure all samples were completely converted into hematite.
NiFeOx/GaOx deposition
To deposit NiFeOx, Iron(III) 2-ethylhexanoate (50% w/w in mineral spirits, Strem Chemicals) and nickel(II) 2-ethylhexanoate (78% w/w in 2-ethylhexanoic acid, Strem Chemicals) were mixed in hexane to give a concentration of 15% w/w metal complex solution. The solution was further diluted 10 times with hexane and approximately 10 μL cm−2 of this solution was directly drop-casted onto the hematite electrodes. After drying in air for 5 minutes, the electrode was irradiated with UV light for 5 minutes.GaOx depositions were done following a previously reported procedure with slight adjustments.42 Hematite films were immersed in 50 mL of water at approximately 348 K. 0.209 g Ga(NO3)3·nH2O (99.9%, Aldrich) and 3.01 g of urea (99%, Aldrich) were added sequentially with an interval of 2 minutes under mild stirring. 20 min after the urea addition, the samples were rinsed with deionized water and annealed in a tube furnace at 1073 K for 5 minutes to improve crystallinity and stability.
Characterization
To characterize the hematite films a Solartron Modulab XM potentiostat with a photoelectrochemical accessory was used for all current–voltage, IMPS, and IMVS measurements. Measurements were made in 1 M NaOH. A 3-electrode configuration was used with a platinum counter electrode, with a Hg/HgO reference electrode (CHI-152), and the hematite samples used as the working electrode. For the H2O2 study, 100 μL of 31 wt% H2O2 was added to 18 mL of 1 M NaOH. A 405 nm LED (ThorLabs) was used as the light source for all measurements, at 90% of its maximum power (134 mW cm−2). For IMPS and IMVS measurements a 10% modulation intensity was used, and the frequency was swept from 10 kHz down to 0.1 Hz. During the JV measurements a scan rate of 20 mV s−1 was used. All samples were measured using front side illumination.Acknowledgements
The work is funded by the NSF (DMR 1055762).Notes and references
- J. P. McEvoy and G. W. Brudvig, Chem. Rev., 2006, 106, 4455–4483 CrossRef CAS PubMed.
- M. G. Walter, E. L. Warren, J. R. McKone, S. W. Boettcher, Q. Mi, E. A. Santori and N. S. Lewis, Chem. Rev., 2010, 110, 6446–6473 CrossRef CAS PubMed.
- R. D. Smith, M. S. Prevot, R. D. Fagan, Z. Zhang, P. A. Sedach, M. K. Siu, S. Trudel and C. P. Berlinguette, Science, 2013, 340, 60–63 CrossRef CAS PubMed.
- Y. Zhao, E. A. Hernandez-Pagan, N. M. Vargas-Barbosa, J. L. Dysart and T. E. Mallouk, J. Phys. Chem. Lett., 2011, 2, 402–406 CrossRef CAS.
- X. Deng and H. Tüysüz, ACS Catal., 2014, 4, 3701–3714 CrossRef CAS.
- J. Sato, N. Saito, Y. Yamada, K. Maeda, T. Takata, J. N. Kondo, M. Hara, H. Kobayashi, K. Domen and Y. Inoue, J. Am. Chem. Soc., 2005, 127, 4150–4151 CrossRef CAS PubMed.
- M. W. Kanan, Y. Surendranath and D. G. Nocera, Chem. Soc. Rev., 2009, 38, 109–114 RSC.
- F. Lin and S. W. Boettcher, Nat. Mater., 2014, 13, 81–86 CrossRef CAS PubMed.
- S. W. Sheehan, J. M. Thomsen, U. Hintermair, R. H. Crabtree, G. W. Brudvig and C. A. Schmuttenmaer, Nat. Commun., 2015, 6, 6469 CrossRef CAS PubMed.
- W. Li, S. W. Sheehan, D. He, Y. He, X. Yao, R. L. Grimm, G. W. Brudvig and D. Wang, Angew. Chem., Int. Ed., 2015, 54, 11428–11432 CrossRef CAS PubMed.
- J. Thorne, E. Li, S. Du, C. Qin and G. Wang, J. Phys. Chem. Lett., 2015, 6, 4083–4088 CrossRef CAS PubMed.
- D. R. Gamelin, Nat. Chem., 2012, 4, 965–967 CrossRef CAS PubMed.
- K. M. H. Young, B. M. Klahr, O. Zandi and T. W. Hamann, Catal. Sci. Technol., 2013, 3, 1660–1671 CAS.
- K. Sivula, F. Le Formal and M. Grätzel, ChemSusChem, 2011, 4, 432–449 CrossRef CAS PubMed.
- M. T. Mayer, Y. Lin, G. Yuan and D. Wang, Acc. Chem. Res., 2013, 46, 1558–1566 CrossRef CAS PubMed.
- T. W. Hamann, Dalton Trans., 2012, 41, 7830–7834 RSC.
- A. J. Cowan, C. J. Barnett, S. R. Pendlebury, M. Barroso, K. Sivula, M. Grätzel, J. R. Durrant and D. R. Klug, J. Am. Chem. Soc., 2011, 133, 10134–10140 CrossRef CAS PubMed.
- M. P. Dare-Edwards, J. B. Goodenough, A. Hamnett and P. R. Trevellick, J. Chem. Soc., Faraday Trans. 1, 1983, 79, 2027–2041 RSC.
- A. Kay, I. Cesar and M. Grätzel, J. Am. Chem. Soc., 2006, 128, 15714–15721 CrossRef CAS PubMed.
- D. K. Zhong and D. R. Gamelin, J. Am. Chem. Soc., 2010, 132, 4202–4207 CrossRef CAS PubMed.
- E. M. P. Steinmiller and K.-S. Choi, Proc. Natl. Acad. Sci. U. S. A., 2009, 106, 20633–20636 CrossRef CAS PubMed.
- J. A. Seabold and K.-S. Choi, Chem. Mater., 2011, 23, 1105–1112 CrossRef CAS.
- H. Ye, H. S. Park and A. J. Bard, J. Phys. Chem. C, 2011, 115, 12464–12470 CAS.
- M. Barroso, A. J. Cowan, S. R. Pendlebury, M. Grätzel, D. R. Klug and J. R. Durrant, J. Am. Chem. Soc., 2011, 133, 14868–14871 CrossRef CAS PubMed.
- B. Klahr, S. Gimenez, F. Fabregat-Santiago, J. Bisquert and T. W. Hamann, J. Am. Chem. Soc., 2012, 134, 16693–16700 CrossRef CAS PubMed.
- C. Du, X. Yang, M. T. Mayer, H. Hoyt, J. Xie, G. McMahon, G. Bischoping and D. Wang, Angew. Chem., Int. Ed., 2013, 52, 12692–12695 CrossRef CAS PubMed.
- C. Du, M. Zhang, J.-W. Jang, Y. Liu, G.-Y. Liu and D. Wang, J. Phys. Chem. C, 2014, 118, 17054–17059 CAS.
- J.-W. Jang, C. Du, Y. Ye, Y. Lin, X. Yao, J. Thorne, E. Liu, G. McMahon, J. Zhu, A. Javey, J. Guo and D. Wang, Nat. Commun., 2015, 6, 7447 CrossRef PubMed.
- F. Le Formal, E. Pastor, S. D. Tilley, C. A. Mesa, S. R. Pendlebury, M. Grätzel and J. R. Durrant, J. Am. Chem. Soc., 2015, 137, 6629–6637 CrossRef CAS PubMed.
- G. M. Carroll, D. K. Zhong and D. R. Gamelin, Energy Environ. Sci., 2015, 8, 577–584 CAS.
- K. G. Upul Wijayantha, S. Saremi-Yarahmadi and L. M. Peter, Phys. Chem. Chem. Phys., 2011, 13, 5264–5270 RSC.
- F. Le Formal, S. R. Pendlebury, M. Cornuz, S. D. Tilley, M. Grätzel and J. R. Durrant, J. Am. Chem. Soc., 2014, 136, 2564–2574 CrossRef CAS PubMed.
- E. A. Ponomarev and L. M. Peter, J. Electroanal. Chem., 1995, 396, 219–226 CrossRef.
- L. M. Peter, E. A. Ponomarev and D. J. Fermín, J. Electroanal. Chem., 1997, 427, 79–96 CrossRef CAS.
- L. M. Peter, K. G. U. Wijayantha and A. A. Tahir, Faraday Discuss., 2012, 155, 309–322 RSC.
- H. K. Dunn, J. M. Feckl, A. Muller, D. Fattakhova-Rohlfing, S. G. Morehead, J. Roos, L. M. Peter, C. Scheu and T. Bein, Phys. Chem. Chem. Phys., 2014, 16, 24610–24620 RSC.
- J. Reichman, Appl. Phys. Lett., 1980, 36, 574–577 CrossRef CAS.
- J. H. Kennedy and K. W. Frese, J. Electrochem. Soc., 1978, 125, 709–714 CrossRef CAS.
- B. Klahr, S. Gimenez, O. Zandi, F. Fabregat-Santiago and T. Hamann, ACS Appl. Mater. Interfaces, 2015, 7, 7653–7660 CAS.
- M. Barroso, C. A. Mesa, S. R. Pendlebury, A. J. Cowan, T. Hisatomi, K. Sivula, M. Grätzel, D. R. Klug and J. R. Durrant, Proc. Natl. Acad. Sci. U. S. A., 2012, 109, 15640–15645 CrossRef CAS PubMed.
- X. Yang, C. Du, R. Liu, J. Xie and D. Wang, J. Catal., 2013, 304, 86–91 CrossRef CAS.
- T. Hisatomi, F. Le Formal, M. Cornuz, J. Brillet, N. Tetreault, K. Sivula and M. Gratzel, Energy Environ. Sci., 2011, 4, 2512–2515 CAS.
- F. F. Abdi, L. Han, A. H. M. Smets, M. Zeman, B. Dam and R. van de Krol, Nat. Commun., 2013, 4, 2195 Search PubMed.
- H. Dotan, K. Sivula, M. Gratzel, A. Rothschild and S. C. Warren, Energy Environ. Sci., 2011, 4, 958–964 CAS.
- J. Krüger, R. Plass, M. Grätzel, P. J. Cameron and L. M. Peter, J. Phys. Chem. B, 2003, 107, 7536–7539 CrossRef.
- G. Schlichthörl, S. Y. Huang, J. Sprague and A. J. Frank, J. Phys. Chem. B, 1997, 101, 8141–8155 CrossRef.
Footnote |
| † Electronic supplementary information (ESI) available: Calculations of Gärtner currents, JV curves of films, further IMPS data. See DOI: 10.1039/c5sc04519c |
| This journal is © The Royal Society of Chemistry 2016 |