DOI:
10.1039/C5SC04242A
(Edge Article)
Chem. Sci., 2016,
7, 2768-2774
Flat-on ambipolar triphenylamine/C60 nano-stacks formed from the self-organization of a pyramid-sphere-shaped amphiphile†
Received
7th November 2015
, Accepted 25th December 2015
First published on 4th January 2016
Abstract
A giant amphiphile, which is constructed with an amorphous nano-pyramid (triphenylamine, TPA) and a crystalline nano-sphere (C60), was synthesized. Structural characterization indicates that this pyramid-sphere-shaped amphiphile (TPA–C60) forms a solvent-induced ordered phase, in which the two constituent units self-assemble into alternating stacks of two-dimensional (2D) TPA and C60 nano-sheets. Due to the complexity of the molecular structure and the amorphous nature of the nano-pyramid, phase formation was driven by intermolecular C60–C60 interactions and the ordered phase could not be reformed from the TPA–C60 melt. Oriented crystal arrays of TPA–C60, which contain flat-on TPA/C60 nano-stacks, can be obtained via a PDMS-assisted crystallization (PAC) technique. The flat-on dual-channel supramolecular structure of TPA–C60 delivered ambipolar and balanced charge-transport characteristics with an average μe of 2.11 × 10⁻⁴ cm2 V−1 s−1 and μh of 3.37 × 10⁻⁴ cm2 V−1 s−1. The anisotropic charge-transport ability of the pyramid-sphere-shaped amphiphile was further understood based on the lattice structure and the lattice orientation of TPA–C60 revealed from electron diffraction analyses.
1. Introduction
Giant amphiphiles are synthesized by covalently binding various nm-sized molecular building blocks (or so-called molecular nanoparticles (MNPs)).1 Their self-assembly processes are driven by competitive or cooperative physical interactions among the MNPs and are largely influenced by the preferred packing scheme of the constituent MNPs. The giant amphiphiles contain a wide range of emerging materials1,2 such as sphere-cube,1 sphere-board,3–5 sphere-disc,6–19 discotic-rod,20,21 cube-disk,22 and cube-board23-shaped amphiphiles. Among these giant molecules, those built with p-type and n-type conjugated moieties have attracted much attention, because of their potential applications as active units in supramolecular optoelectronics.5,24,25
Giant molecules can be constructed from crystalline mesogenic, quasicrystalline and amorphous MNPs,26 but so far, most giant amphiphiles are made with MNPs that are intrinsically crystalline. Triphenylamine (TPA)-based conjugated molecules are widely used in organic light emitting diodes (OLEDs),27,28 polymer solar cells (PSCs),29 and perovskite solar cells,30 because of their good morphological stability and p-type semiconducting characteristics. However, they are rarely reported as MNPs of giant amphiphiles, probably due to their nonplanar structure and amorphous nature.27,28 The incorporation of this pyramidal nano-building block raises interesting questions, such as whether the self-organization of a giant amphiphile will be compromised due to the presence of an amorphous nano-pyramid, or on the other hand, whether the amorphous nano-pyramid will self-organize because the other MNP of the giant amphiphile tends to crystallize. To explore these questions, a giant pyramid-sphere-shaped amphiphile, TPA–C60, which is constructed with the amorphous nano-pyramid (TPA) and the crystalline nano-sphere (C60), was designed and synthesized based on Steglich esterification and copper-catalyzed azide–alkyne cycloaddition (CuAAC), as shown in Scheme 1. The phase behavior and phase structure of TPA–C60 were investigated via differential scanning calorimetry (DSC) and electron diffraction (ED). The field effect transistor (FET) characteristics of TPA–C60 were evaluated with oriented TPA–C60 crystal arrays prepared via the PDMS-assisted crystallization (PAC) method.31 The results show that the pyramid-sphere-shaped amphiphile self-organized into an ordered phase containing stacks of alternating two-dimensional (2D) C60 and TPA nanosheets. Moreover, this dual-channel supramolecular structure of TPA–C60 delivered ambipolar and balanced charge-transport characteristics in organic field-effect transistors (OFETs). Previous studies showed that TPA and C60 have preferable physical interactions and tend to form a mixed TPA/C60 domain in the solid-state.32–34 However, with respect to functions, the mixed TPA/C60 domain is not conducive to ambipolar charge transport. Our study thus gives the first example of flat-on ambipolar TPA/C60 nano-stacks obtained via the self-organization of a pyramid-sphere-shaped amphiphile.
 |
| | Scheme 1 Synthetic route of TPA–C60. Reagents and conditions: (i) 8-azidooctan-1-ol, copper(II) sulfate pentahydrate, sodium ascorbate, THF/H2O (1/1, v/v); (ii) p-toluenesulfonic acid, 4-dimethylaminopyridine, 1-(3-dimethylaminopropyl)-2-ethylcarbodiimide hydrochloride, CS2. | |
2. Results and discussion
2.1. Synthesis of TPA–C60
Scheme 1 shows the synthetic route of TPA–C60. 4-Ethynyl-N,N-diphenylaniline, 8-azidooctan-1-ol, and fullerenoacetic acid (C60-COOH) were synthesized according to the literature.35 Reacting 4-ethynyl-N,N-diphenylaniline with 8-azidooctan-1-ol via the CuAAC reaction allowed the formation of a p-type pyramid unit, 8-(4-(triphenylamino)-1H-1,2,3-triazol-1-yl)octan-1-ol (TPA-OH) in 67% yield. The final product, TPA–C60, was then synthesized in 74% yield by reacting TPA-OH and C60-COOHvia Steglich esterification. TPA–C60 was characterized by 1H NMR, 13C NMR, and mass spectrometry. As shown in Fig. S1,† the formation of TPA–C60 was identified by the downfield shift of the methylene protons of TPA-OH (denoted as Ha in Fig. S1†) and the appearance of a methine proton (Hb in Fig. S1b†) at δ = 4.88 ppm, which belongs to the C60 moiety. The multiple peaks between δ = 135 and 145 ppm in the 13C-NMR spectrum of TPA–C60 (Fig. S2b†), are also characteristic of the sp2 carbons on the mono-adduct C60 moiety. Furthermore, as shown in Fig. S3,† the [M + H]+ peak of the final product has an m/z value of 1201.267, which matches well with the calculated monoisotopic mass (1201.24 Da). All the results clearly indicate the success of the reaction and confirm the chemical identity and purity of TPA–C60.
2.2. Thermal stability and phase transition
After vacuum drying using a cryo pump, thermogravimetric analysis (Fig. S4a†) showed a 5% weight loss temperature of TPA–C60 at 388 °C. As shown in Fig. S4b,† an additional weight loss peak at 131 °C was observed for a TPA–C60 sample that was only vacuum dried under a mechanical pump. The results indicate that the as-precipitated TPA–C60 contains residual solvent molecules that can be removed under high vacuum. DSC was then applied to identify the phase behaviour of the two MNPs and the pyramid-sphere-shaped amphiphile. As shown in Fig. S5a,† 4-ethynyl-N,N-diphenylaniline shows an endothermic first-order transition at 108 °C during the 1st heating, suggesting that the as-precipitated sample self-organized into an ordered phase. However, a corresponding exothermic transition in the subsequent cooling was not observed, indicating that 4-ethynyl-N,N-diphenylaniline was vitrified rather than crystallized during the cooling process. Consequently, in the 2nd heating (Fig. S5b†), the endothermic transition at 108 °C disappeared. As shown in Fig. S5c,†TPA-OH exhibits only a glass transition temperature at 10 °C. Thus, the results show the easily disturbed self-organization behaviour of the TPA unit, i.e. although 4-ethynyl-N,N-diphenylaniline self-organizes from the solution, this behaviour is lost in the melt and when a flexible alkyl group is attached. For TPA–C60, three first-order transitions at 190, 226 and 239 °C were found in the 1st heating curve of TPA–C60 (Fig. S5d†), indicating that TPA–C60 packs into an ordered solid-state structure. The multiple transitions suggest that instead of directly transforming into the isotropic melt, the ordered phase of TPA–C60 may lose its structural order (conformational, orientational, and positional orders) in a stepwise way. In the cooling curve, no exothermic peak was observed, indicating that although self-organization of TPA–C60 from solution is possible, reforming the ordered packing from the melt is difficult, probably due to the structural complexity of TPA–C60. In short, the DSC results revealed the amorphous nature of the alkylated TPA nano-pyramid and the crystalline characteristics of the TPA–C60 amphiphile. More importantly, it was found that the amorphous alkylated nano-pyramid (TPA) can self-assemble under the assistance of favourable intermolecular interactions among the crystalline nano-spheres (C60).
2.3. Phase morphology of TPA–C60
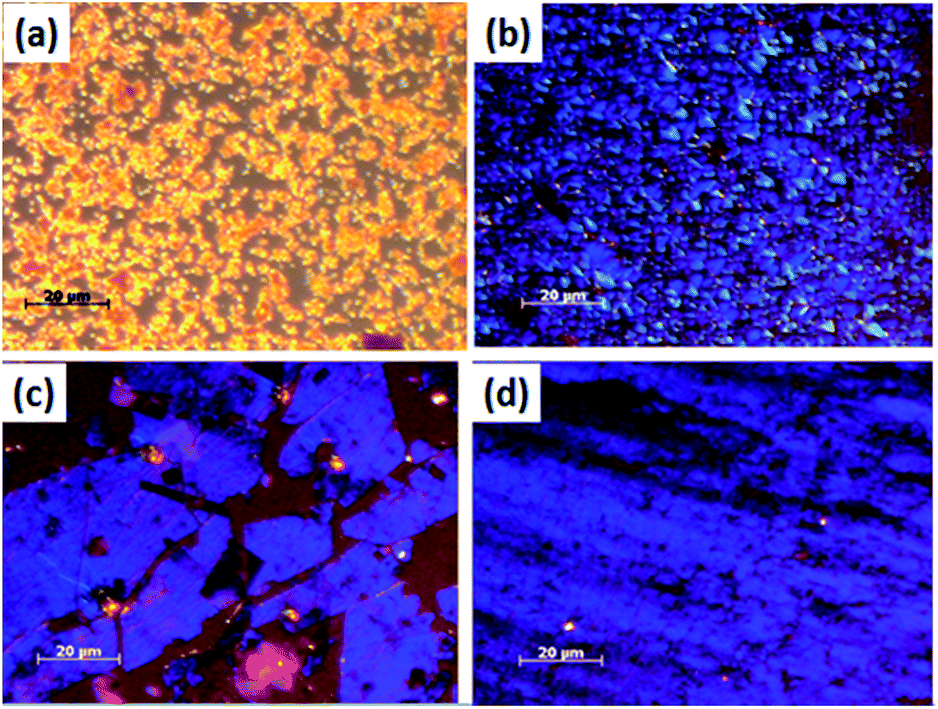
TPA–C60 tends to form tiny crystals in drop-cast thin films. To obtain crystals large enough for device fabrication and to introduce better crystal orientation, the PAC method31 was applied to produce a crystal array of TPA–C60. Fig. 1 shows TPA–C60 films obtained from different solvents. As shown in Fig. 1a and b, the crystal sizes were small when TPA–C60 was processed from m-xylene and CS2 solutions. However, the bright blue or yellow POM images suggested that TPA–C60 has birefringence and structural order in the cast films. Large crystalline TPA–C60 sheets were obtained from o-dichlorobenzene (ODCB) and 1,2,4-trichlorobenzene (TCB) solutions (Fig. 1c and d). Intriguingly, as shown in Fig. S6,† the color of the crystalline sheet was only observed when the incident light was polarized (Fig. S6c and d†) and the crystal does not turn dark even when its growth direction is along the polarization direction of the polarizer or the analyzer. A similar phenomenon was observed in the blue phases of highly chiral liquid crystals.36 The origin of the blue or yellow POM images of TPA–C60 falls outside the scope of the current study and will be investigated separately.
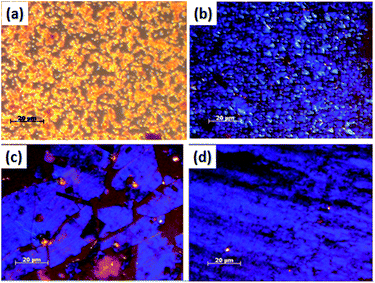 |
| | Fig. 1 POM images of TPA–C60 processed via the PAC method with different solvents. (a) m-Xylene, (b) CS2, (c) ODCB, and (d) TCB. | |
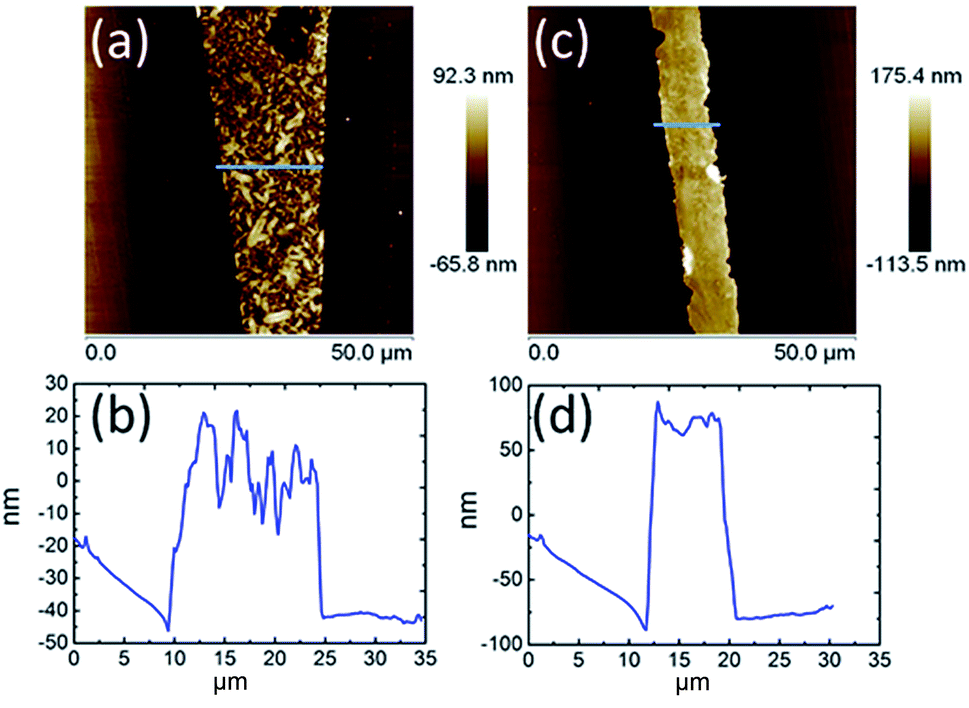
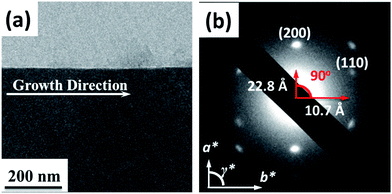
The AFM topography and cross-section profiles in Fig. 2 show that the TPA–C60 film prepared from ODCB solution is a polycrystalline thin film with a very rough surface (max. thickness ∼ 80 nm), but the one prepared from TCB solution has an insignificant crystalline boundary and a uniform surface (thickness ∼ 150 nm). The crystal array prepared from TCB was further examined with transmission electron microscopy (TEM) and electron diffraction (ED). Similar to the AFM result, the TPA–C60 crystal has a uniform appearance in the TEM image (Fig. 3a). The clear diffraction spots in the ED pattern (Fig. 3b) are evidence of the formation of an ordered solid-state structure, and more importantly, the well-oriented crystal lattices in the TPA–C60 crystal array formed by the PAC method. These morphological characterization methods thus confirmed that the pyramid-sphere-shaped amphiphile, TPA–C60, can assemble into an ordered phase, and a good lattice orientation can be induced via the PAC method.
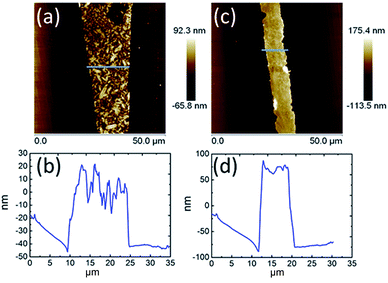 |
| | Fig. 2 AFM topography and cross-section profiles of TPA–C60 processed via the PAC method with ODCB (a) and (b) and TCB (c) and (d). | |
 |
| | Fig. 3 (a) TEM image and (b) the enlarged ED pattern of the TPA–C60 crystal array prepared via the PAC method using TCB as solvent. | |
2.4. Phase structure of TPA–C60
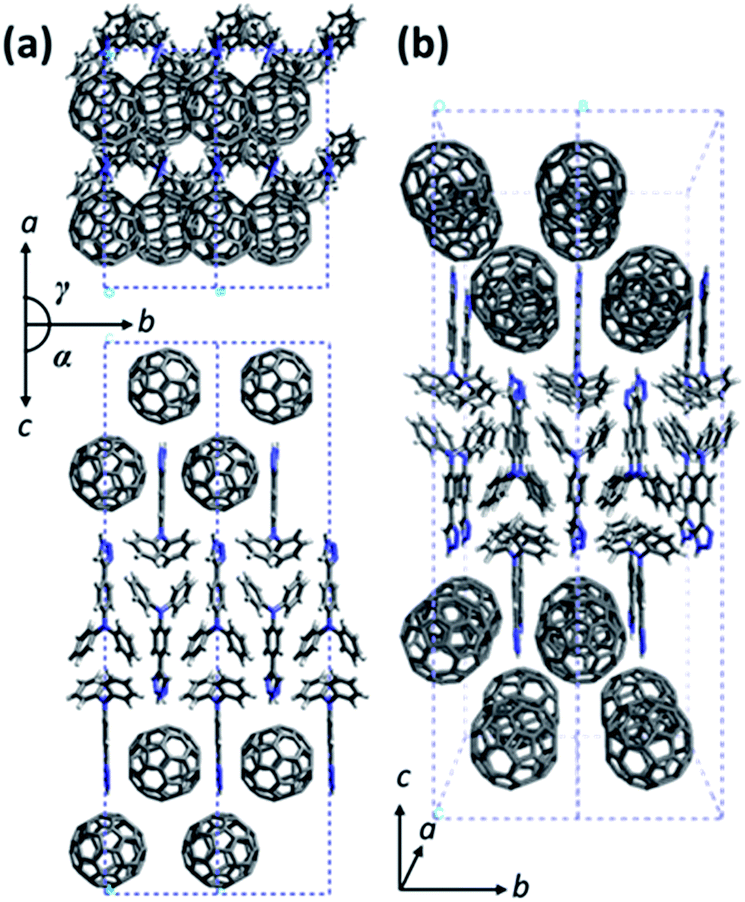
Due to the structural complexity, preparation of a large single crystal of TPA–C60 for single-crystal structural characterization was difficult. In addition, the ED patterns along different zone axes are still useful for revealing the 2D lattice projections of the TPA–C60 crystal. Using the drop-cast sample, a*b* and the b*c* reciprocal lattices (Fig. 4b and c) were observed. The lattice parameters deduced from Fig. 4b are a = 22.8 Å, b = 10.7 Å, γ = 90°; and from Fig. 4c are b = 10.7 Å, c = 51.0 Å, and α = 90°. The measured density of the TPA–C60 crystal is 1.28 g cm−3. Assuming that β = 90°, the density provides the information that the orthorhombic lattice (a = 22.8 Å, b = 10.7 Å, c = 51.0 Å, α = β = γ = 90°) contains 8 TPA–C60 molecules per unit cell. The powder X-ray diffraction (XRD) pattern of TPA–C60 is shown in Fig. S7.† The theoretical d-spacings of various lattice planes calculated from the abovementioned lattice parameters also match the measured ones (Table S1†). Furthermore, the (100) and (010) diffractions in Fig. 4b are significantly weaker than the (200) and (020) diffractions, suggesting that in the lattice, the electron density on the (100) planes is close to that on the (200) planes and that on the (010) planes is similar to that on the (020) planes. A lattice model was then built using the Cerius2 software package, based on the abovementioned information, and is shown in Fig. 5. The simulated ED patterns (Fig. S8†) generated from the [001] and [100] zones of the model resemble the experimental ones in Fig. 5, showing the validity of the model. The lattice of TPA–C60 features a dual-channel structure containing continuous but separated 2D n-type C60 sheets and p-type TPA sheets (Fig. 5b). It is noteworthy that the C60-to-C60 distance along the a axis (11.4 Å) is different from that along the b axis (10.7 Å). The ED pattern of the crystal array prepared by PAC (Fig. 4a) shares the zone axis, [001], with the pattern in Fig. 4b. Thus, it is confirmed that in the PAC method, the growth direction of the crystal array is along the b axis of the TPA–C60 lattice, and the 2D C60 and TPA sheets adopt a flat-on orientation of the substrate.
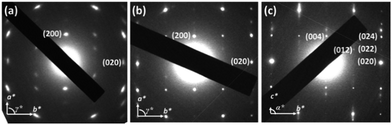 |
| | Fig. 4 ED patterns of TPA–C60 crystal prepared from (a) the PAC method, (b) and (c) by drop-casting. Projections of the a*b* and the b*c* reciprocal lattices can be observed in (b) and (c). | |
 |
| | Fig. 5 The lattice model of TPA–C60. (a) The ab and the bc lattice projections and (b) the projection view of the lattice. | |
2.5. Optical and electrochemical properties
The UV-Vis absorption spectrum and cyclic voltammogram (CV) of TPA–C60 are shown in Fig. S9 and S10.† For comparison, the absorption spectra and the CVs of [6,6]-phenyl-C61-butyric acid methyl ester (PCBM) and TPA-OH are also included in the figures. As shown in Fig. S6,† the absorption maximum of TPA–C60 is similar to that of PCBM. The slightly stronger absorption at 315 nm was attributed to the TPA moiety of TPA–C60. Fig. S10† shows three reversible reductions and one oxidation. The reduction potential, oxidation potential, and HOMO and LUMO energies of the three compounds are summarized in Table S2.† The HOMO and LUMO energies of TPA–C60 are close to the HOMO energy of TPA-OH and the LUMO energy of PCBM, suggesting that the C60 and TPA moieties of TPA–C60 retain their individual characteristics in the molecule.
2.6. OFET performance
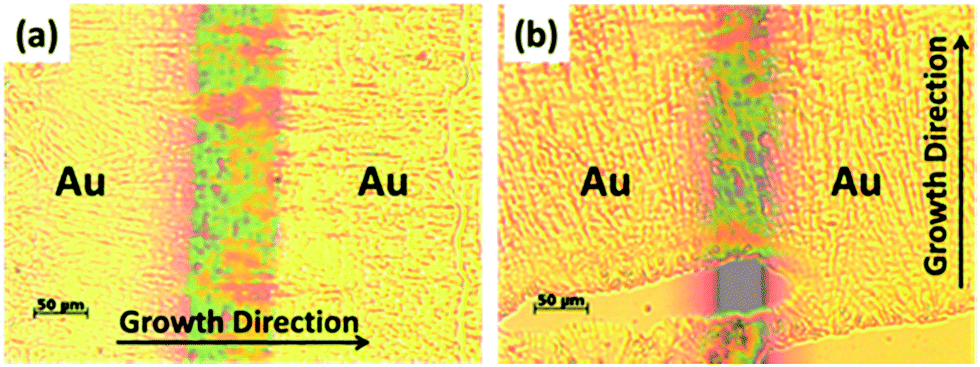
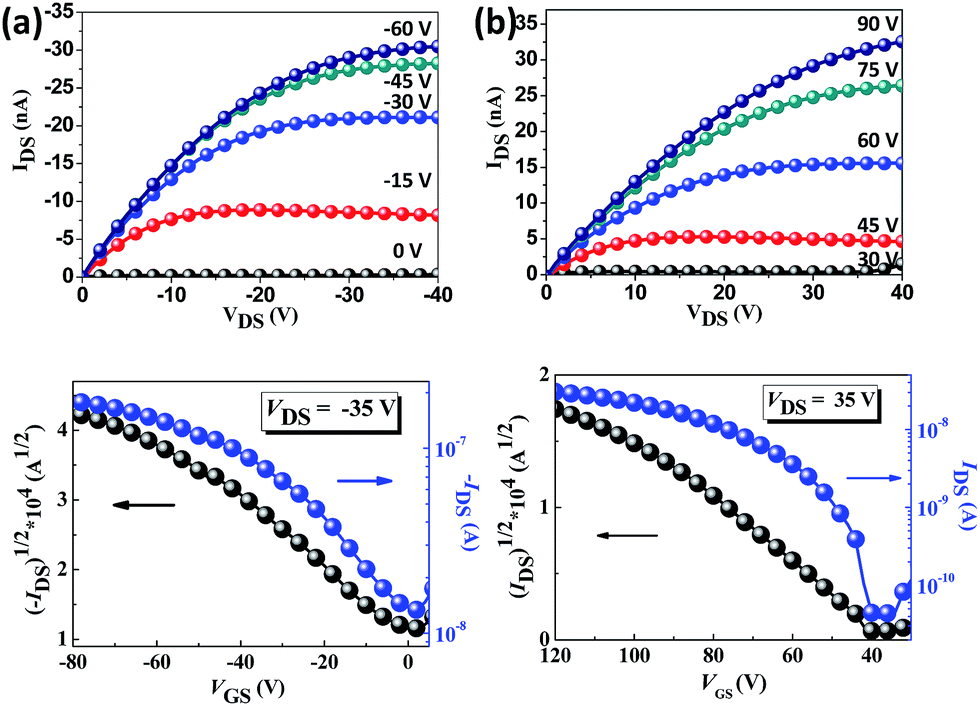
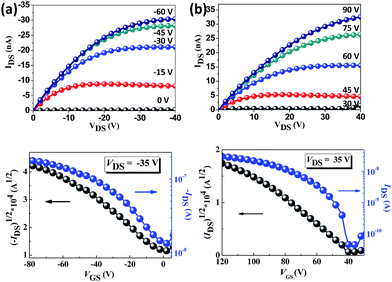
The charge transport properties of the oriented TPA–C60 crystal arrays prepared by the PAC method were investigated in OFET devices with a bottom-gate, top-contact configuration. Because the ED results confirmed that the b lattice axis of TPA–C60 is parallel to the crystal growth direction induced by PAC, as shown in Fig. 6, the source and drain electrodes were arranged parallel or perpendicular to the growth direction, so that the anisotropic charge-transport characteristics of the TPA–C60 crystal arrays along the a and b axes could be studied. The output and transfer plots of the best-performing device are shown in Fig. 7. The TPA–C60 crystal array demonstrated the p-channel characteristics under a negative gate-to-source voltage (VGS) (Fig. 7a) and the n-channel characteristics under a positive VGS (Fig. 7b). The hole mobilities (μhs) and electron mobilities (μes) deduced from the transfer plots of the devices in saturation regimes are summarized in Table 1. The averaged μhs values are 3.37 × 10⁻⁴ cm2 V−1 s−1 for the parallel devices and 5.43 × 10⁻⁵ cm2 V−1 s−1 for the perpendicular devices. In the database we have searched, the highest OFET μh of a TPA-star burst conjugated molecule was around 3 × 10⁻⁴ cm2 V−1 s−1.37 Thus, the 2D sheets of TPA in the TPA–C60 crystal array retained their hole-transporting ability and delivered one of the best μh values among the triarylamine-based molecules. On the other hand, the 2D sheets of the mono-adduct C60 delivered averaged μes values of 2.11 × 10⁻⁴ cm2 V−1 s−1 for the parallel devices and 3.54 × 10⁻⁵ cm2 V−1 s−1 for the perpendicular devices. Thus, the TPA–C60 crystal array has ambipolar charge transport characteristics and delivers balanced hole and electron charge mobilities. Moreover, the anisotropic charge-transport characteristics of the TPA–C60 crystal array are obvious, because the μh and μe values along the growth direction (b lattice axis) are about one order of magnitude higher than those perpendicular to the growth axis (a lattice axis). The difference can be attributed to shorter TPA–TPA and C60–C60 distances along the b axis, as shown in the ab lattice projection in Fig. 5a. The lower μe of the TPA–C60 crystal array compared to the best-performing C60 OFETs may be related to the longer C60–C60 distance and the lower coordination number of C60s in the TPA–C60 crystal lattice.31,38 In addition, the smeared ED pattern in Fig. 4a suggests a certain degree of orientational disorder in the crystal array, which is also detrimental to the μe.
 |
| | Fig. 6 OM images of the TPA–C60 OFET devices with the gold (Au) source and drain electrodes arranged (a) parallel and (b) perpendicular to the crystal growth direction. | |
 |
| | Fig. 7 The output (up) and transfer (down) characteristics of the TPA–C60 crystal arrays under (a) negative VGS and (b) positive VGS. | |
Table 1 OFET characteristics of the TPA–C60 crystal arraysa
|
|
μ
e average (cm2 V−1 s−1) |
I
on/Ioff |
V
th (V) |
μ
h average (cm2 V−1 s−1) |
I
on/Ioff |
V
th (V) |
|
The μs values of the parallel devices were averaged from 8 devices, and those of the perpendicular device were averaged from 6 devices.
|
| Parallel |
2.11 × 10⁻⁴ |
3 × 10⁴ |
32 |
3.37 × 10⁻⁴ |
6 × 10³ |
−22 |
| Perpendicular |
3.54 × 10⁻⁵ |
1 × 101 |
16 |
5.43 × 10⁻⁵ |
2 × 10³ |
−15 |
3. Conclusions
In summary, a synthetic route for a giant amphiphile (TPA–C60), which is constructed with an amorphous pyramid (TPA) and a crystalline sphere (C60), was developed. DSC results show that the pyramid-sphere-shaped amphiphile forms a solvent-induced ordered phase, because of the strong crystalline nature of the C60 moiety. Structural characterization confirmed that TPA–C60s self-assemble into separated 2D C60 and TPA sheets in the ordered phase. Processing by the PAC method produced oriented crystal arrays of TPA–C60. ED results indicate that the 2D C60 and TPA sheets adopt a flat-on orientation on the substrate with the b lattice axis pointing in the crystal growth direction. The flat-on n-type C60 nano-sheets and p-type TPA nano-sheets provide electron and hole-transporting channels. Ambipolar and balanced charge-transport characteristics were delivered by the TPA–C60 crystal arrays in OFET devices. The dual-channel supramolecular structure of TPA–C60 delivered an averaged μe of 2.11 × 10⁻⁴ cm2 V−1 s−1 and a μh of 3.37 × 10⁻⁴ cm2 V−1 s−1. The μh is comparable to the best-performing triarylamine-based p-type conjugated molecules, whereas the modest μe delivered by the C60 nano-sheets was attributed to the longer C60–C60 distance, the lower C60 coordination number in the TPA–C60 crystal lattice and the less orientational order of the TPA–C60 crystal array, compared to the pristine C60 crystals. Although a 2D crystal array of C60 has been recently disclosed,39 our study revealed the first example of a dual-channel self-organized structure and the ambipolar characteristics of a novel giant pyramid-sphere-shaped amphiphile.
4. Experimental section
4.1. General measurement and characterization
UV-Vis experiments were carried out using a HITACHI U-4100 spectrophotometer with a 10−3 M solution concentration in o-dichlorobenzene. The cyclic voltammetry (CV) data were analyzed with a CH Instruments Model 611D with a carbon glass serving as the working electrode and an Ag/Ag+ electrode as the reference electrode, with 0.1 M tetrabutylammonium hexafluorophosphate (Bu4NPF6) as the electrolyte and 10−2 M of the desired compound dissolved in o-dichlorobenzene. Thermogravimetric analysis (TGA) was conducted on a Perkin-Elmer Pyris under an inert atmosphere with a heating rate of 10 °C min−1 and differential scanning calorimetry (DSC) was performed on a TA Q200 Instrument at a temperature ramp rate of 5 °C min−1. For 1D XRD patterns, a Bruker APEX DUO single crystal diffractometer and an APEX II CCD camera equipped with a INCOATEC 18 kW rotating I microfocus X-ray generator (Cu Kα radiation (0.1542 nm)) were used. Transmission Electron Microscopy (TEM) observations were performed on a JEOL JEM-2010 transmission electron microscope with an accelerating voltage of 160 kV and a Gatan-831 CCD camera. Crystal simulation and drawing were based on a Cerius2 software product from Accelrys.
4.2. OFET fabrication
A n-type heavily doped Si wafer with a SiO2 layer of 300 nm and a capacitance of 11.5 nF cm−2 as the gate electrode and dielectric layer was ultrasonically cleaned sequentially in detergent, water and isopropyl alcohol. N-Octadecyltrichlorosilane (ODTS) was used as a self-assembled monolayer. The TPA–C60 crystal arrays were prepared via the PDMS-assisted crystallization (PAC) method.31 The gold source and drain electrodes (40 nm in thickness) were then deposited on the organic layer by vacuum evaporation through a shadow mask, affording a bottom-gate, top-contact device configuration. OFET measurement was carried out at room temperature under a nitrogen atmosphere using an Agilent Technologies 4156C instrument. The mobility calculation was based on the equation Ids = (W/2L)μCi(Vg − Vt)2 in the saturation regime, where Ids is the drain–source current, W is the channel width (1 mm), L is the channel length (100 μm), μ is the field-effect mobility, Ci is the capacitance per unit area of the dielectric layer, Vg is the gate voltage, and Vt is the threshold voltage.
4.3. Synthesis
All chemicals were purchased from Aldrich, Acros or TCI and used as received unless specified otherwise. 1H and 13C NMR spectra were obtained in deuterium-substituted chloroform, CDCl3, as the reference with 0.5 wt% TMS, using Varian 400 MHz spectrometers.
4.4. 8-(4-(Triphenylamino)-1H-1,2,3-triazol-1-yl)octan-1-ol (TPA-OH)
To a solution of 4-ethynyl-N,N-diphenylaniline 3 (0.5 g, 1.86 mmol), copper(II) sulfate pentahydrate (0.046 g, 0.184 mmol) and sodium ascorbate (0.11 g, 0.56 mmol) was added 8-azidooctan-1-ol 5 (0.382 g, 2.23 mmol) in THF/H2O 50 ml (1/1, v/v). The reaction mixture was stirred at room temperature for 3 hours then extracted with dichloromethane and water. The organic layer was collected and dried with MgSO4. After removal of the solvent under reduced pressure, the residue was purified by silica gel chromatography with ethyl acetate/hexane (1/3, v/v) as the eluent to give a beige solid (0.55 g, 67%). 1H NMR (400 MHz, CDCl3): δ 1.31–1.34 (m, 8H), 1.54 (t, 2H, J = 7 Hz), 1.93 (t, 2H, J = 7 Hz), 3.62 (t, 2H, J = 6.6 Hz), 4.37 (t, 2H, J = 7.2 Hz), 7.02 (t, 2H, J = 7.2 Hz), 7.12 (d, 6H), 7.24 (d, 2H), 7.26 (d, 2H), 7.66 (d, 2H), 7.69 (s, 1H). 13C NMR (CDCl3, 100 MHz): δ 25.6, 26.4, 28.9, 29.1, 30.3, 32.6, 50.3, 62.9, 118.8, 123.0, 123.8, 124.5, 124.7, 126.6, 129.3, 147.5, 147.7. MS (EI, C28H32N4O): calcd, 440.58; found, 440.5.
4.5. 8-(4-(Triphenylamino)-1H-1,2,3-triazol-1-yl)octyl acetate C60 (TPA–C60)
To a solution of C60-COOH (70 mg, 0.09 mmol), p-toluenesulfonic acid (17 mg, 0.09 mmol), 4-dimethylaminopyridine (11 mg, 0.09 mmol) and 1-(3-dimethylaminopropyl)-2-ethylcarbodiimide hydrochloride (17 mg 0.09 mmol) was added 8-(4-(triphenylamino)-1H-1,2,3-triazol-1-yl)octan-1-ol (60 mg, 13.6 mmol) in carbon disulfide (20 ml), the reaction mixture was stirred at room temperature for 12 hours. After removal of the solvent under reduced pressure, the residue was purified by neutral aluminum oxide chromatography with toluene to give a brown solid (79 mg, 74%). 1H NMR (400 MHz, CDCl3): δ 1.30–1.59 (m, 8H), 1.85 (t, 2H, J = 7.4 Hz), 1.95 (t, 2H, J = 7.4 Hz), 4.38 (t, 2H, J = 7.2 Hz), 4.45 (t, 2H, J = 6.6 Hz), 4.78 (s, 1H), 7.02 (t, 2H, J = 7.2 Hz), 7.10 (d, 6H), 7.24 (d, 2H), 7.26 (d, 2H), 7.67 (d, 2H), 7.69 (s, 1H). 13C NMR (CDCl3, 100 MHz): δ 25.9, 26.4, 28.6, 30.0, 30.4, 39.1, 50.3, 66.4, 70.6, 77.2, 118.8, 123.0, 123.8, 124.5, 124.8, 126.6, 129.3, 136.4, 140.4, 140.9, 141.1, 142.0, 142.1, 142.2, 142.4, 142.8, 143.0, 143.1, 143.2, 143.7, 143.9, 144.4, 144.6, 144.7, 145.0, 145.1, 145.2, 145.3, 145.6, 145.8, 147.5, 147.6, 147.7, 148.3, 166.4; MS (C90H32N4O2): calcd, 1201.24; found (FAB), 1200.9; found (MALDI-TOF), 1201.267.
Acknowledgements
This study is supported by the Ministry of Science and Technology, Taiwan (MOST 103-2221-E-009-213-MY3, MOST 104-2628-E-009-007-MY3) and the “ATP” of the National Chiao Tung University and Ministry of Education, Taiwan.
Notes and references
- W.-B. Zhang, X. Yu, C.-L. Wang, H.-J. Sun, I. F. Hsieh, Y. Li, X.-H. Dong, K. Yue, R. van Horn and S. Z. D. Cheng, Macromolecules, 2014, 47, 1221–1239 CrossRef CAS.
- S. C. Glotzer, Science, 2004, 306, 419–420 CrossRef CAS PubMed.
- F. A. Teng, Y. Cao, Y. J. Qi, M. Huang, Z. W. Han, S. Z. Cheng, W. B. Zhang and H. Li, Chem.–Asian J., 2013, 8, 1223–1231 CrossRef CAS PubMed.
- J. Baffreau, L. Ordronneau, S. Leroy-Lhez and P. Hudhomme, J. Org. Chem., 2008, 73, 6142–6147 CrossRef CAS PubMed.
- W.-S. Li, Y. Yamamoto, T. Fukushima, A. Saeki, S. Seki, S. Tagawa, H. Masunaga, S. Sasaki, M. Takata and T. Aida, J. Am. Chem. Soc., 2008, 130, 8886–8887 CrossRef CAS PubMed.
- C.-L. Wang, W.-B. Zhang, H.-J. Sun, R. M. van Horn, R. R. Kulkarni, C.-C. Tsai, C.-S. Hsu, B. Lotz, X. Gong and S. Z. D. Cheng, Adv. Energy Mater., 2012, 2, 1375–1382 CrossRef CAS.
- C.-L. Wang, W.-B. Zhang, X. Yu, K. Yue, H.-J. Sun, C.-H. Hsu, C.-S. Hsu, J. Joseph, D. A. Modarelli and S. Z. D. Cheng, Chem.–Asian J., 2013, 8, 947–955 CrossRef CAS PubMed.
- S. V. Kirner, D. M. Guldi, J. D. Megiatto Jr and D. I. Schuster, Nanoscale, 2015, 7, 1145–1160 RSC.
- D. I. Schuster, P. D. Jarowski, A. N. Kirschner and S. R. Wilson, J. Mater. Chem., 2002, 12, 2041–2047 RSC.
- H. Imahori, Org. Biomol. Chem., 2004, 2, 1425–1433 CAS.
- R. Chitta and F. D'Souza, J. Mater. Chem., 2008, 18, 1440–1471 RSC.
- S. V. Kirner, D. Arteaga, C. Henkel, J. T. Margraf, N. Alegret, K. Ohkubo, B. Insuasty, A. Ortiz, N. Martín and L. Echegoyen, Chem. Sci., 2015, 6, 5994–6007 RSC.
- H. Hayashi, W. Nihashi, T. Umeyama, Y. Matano, S. Seki, Y. Shimizu and H. Imahori, J. Am. Chem. Soc., 2011, 133, 10736–10739 CrossRef CAS PubMed.
- H. Imahori, T. Umeyama, K. Kurotobi and Y. Takano, Chem. Commun., 2012, 48, 4032–4045 RSC.
- F. Wessendorf, B. Grimm, D. M. Guldi and A. Hirsch, J. Am. Chem. Soc., 2010, 132, 10786–10795 CrossRef CAS PubMed.
- G. Liu, A. N. Khlobystov, G. Charalambidis, A. G. Coutsolelos, G. A. Briggs and K. Porfyrakis, J. Am. Chem. Soc., 2012, 134, 1938–1941 CrossRef CAS PubMed.
- D. I. Schuster, K. Li, D. M. Guldi, A. Palkar, L. Echegoyen, C. Stanisky, R. J. Cross, M. Niemi, N. V. Tkachenko and H. Lemmetyinen, J. Am. Chem. Soc., 2007, 129, 15973–15982 CrossRef CAS PubMed.
- P. A. Liddell, G. Kodis, A. L. Moore, T. A. Moore and D. Gust, J. Am. Chem. Soc., 2002, 124, 7668–7669 CrossRef CAS PubMed.
- M. Wolffs, F. J. Hoeben, E. H. Beckers, A. P. Schenning and E. Meijer, J. Am. Chem. Soc., 2005, 127, 13484–13485 CrossRef CAS PubMed.
- R. W. Date and D. W. Bruce, J. Am. Chem. Soc., 2003, 125, 9012–9013 CrossRef CAS PubMed.
- G. Bottari, G. de la Torre, D. M. Guldi and T. S. Torres, Chem. Rev., 2010, 110, 6768–6816 CrossRef CAS PubMed.
- L. Cui, J. P. Collet, G. Xu and L. Zhu, Chem. Mater., 2006, 18, 3503–3512 CrossRef CAS.
- H. Araki and K. Naka, J. Polym. Sci., Part A: Polym. Chem., 2012, 50, 4170–4181 CrossRef CAS.
- R. Charvet, Y. Yamamoto, T. Sasaki, J. Kim, K. Kato, M. Takata, A. Saeki, S. Seki and T. Aida, J. Am. Chem. Soc., 2012, 134, 2524–2527 CrossRef CAS PubMed.
- H. Imahori, D. M. Guldi, K. Tamaki, Y. Yoshida, C. Luo, Y. Sakata and S. Fukuzumi, J. Am. Chem. Soc., 2001, 123, 6617–6628 CrossRef CAS PubMed.
- P. F. Damasceno, M. Engel and S. C. Glotzer, Science, 2012, 337, 453–457 CrossRef CAS PubMed.
- D. F. O'Brien, P. E. Burrows, S. R. Forrest, B. E. Koene, D. E. Loy and M. E. Thompson, Adv. Mater., 1998, 10, 1108–1112 CrossRef.
- P. Strohriegl and J. V. Grazulevicius, Adv. Mater., 2002, 14, 1439–1452 CrossRef CAS.
- C.-Y. Chang, L. Zuo, H.-L. Yip, Y. Li, C.-Z. Li, C.-S. Hsu, Y.-J. Cheng, H. Chen and A. K. Y. Jen, Adv. Funct. Mater., 2013, 23, 5084–5090 CrossRef CAS.
- M. M. Lee, J. Teuscher, T. Miyasaka, T. N. Murakami and H. J. Snaith, Science, 2012, 338, 643–647 CrossRef CAS PubMed.
- K.-Y. Wu, T.-Y. Wu, S.-T. Chang, C.-S. Hsu and C.-L. Wang, Adv. Mater., 2015, 27, 4371–4376 CrossRef CAS PubMed.
- L. Y. Chiang, P. A. Padmawar, T. Canteenwala, L.-S. Tan, G. S. He, R. Kannan, R. Vaia, T.-C. Lin, Q. Zheng and P. N. Prasad, Chem. Commun., 2002, 1854–1855 RSC.
- D. Konarev, A. Y. Kovalevsky, A. Litvinov, N. Drichko, B. Tarasov, P. Coppens and R. Lyubovskaya, J. Solid State Chem., 2002, 168, 474–485 CrossRef CAS.
- S. Clavaguera, S. I. Khan and Y. Rubin, Org. Lett., 2009, 11, 1389–1391 CrossRef CAS PubMed.
- B. Ma, C. E. Bunker, R. Guduru, X.-F. Zhang and Y.-P. Sun, J. Phys. Chem. A, 1997, 101, 5626–5632 CrossRef CAS.
-
H.-S. Kitzerow and C. Bahr, Chirality in Liquid Crystals, Springer-Verlag, New York, 2001, ch. 7, p. 186 Search PubMed.
- M. Sonntag, K. Kreger, D. Hanft, P. Strohriegl, S. Setayesh and D. de Leeuw, Chem. Mater., 2005, 17, 3031–3039 CrossRef CAS.
- H. Li, B. C. Tee, J. J. Cha, Y. Cui, J. W. Chung, S. Y. Lee and Z. Bao, J. Am. Chem. Soc., 2012, 134, 2760–2765 CrossRef CAS PubMed.
- X. Zhang, C. H. Hsu, X. Ren, Y. Gu, B. Song, H. J. Sun, S. Yang, E. Chen, Y. Tu, X. Li, X. Yang, Y. Li and X. Zhu, Angew. Chem., Int. Ed., 2015, 54, 114–117 CrossRef CAS PubMed.
Footnotes |
| † Electronic supplementary information (ESI) available: 1H and 13C NMR spectra, TGA, DSC, XRD, simulated ED patterns, UV-Vis spectra, reduction and oxidation cyclic voltammetry curves. See DOI: 10.1039/c5sc04242a |
| ‡ Wei-Wei Liang and Chi-Feng Huang are joint first authors. |
|
| This journal is © The Royal Society of Chemistry 2016 |
Click here to see how this site uses Cookies. View our privacy policy here. 
 Open Access Article
 This Open Access Article is licensed under a