 Open Access Article
Rapid oxidative hydrogen evolution from a family of square-planar nickel hydride complexes†
Srinivasan
Ramakrishnan‡
 a,
Sumit
Chakraborty‡
 b,
William W.
Brennessel
b,
Christopher E. D.
Chidsey
*a and
William D.
Jones
b,
William W.
Brennessel
b,
Christopher E. D.
Chidsey
*a and
William D.
Jones
 *b
*b
aDepartment of Chemistry, Stanford University, Stanford, California 94305, USA. E-mail: chidsey@stanford.edu
bDepartment of Chemistry, University of Rochester, Rochester, New York 14627, USA. E-mail: jones@chem.Rochester.edu
First published on 29th October 2015
Abstract
A series of square-planar nickel hydride complexes supported by bis(phosphinite) pincer ligands with varying substituents (–OMe, –Me, and –But) on the pincer backbone have been synthesized and completely characterized by NMR spectroscopy, IR spectroscopy, elemental analysis, and X-ray crystallography. Their cyclic voltammograms show irreversible oxidation peaks (peak potentials from 101 to 316 mV vs. Fc+/Fc) with peak currents consistent with overall one-electron oxidations. Chemical oxidation by the one-electron oxidant Ce(NBu4)2(NO3)6 was studied by NMR spectroscopy, which provided quantitative evidence for post-oxidative H2 evolution leading to a solvent-coordinated nickel(II) species with the pincer backbone intact. Bulk electrolysis of the unsubstituted nickel hydride (3a) showed an overall one-electron stoichiometry and gas chromatographic analysis of the headspace gas after electrolysis further confirmed stoichiometric production of dihydrogen. Due to the extremely high rate of the post-oxidative chemical process, electrochemical simulations have been used to establish a lower limit of the bimolecular rate constant (kf > 107 M−1 s−1) for the H2 evolution step. To the best of our knowledge, this is the fastest known oxidative H2 evolution process observed in transition metal hydrides. Quantum chemical calculations based on DFT indicate that the one-electron oxidation of the nickel hydride complex provides a strong chemical driving force (−90.3 kcal mol−1) for the production of H2 at highly oxidizing potentials.
Introduction
Virtual H2 carriers such as alcohols and saturated N-heterocycles that are liquids at room temperature constitute important alternatives to the use of H2 in commercial fuel cells.1–3 They are easy to store compared to gaseous dihydrogen and in principle, could be part of a reversible fuel cell with the dehydrogenated products also being liquids at room temperature. Developing catalysts containing earth-abundant elements to dehydrogenate these fuels to produce protons and electrons ergoneutrally, is therefore relevant for fuel cell applications.4–6Scheme 1 shows a conceptual pathway for the dehydrogenation of organic fuels involving homogenous molecular catalysts.4 Dehydrogenation of the fuel in the presence of a base typically leads to transition metal hydride intermediates, ubiquitous in transfer hydrogenation processes,7–9 which shuttle H2 equivalents from a sacrificial donor (for example, an alcohol) to an acceptor molecule such as a ketone. Subsequent electro-oxidation and deprotonation of the metal hydride, a two-electron one-proton process, results in a solvent-coordinated species, as shown in Scheme 1. To design an energy-efficient electrocatalytic cycle for this transformation, it is important that both of the steps shown in Scheme 1 are close to ergoneutrality. In this work, we focused on the latter step, i.e. the electrochemical oxidation of a series of metal hydride complexes.
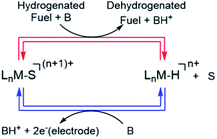 | ||
| Scheme 1 Electrocatalytic cycle for electro-dehydrogenation of H-containing liquid fuels (Ln = ligand, S = coordinating solvent, M = transition metal, n = integer, B = base). | ||
The electro-oxidation of metal hydrides has been a subject of interest due to its predominantly irreversible nature which often suggests a subsequent fast chemical step leading to undesired products.10–13 Tilset and coworkers have reported that electron removal from the metal center in group VI hydrides enhances the acidity of the hydride by approximately 20 pKa units leading to deprotonation, forming a reduced metal species that would spontaneously lose another electron at the operating potential, thereby constituting an overall two electron process.10,14 Depending on the pKa of the oxidized hydride, a suitable base can act as the proton acceptor and a solvent molecule such as acetonitrile as a ligand that stabilizes the coordinatively unsaturated metal species resulting from proton loss, as shown in eqn (1) for a generic neutral hydride complex.10,14,15
 | (1) |
In the absence of a suitable base the stoichiometry of the electrochemical oxidation of the metal hydride has been found to be an overall one-electron process in a few systems rather than the two-electron process discussed above.10,13 One of the observed outcomes of this one-electron process has been H2 evolution13,16,17 with a net oxidation of one electron per metal hydride, as shown in eqn (2).
 | (2) |
One mechanism of H2 evolution has been suggested by Collman et al.13 in the case of a porphyrin-based Ru-hydride system. They hypothesize that two molecules of the oxidized Ru-hydride converge in an associative fashion to form a bridging [Ru(III)–H⋯H–Ru(III)] complex which subsequently loses H2 by solvent coordination to yield two equivalents of the Ru(II)-solvento species, the overall transformation shown in eqn (2). The other mechanism that has been evoked10 is deprotonation–oxidation, wherein a neutral metal hydride accepts a proton from the cation radical to make an H2 complex. A solvent molecule then displaces H2 from the latter, and the Ru(I) species loses an electron to the electrode and coordinates a solvent, leading to the same overall stoichiometry shown in eqn (2).
In this work, we have studied the oxidation of a new family of d8 square-planar nickel hydride complexes supported by bis(phosphinite) pincer ligands (POCOP ligands).18–21 This work expands the understanding of metal hydride oxidation. These nickel pincer complexes were synthesized and completely characterized by 1H, 31P, 13C NMR spectroscopy, solid-state IR spectroscopy, elemental analysis, and X-ray crystallography. One-electron oxidation of all these complexes was found to be irreversible, and the nature of the post-oxidative chemical transformations leading to facile H2 evolution were explored by a combination of chemical and electrochemical studies, density functional theory (DFT) based calculations and electrochemical simulations. The bimolecular rate constant for H2 evolution was found to be at least 107 M−1 s−1 which is, to the best of our knowledge, the fastest known oxidative H2 evolution reaction observed in transition metal hydride complexes.13,22 This reactivity highlights the challenges of developing earth-abundant metal hydride complexes as catalytic intermediates in the ergoneutral oxidation of liquid fuels.
Results and discussion
Synthesis and characterization of nickel pincer complexes
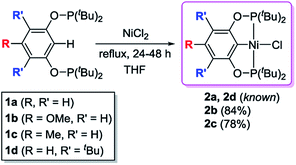
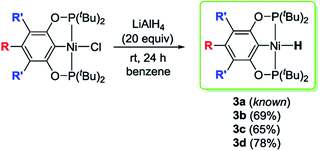
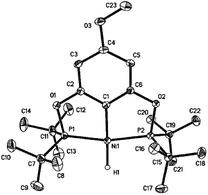
The desired nickel pincer hydrides 3a–d were successfully synthesized in three consecutive steps following a procedure similar to the one reported by Guan et al.23 Related bis(phosphinite) pincer ligands (1a–d, POCOP ligands) were prepared by Brookhart's method involving the treatment of substituted resorcinol derivatives with two equivalents of P(tBu)2Cl in the presence of NaH.24,25 These ligands require handling under inert atmosphere to avoid hydrolysis, which takes place in ambient atmosphere.26 Nickel pincer chlorides 2a and 2d were prepared through cyclometalation of 1a and 1d with anhydrous NiCl2.23,25 Nickel chlorides 2b and 2c were synthesized similarly (78–84% isolated yields) and characterized by 1H, 31P{1H}, 13C{1H} NMR spectroscopy, and elemental analysis (Scheme 2). Solid-state structures of 2b and 2c were also determined by X-ray crystallography (see ESI†). Both of the complexes adopt a square planar geometry around the Ni(II) center, a typical structure for this type of pincer complexes reported by Zargarian26 and Guan.23 Alternatively, 2a–d could also be formed by refluxing a mixture of a resorcinol derivative, P(tBu)2Cl, dimethylaminopyridine (DMAP), NiCl2, and 1,4-dioxane (solvent) in a single reaction vessel for several days (Scheme 3). Although this method avoids the separation of the air-sensitive POCOP ligands, the corresponding isolated yields of 2a–d were much lower (19–37%).Reactions of 2a–d with excess LiAlH4 (20 equivalents) at room temperature generated the desired nickel pincer hydride complexes 3a–d as light yellow solids in good isolated yields (65–78%, Scheme 4). Complexes 3b–d are not reported in the literature and therefore were completely characterized by 1H, 31P{1H}, 13C{1H} NMR spectroscopy, IR spectroscopy, and elemental analysis. The 1H NMR spectra of 3b–d recorded in C6D6 revealed the characteristic Ni–H resonances as triplets at δ −8.06 (2JH–P = 52 Hz), −7.98 ppm (2JH–P = 52 Hz), and −7.90 (2JH–P = 52 Hz), respectively. The singlet resonance observed in the 31P{1H} NMR spectra of all of the nickel hydride species is consistent with a C2-symmetric structure. Solid-state IR spectroscopy showed distinct, moderately strong Ni–H stretching bands near 1791 cm−1 (for 3b), 1768 cm−1 (for 3c), and 1810 cm−1 (for 3d). Compounds 3b–d have been further characterized by X-ray crystallography (Fig. 1, see ESI†). The hydride ligands in all of these nickel hydride complexes were located and refined. Crystal data and refinement parameters for the nickel hydride complexes are given in Table 1.
| 3b | 3c | 3d | |
|---|---|---|---|
| Empirical formula | C23H42O3P2Ni | C23H42O2P2Ni | C30H56O2P2Ni |
| Crystal system | Monoclinic | Monoclinic | Monoclinic |
| Space group | P21/n | P21/n | P21/n |
| a, E | 9.756(3) | 9.528(3) | 15.131(3) |
| b, E | 19.408(6) | 20.201(7) | 12.589(2) |
| c, E | 14.026(4) | 13.4341(5) | 17.529(3) |
| α, deg | 90 | 90 | 90 |
| β, deg | 104.528(6) | 100.908(7) | 106.717(4) |
| γ, deg | 90 | 90 | 90 |
| Volume, E3 | 2570.9(14) | 2539.1(16) | 3197.8(11) |
| Z | 4 | 4 | 4 |
| No. of data collected | 64![[thin space (1/6-em)]](https://www.rsc.org/images/entities/char_2009.gif) 153 153 |
80![[thin space (1/6-em)]](https://www.rsc.org/images/entities/char_2009.gif) 520 520 |
66![[thin space (1/6-em)]](https://www.rsc.org/images/entities/char_2009.gif) 747 747 |
| No. of unique data, Rint | 14![[thin space (1/6-em)]](https://www.rsc.org/images/entities/char_2009.gif) 241, 0.0784 241, 0.0784 |
13![[thin space (1/6-em)]](https://www.rsc.org/images/entities/char_2009.gif) 995, 0.0707 995, 0.0707 |
14![[thin space (1/6-em)]](https://www.rsc.org/images/entities/char_2009.gif) 087, 0.0980 087, 0.0980 |
| R 1, wR2 (I > 2σ(I)) | 0.0493, 0.0990 | 0.0571, 0.1174 | 0.0527, 0.1088 |
| R 1, wR2 (all data) | 0.0949, 0.1152 | 0.0868, 0.1264 | 0.0988, 0.1271 |
Synthesis of the nickel pincer acetonitrile complex
The related nickel pincer acetonitrile complex (4a) was independently synthesized from two different routes (Scheme 5). In one of the methods, the chloride ligand in 2a was abstracted by an Ag(I) salt in acetonitrile to form the desired complex 4a. Tetrafluoroborate (BF4−), remains as a counter-anion. In the second method, the corresponding nickel hydride complex 3a was protonated by HBF4·Et2O to afford complex 4a. In this reaction, H2 is released as the only other byproduct. Complex 4a has been characterized by 1H, 31P{1H}, 13C{1H} NMR spectroscopy, IR spectroscopy, and elemental analysis. In the 1H NMR spectrum, the resonance corresponding to the Ni–NCCH3 appeared at δ 2.63 as a broad triplet. A strong C![[triple bond, length as m-dash]](https://www.rsc.org/images/entities/char_e002.gif) N stretch for the acetonitrile moiety present in complex 4a was observed at 2290 cm−1 in the IR spectrum. A similar nickel acetonitrile complex was reported by Crabtree and Hazari during their investigation related to the electrocatalytic production of hydrogen.27
N stretch for the acetonitrile moiety present in complex 4a was observed at 2290 cm−1 in the IR spectrum. A similar nickel acetonitrile complex was reported by Crabtree and Hazari during their investigation related to the electrocatalytic production of hydrogen.27
Electrochemistry of the nickel hydride complexes
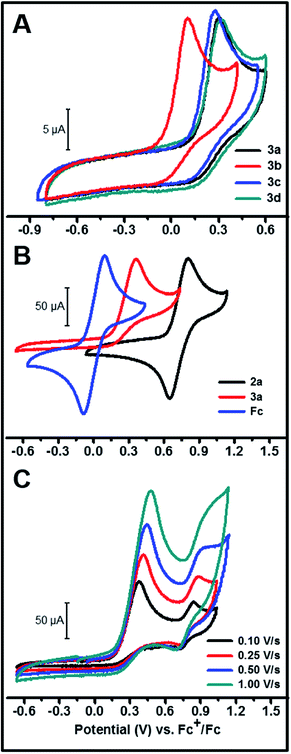
The cyclic voltammograms of the hydride complexes 3a–d are shown in Fig. 2A. A mixture of THF–MeCN 1![[thin space (1/6-em)]](https://www.rsc.org/images/entities/char_2009.gif) :
:![[thin space (1/6-em)]](https://www.rsc.org/images/entities/char_2009.gif) 4 by volume respectively, was employed as the solvent mixture for all electrochemistry experiments as 3a–d are only partially soluble in MeCN. All of these complexes show an irreversible oxidation peak, assigned to a metal-centered oxidation, at slightly different peak potentials depending on the substituent on the aromatic ring (peak potentials ranging from 101 to 316 mV vs. Fc+/Fc). The complete irreversibility in the CV of these hydride complexes suggests a fast chemical step involving a hydride, proton or H-atom transfer following initial electron transfer from the molecule to the electrode.28 The peak areas in these CVs are comparable to the peak area observed in an equimolar solution of ferrocene or the corresponding chloride complex 2a (Fig. 2B and S4†) under similar conditions. This provides evidence that the peak is due to a one-electron oxidation and argues against the deprotonation pathway in eqn (1), which would result in a two-electron oxidation.
4 by volume respectively, was employed as the solvent mixture for all electrochemistry experiments as 3a–d are only partially soluble in MeCN. All of these complexes show an irreversible oxidation peak, assigned to a metal-centered oxidation, at slightly different peak potentials depending on the substituent on the aromatic ring (peak potentials ranging from 101 to 316 mV vs. Fc+/Fc). The complete irreversibility in the CV of these hydride complexes suggests a fast chemical step involving a hydride, proton or H-atom transfer following initial electron transfer from the molecule to the electrode.28 The peak areas in these CVs are comparable to the peak area observed in an equimolar solution of ferrocene or the corresponding chloride complex 2a (Fig. 2B and S4†) under similar conditions. This provides evidence that the peak is due to a one-electron oxidation and argues against the deprotonation pathway in eqn (1), which would result in a two-electron oxidation.
On scanning further positive from the peak potential of the initial Ni(III)H/Ni(II)H oxidation in the CV, another wave was observed ca. 0.5 V positive of the initial wave (Fig. 2C). This second partially reversible wave probably corresponds to the Ni(III/II) couple of a new species generated during the first oxidation, with a ligand being less donating compared to the hydride ligand in 3a, as evidenced by the more positive E1/2 of this couple. The magnitude of this second oxidation peak relative to the first decreases with decreasing scan rate suggesting that this second Ni(II) species is partially converting to another species on the seconds time scale.
To probe the nature of the products formed upon oxidation, a one-electron chemical oxidant, Ce(NBu4)2(NO3)6,29 was added in 1/3 equivalent increments to 3a dissolved in a 50![[thin space (1/6-em)]](https://www.rsc.org/images/entities/char_2009.gif) :
:![[thin space (1/6-em)]](https://www.rsc.org/images/entities/char_2009.gif) 50 mixture of CD3CN and C6D6 in a J. Young NMR tube and the resultant changes monitored by 1H and 31P{1H} NMR spectroscopy (Fig. 3). The triplet centered at δ −8.39 (J = 52 Hz) corresponds to the hydride resonance in 3a. With incremental addition of the Ce(IV) oxidant to 3a, we observed a gradual disappearance of the hydride resonance of 3a from the 1H NMR spectrum. In the 31P{1H} NMR spectrum, the intensity of the peak at δ 221.42 ppm corresponding to 3a also decreased with the addition of the chemical oxidant. After the addition of 1 equivalent of the Ce(IV) salt, the resonance for 3a was completely replaced with the new resonance at δ 199.57 ppm corresponding to the nickel-solvento species 4a (Fig. 3). After the initial addition of the Ce(IV) salt, bubbles appeared in the NMR tube as well as a singlet peak in the 1H NMR spectrum (δ 4.42 ppm, Fig. 3 inset) corresponding to H2 production.30 To quantify the amount of H2 produced, 3a was taken in two NMR tubes (5 mg each, 0.011 mmol) each sealed with a septum and dissolved in 0.2 mL d8-THF. Sub-stoichiometric amounts of 2,6-dimethylbenzoic acid and Ce(NBu4)2(NO3)6, each in 0.8 mL of CD3CN were added to the first and second NMR tubes respectively. The integration of the H2 peak in the 1H NMR spectrum (δ 4.55 ppm in this solvent mixture) was quantified using acid addition to the second test tube as a calibrant (Fig. S1†). To be noted is the fact that the calibration sample contains twice the amount of H2 per Ni–H as we are using an acid as the proton source. By this method, H2 production on one electron oxidation by Ce(IV) amounted to 95%, which corresponds to the stoichiometry in eqn (2). These observations provide strong evidence for the oxidative H2 evolution pathway (eqn (2)).
50 mixture of CD3CN and C6D6 in a J. Young NMR tube and the resultant changes monitored by 1H and 31P{1H} NMR spectroscopy (Fig. 3). The triplet centered at δ −8.39 (J = 52 Hz) corresponds to the hydride resonance in 3a. With incremental addition of the Ce(IV) oxidant to 3a, we observed a gradual disappearance of the hydride resonance of 3a from the 1H NMR spectrum. In the 31P{1H} NMR spectrum, the intensity of the peak at δ 221.42 ppm corresponding to 3a also decreased with the addition of the chemical oxidant. After the addition of 1 equivalent of the Ce(IV) salt, the resonance for 3a was completely replaced with the new resonance at δ 199.57 ppm corresponding to the nickel-solvento species 4a (Fig. 3). After the initial addition of the Ce(IV) salt, bubbles appeared in the NMR tube as well as a singlet peak in the 1H NMR spectrum (δ 4.42 ppm, Fig. 3 inset) corresponding to H2 production.30 To quantify the amount of H2 produced, 3a was taken in two NMR tubes (5 mg each, 0.011 mmol) each sealed with a septum and dissolved in 0.2 mL d8-THF. Sub-stoichiometric amounts of 2,6-dimethylbenzoic acid and Ce(NBu4)2(NO3)6, each in 0.8 mL of CD3CN were added to the first and second NMR tubes respectively. The integration of the H2 peak in the 1H NMR spectrum (δ 4.55 ppm in this solvent mixture) was quantified using acid addition to the second test tube as a calibrant (Fig. S1†). To be noted is the fact that the calibration sample contains twice the amount of H2 per Ni–H as we are using an acid as the proton source. By this method, H2 production on one electron oxidation by Ce(IV) amounted to 95%, which corresponds to the stoichiometry in eqn (2). These observations provide strong evidence for the oxidative H2 evolution pathway (eqn (2)).
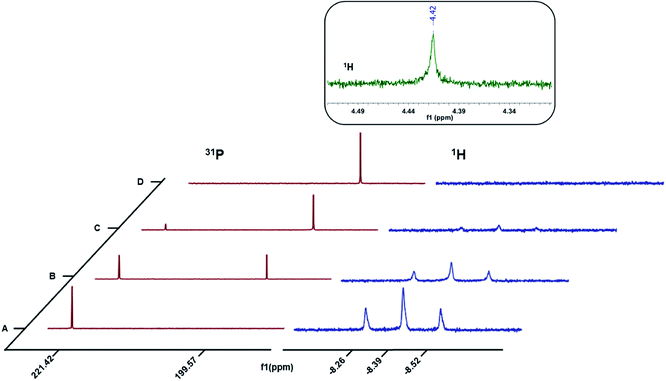 | ||
| Fig. 3 1H and 31P{1H} NMR spectra for the oxidation of 3a with ca. (A) 0 equiv. (B) 0.33 equiv. (C) 0.66 equiv. and (D) 1 equiv. Ce(NBu4)2(NO3)6. | ||
To further quantify the electron stoichiometry and the amount of dihydrogen produced, we performed a constant potential electrolysis of 3 mL of a 1.23 mM solution of 3a in THF![[thin space (1/6-em)]](https://www.rsc.org/images/entities/char_2009.gif) :
:![[thin space (1/6-em)]](https://www.rsc.org/images/entities/char_2009.gif) MeCN (1
MeCN (1![[thin space (1/6-em)]](https://www.rsc.org/images/entities/char_2009.gif) :
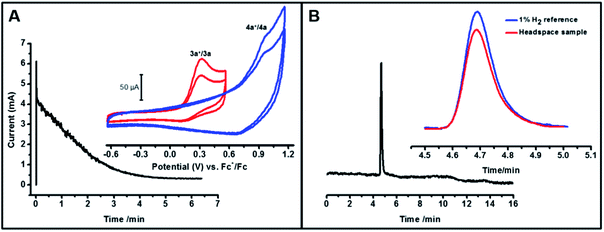
:![[thin space (1/6-em)]](https://www.rsc.org/images/entities/char_2009.gif) 4 by volume), maintaining a potential ca. 200 mV positive of the Ni(III)H/Ni(II)H peak potential. For this amount of 3a and a net one-electron oxidation, the total charge to be passed for 100% faradaic efficiency would be 356 mC. Integrating the current versus time plot for the electrolysis (Fig. 4A) gave 354 mC, confirming a net one-electron stoichiometry with respect to 3a for the oxidation. After the electrolysis was complete, a 3 mL aliquot of the headspace above the solution was analyzed by gas chromatography. The results shown in Fig. 4B clearly indicate hydrogen production based on the retention time of a standard 1% H2 gas sample. Comparison of the areas of the sample versus the reference gave an H2 partial pressure of at least 0.007 atm in the 4.5 mL of headspace which corresponds to 1.3 × 10⁻³ mmol H2 and a yield of at least 70% based on eqn (2). The yield is a lower bound given the solubility of H2 in the solvent mixture as well as possible crossover between the two chambers of the H-cell through diffusion. The new peak in the post-electrolysis cyclic voltammogram shown in Fig. 4A inset (blue) is tentatively assigned to the Ni-solvento species (4a) formed during the electrolysis (Fig. S7†).
4 by volume), maintaining a potential ca. 200 mV positive of the Ni(III)H/Ni(II)H peak potential. For this amount of 3a and a net one-electron oxidation, the total charge to be passed for 100% faradaic efficiency would be 356 mC. Integrating the current versus time plot for the electrolysis (Fig. 4A) gave 354 mC, confirming a net one-electron stoichiometry with respect to 3a for the oxidation. After the electrolysis was complete, a 3 mL aliquot of the headspace above the solution was analyzed by gas chromatography. The results shown in Fig. 4B clearly indicate hydrogen production based on the retention time of a standard 1% H2 gas sample. Comparison of the areas of the sample versus the reference gave an H2 partial pressure of at least 0.007 atm in the 4.5 mL of headspace which corresponds to 1.3 × 10⁻³ mmol H2 and a yield of at least 70% based on eqn (2). The yield is a lower bound given the solubility of H2 in the solvent mixture as well as possible crossover between the two chambers of the H-cell through diffusion. The new peak in the post-electrolysis cyclic voltammogram shown in Fig. 4A inset (blue) is tentatively assigned to the Ni-solvento species (4a) formed during the electrolysis (Fig. S7†).
Mechanistic insights from DFT-based calculations
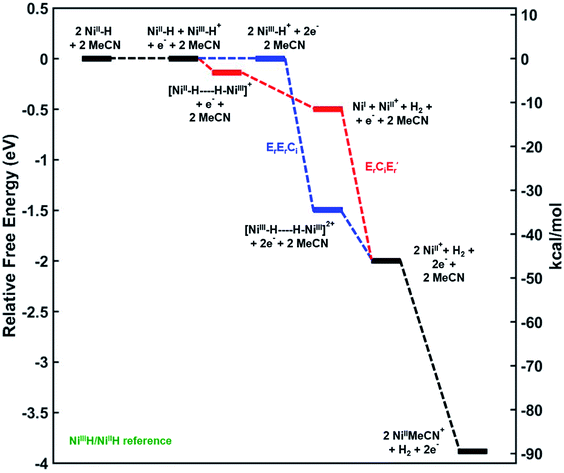
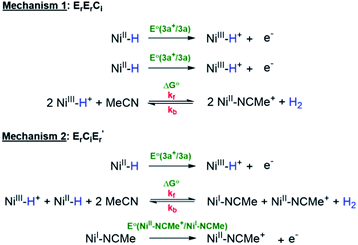
In order to better understand the mechanism of the oxidative H2 evolution process, we calculated the relative free energies of plausible intermediates along two different reaction coordinates corresponding to the disproportionation and deprotonation–oxidation mechanisms (Fig. 5). The relative free energies of all intermediates are referenced to the 3a+/3a couple. As a result, note that the free energies of 3a+ and 3a are the same in Fig. 5.31From the electrode potential of the Ni(III)H/Ni(II)H couple, all intermediates in either pathway are energetically downhill. However, the association step to form the Ni(III)–Ni(III) H2 bridging structure has a much higher driving force (−34.8 kcal mol−1) compared to the analogous step in mechanism 2 (−3.2 kcal mol−1).
Changes in the pKa and BDFE of 3a on one-electron oxidation were computed at the same level of theory as above using isodesmic reaction schemes with reference compounds (see Computational details). The results shown in Tables S1 and S2† indicate substantial thermodynamic activation towards deprotonation as well as H-atom abstraction (see ESI†) which is in line with the high exergonicity of the whole process at the (Ni(III)H/Ni(II)H) potential leading to H2 evolution. Our calculations predict a decrease in pKa of about 46 units on going from Ni(II)H to the Ni(III)H cation (Table S2†). This result was cross-verified with five other density functionals ranging from local GGA to hybrid-GGA32,33 and was found to be consistent (Fig. S8†). This difference in pKa is much higher than the values reported in the literature for octahedral Ru hydrides.10 This result is consistent with the high oxidation potential of the parent hydride 3a as compared to those reported for the Ru hydrides.
Given the calculated pKa values of the Ni(III)H cation we expect deprotonation of the metal hydride by the solvent. However, our observation of quantitative H2 production (vide supra) from the Ni complexes provides evidence against any net contribution from deprotonation of the Ni(III)H cation by the solvent. The likely pathway involves half the nickel hydrides deprotonating after oxidation at the electrode surface, with the released protons reacting with Ni(II) hydride diffusing towards the electrode surface in the depletion layer to make H2, followed by the oxidation of the deprotonated Ni at the electrode to a Ni(II) species (ErCiEr′).
Electrochemical simulation to obtain rate constant for the following chemical reaction
Fast scan-rate CV experiments using ultramicroelectrodes were performed in an attempt to observe a return wave after oxidation of 3a (Fig. S2†), which would then enable a reliable estimate of the rate of the following chemical reaction. However, the CV's were irreversible up to a scan-rate of 2000 V s−1. Concentration dependent CVs down to 0.125 mM 3a also did not show a return reduction wave (Fig. S3†). Even higher scan rates or lower concentrations did not yield anything substantive due to the ratio of faradaic to capacitive current becoming too low for meaningful interpretations. We therefore simulated our electrochemical data in DigiElch 7™ to estimate the lower limit of the rate of the following chemical reaction. CVs were simulated from two different regimes, viz. scan rate of 4 V s−1 using a 3 mm diameter disk electrode, and scan rate of 400 V s−1 using an 11 μm diameter disk electrode were chosen (see ESI† for complete details of the simulations). 400 V s−1 was the highest scan rate at which the faradaic and capacitive components of the current could be reasonably separated.To estimate the standard electron-transfer rate constant ks, experimentally measured CVs of the corresponding chloride complex 2a were simulated with a planar 1D semi-infinite diffusion model as implemented in DigiElch 7™, shown in Fig. S4.† Estimates of the lower limit of the uncompensated resistance of the cells, Ru, were made based on the cell geometry and published electrolyte conductivities.34 A sensitivity analysis was then performed to estimate the range of Ru and ks that fit this data (see ESI† for details).
Using this information, CVs of 3a were simulated according to both of the mechanisms (Scheme 6) viz. bimolecular disproportionation (ErErCi) and deprotonation-oxidation (ErCiEr′) and the results are summarized in Fig. 6 and Table 2. The reported kf and E° correspond to approximately the lowest values above which there is no return wave in the CVs, which was verified by sensitivity analysis of the simulation (Fig. S5b†).
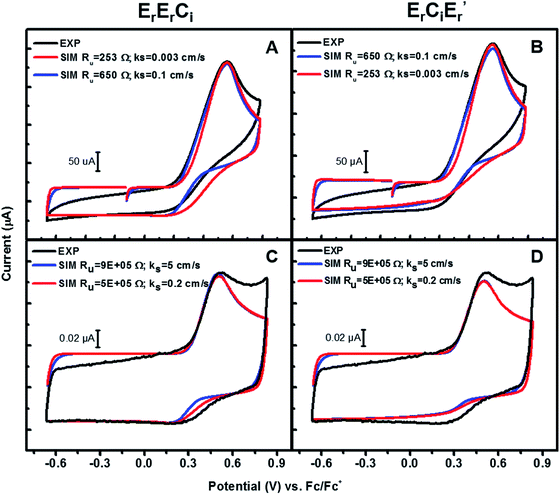 | ||
| Fig. 6 Experiments and simulations of CVs of 3a at (A) and (B) 4 V s−1 with a 3 mm diameter working electrode; (C) and (D) 400 V s−1 with a 11 μm diameter working electrode. See ESI† for details. | ||
| Mechanism | Scan rate (V s−1) | E°(min) (V) vs. Fc+/Fc | k f(min) (M−1 s−1) | ||
|---|---|---|---|---|---|
| I | II | I | II | ||
| ErErCi | 400 | 0.33 | 0.33 | 1.0 × 10⁷ | 1.0 × 10⁷ |
| 4 | 0.30 | 0.30 | 1.0 × 10⁶ | 1.0 × 10⁶ | |
| ErCiEr′ | 400 | 0.35 | 0.35 | 5.0 × 10⁶ | 5.0 × 10⁶ |
| 4 | 0.32 | 0.32 | 7.0 × 10⁴ | 2.5 × 10⁴ | |
At 400 V s−1, the predicted lower limit for kf is on the order of 107 M−1 s−1 for ErErCi and 5 × 10⁶ M−1 s−1 for ErCiEr′, both mechanisms therefore being extremely facile. Higher scan-rate simulations with smaller electrodes provide a higher and therefore better estimate for kf and E° than their lower scan-rate counterparts. Consistent with these expectations, the simulations at 4 V s−1 gave slightly lower values for kf(min) and E°(min), shown in Table 2. It is interesting to note the difference in the bimolecular rates of these two mechanisms predicted by the simulations, with kf (ErErCi) being slightly larger than kf (ErCiEr′) in either frequency regime by a factor of two, although both mechanisms fit the experimental data equally well.
Conclusions
If earth-abundant metal hydrides are to be employed as electrocatalysts in fuel cells (Scheme 1), it is important to fully understand their reactivity on electron transfer out of the metal–hydrogen bond. The nickel(II) hydrides synthesized in this work have proven to be highly stable targets for such electrochemical studies. We have shown in this work that the one-electron oxidation in these d8 square-planar nickel hydride complexes leads to highly exergonic and extremely rapid post-oxidative H2 evolution instead of the production of protons and electrons as was originally desired. This work therefore highlights an important challenge in using transition metal hydrides to electro-oxidize hydrogen containing liquid fuels in a fuel cell. It is possible that site isolation of these hydrides on a solid support would suppress this bimolecular H2 evolution pathway on oxidation, and lead to protons and electrons instead. However the high positive potentials required for the first oxidation of these hydrides render them unlikely targets for ergoneutral electrocatalysts.Experimental details
Cyclic voltammetry
Cyclic voltammetry experiments were performed with a SP-200 potentiostat from Bio-Logic Co. with a glassy carbon 3 mm diameter disk electrode (MF-2012) or a carbon fibre tip 11 μm diameter ultramicroelectrode (MF-2007) from BASi Inc. as the working electrode, a Ag/AgNO3(10 mM), MeCN electrode as the non-aqueous reference electrode, and a Pt wire as the counter electrode in a typical three-electrode cell. TBABF4 (0.1 M) was used as the supporting electrolyte. All experiments were done under N2 in a glove-box.Bulk electrolysis was performed in an ‘H-cell’ with two cylindrical glass chambers of 2 cm diameter connected by a glass joint fitted with a sintered glass frit. A 2 cm × 3 cm rectangular piece of carbon cloth suspended into the analyte solution with a copper wire was used as the working electrode. A finely polished and air-dried silver wire (0.032′′ diameter) was used as the pseudo reference in the same chamber. A polished Pt wire (0.032′′ diameter) was used as the counter electrode in the other compartment of the cell. Both compartments were sealed with rubber septa to prevent the escape of any gas generated. After bulk electrolysis, percent H2 was determined by headspace analysis using a Shimadzu Gas Chromatograph equipped with a 100 μL sample loop, a TCD, and a CarbonPLOT column with N2 carrier gas. Percent H2 was quantified by a one point calibration with a 1% H2 standard.
General experimental information
Unless otherwise noted, all organometallic compounds were prepared and handled under a nitrogen atmosphere using standard Schlenk and glovebox techniques. Dry and oxygen-free solvents (benzene, THF, pentane, and ether) were collected from an Innovative Technology PS-MD-6 solvent purification system and used throughout the experiments. Toluene and C6D6 were distilled from a deep purple solution of Na and benzophenone under a nitrogen atmosphere. CH3CN was dried using CaH2 and stored over 4 Å molecular sieves. Other solvents such as CD2Cl2 and CDCl3 were used as received from commercial sources. 1H, 13C, and 31P NMR spectra were recorded on a Bruker Avance-400 MHz spectrometer. Chemical shift values in 1H and 13C NMR spectra were referenced internally to the residual solvent resonances, whereas 31P NMR spectra were referenced externally to 85% H3PO4 (0 ppm). Infrared spectra were recorded in the solid state on a Thermo Scientific Nicolet 4700 FT-IR spectrometer equipped with smart orbit diamond attenuated total reflectance (ATR) accessory. Elemental analysis was performed by the CENTC Elemental Analysis Facility at the University of Rochester Using a Perkin Elmer 2400 Series II elemental analyzer in CHN mode. Preparation of 1,3-(tBu2PO)2C6H4 (1a),24 5-OCH3-1,3-(tBu2PO)2C6H3 (1b),24 5-CH3-1,3-(tBu2PO)2C6H3 (1c),24 4,6-(tBu)2-1,3-(tBu2PO)2C6H2 (1d),252a,232d,25 and 3a23 have been previously reported in the literature.Synthesis of [5-OCH3-1,3-(tBu2PO)2C6H2]NiCl (2b)
Under a nitrogen atmosphere, 50 mL of toluene was added to a mixture of 1b (0.86 g, 2.0 mmol) and anhydrous NiCl2 (285 mg, 2.2 mmol), giving an orange suspension. While the solution was being refluxed for 24 h, an orange solution resulted with some undissolved residues. After the mixture was cooled to room temperature, the residues were removed by gravity filtration and a clear orange filtrate was obtained. The volume of the orange filtrate was reduced to ca. 5 mL, and then Et2O was added to cause precipitation of a yellow solid. The product was collected by filtration, washed with Et2O, and dried under vacuum to afford a yellow powder of 2b (875 mg, 84% yield). X-ray-quality crystals were grown by allowing a layer of pentane to slowly diffuse into a saturated CH2Cl2 solution of the complex at 0 °C. 1H NMR (400 MHz, CDCl3, δ): 1.42 (virtual triplet, PC(CH3)3, JP–H = 8 Hz, 36H), 3.65 (s, OCH3, 3H), 5.98 (s, ArH, 2H). 13C{1H} NMR (101 MHz, CDCl3, δ): 28.13 (s, PC(CH3)3), 39.32 (t, JP–C = 7.1 Hz, PC(CH3)3), 55.47 (s, OCH3), 91.98 (t, JP–C = 6.1 Hz, ArC), 114.24 (t, JP–C = 22.2 Hz, ArC), 161.38 (s, ArC), 169.68 (t, JP–C = 10.1 Hz, ArC). 31P{1H} NMR (162 MHz, CDCl3, δ): 185.66 (s). Anal. calcd for C23H41ClO3P2Ni: C, 52.96; H, 7.92. Found: C, 52.93; H, 7.89.Synthesis of [5-CH3-1,3-(tBu2PO)2C6H2]NiCl (2c)
This compound was prepared from 1c (1.66 g, 4.02 mmol) and anhydrous NiCl2 (573 mg, 4.42 mmol) in 78% yield (1.59 g) by a procedure similar to that used for 2b. X-ray-quality crystals were grown by allowing a layer of pentane to slowly diffuse into a saturated CH2Cl2 solution of the complex at 0 °C. 1H NMR (400 MHz, CDCl3, δ): 1.41 (virtual triplet, PC(CH3)3, JP–H = 8 Hz, 36H), 2.13 (s, CH3, 3H), 5.18 (s, ArH, 2H). 13C{1H} NMR (101 MHz, CDCl3, δ): 21.55 (s, CH3), 28.13 (s, PC(CH3)3), 39.27 (t, JP–C = 7.1 Hz, PC(CH3)3), 105.92 (t, JP–C = 6.1 Hz, ArC), 120.56 (t, JP–C = 21.2 Hz, ArC), 139.02 (s, ArC), 169.44 (t, JP–C = 10.1 Hz, ArC). 31P{1H} NMR (162 MHz, CDCl3, δ): 184.04 (s). Anal. calcd for C23H41ClO2P2Ni: C, 54.63; H, 8.17. Found: C, 54.75; H, 8.07.Synthesis of [5-OCH3-1,3-(tBu2PO)2C6H2]NiH (3b)
Under a nitrogen atmosphere a suspension of LiAlH4 (729 mg, 19.2 mmol) and 2b (500 mg, 0.96 mmol) in 40 mL of benzene was stirred at room temperature for 24 h. The resulting mixture was filtered through a short plug of Celite to afford a yellow solution. After the solvent was evaporated under vacuum, the desired nickel hydride 3b was isolated as a light yellow powder (322 mg, 69% yield). X-ray-quality crystals were grown by layering CH3OH on a saturated THF solution of the hydride at 0 °C and allowing it to slowly diffuse. 1H NMR (400 MHz, C6D6, δ): −8.06 (t, JP–H = 52 Hz, NiH, 1H), 1.32 (virtual triplet, PC(CH3)3, JP–H = 8 Hz, 36H), 3.36 (s, OCH3, 3H), 6.56 (s, ArH, 2H). 13C{1H} NMR (101 MHz, C6D6, δ): 28.56 (t, JP–C = 3.0 Hz, PC(CH3)3), 37.88 (t, JP–C = 9.1 Hz, PC(CH3)3), 55.06 (s, OCH3), 92.12 (t, JP–C = 6.1 Hz, ArC), 133.36 (t, JP–C = 15.2 Hz, ArC), 162.50 (s, ArC), 169.09 (t, JP–C = 10.1 Hz, ArC). 31P{1H} NMR (162 MHz, C6D6, δ): 218.20 (s). IR (ATR, cm−1): νNi–H = 1790. Anal. calcd for C23H42O3P2Ni: C, 56.70; H, 8.69. Found: C, 56.28; H, 8.63.Synthesis of [5-CH3-1,3-(tBu2PO)2C6H2]NiH (3c)
This compound was prepared from 2c (500 mg, 0.99 mmol) and LiAlH4 (751 mg, 19.8 mmol) in 65% yield (294 mg) by a procedure similar to that used for 3b. X-ray-quality crystals were grown by layering CH3OH on a saturated hexane solution of the nickel hydride at 0 °C and allowing it to slowly diffuse. 1H NMR (400 MHz, C6D6, δ): −7.98 (t, JP–H = 52 Hz, NiH, 1H), 1.33 (virtual triplet, PC(CH3)3, JP–H = 8 Hz, 36H), 2.19 (s, CH3, 3H), 6.67 (s, ArH, 2H). 13C{1H} NMR (101 MHz, C6D6, δ): 21.94 (s, CH3), 28.57 (s, PC(CH3)3), 37.85 (t, JP–C = 8.1 Hz, PC(CH3)3), 105.78 (s, ArC), 138.72 (s, ArC), 139.10 (t, JP–C = 16.2 Hz, ArC), 168.94 (t, JP–C = 9.1 Hz, ArC). 31P{1H} NMR (162 MHz, C6D6, δ): 216.22 (s). IR (ATR, cm−1): νNi–H = 1768. Anal. calcd for C23H42O2P2Ni: C, 58.62; H, 8.98. Found: C, 58.78; H, 8.92.Synthesis of [4,6-(tBu)2-1,3-(tBu2PO)2C6H2]NiH (3d)
This compound was prepared from 2d (500 mg, 0.83 mmol) and LiAlH4 (630 mg, 16.6 mmol) in 78% yield (379 mg) by a procedure similar to that used for 3b. X-ray-quality crystals were grown by layering CH3OH on a saturated hexane solution of the nickel hydride at 0 °C and allowing it to slowly diffuse. 1H NMR (400 MHz, C6D6, δ): −7.90 (t, JP–H = 56 Hz, NiH, 1H), 1.36 (virtual triplet, PC(CH3)3, JP–H = 8 Hz, 36H), 1.60 (s, C(CH3)3, 18H), 7.32 (s, ArH, 1H). 13C{1H} NMR (101 MHz, C6D6, δ): 28.53 (s, PC(CH3)3), 30.48 (s, C(CH3)3), 34.38 (s, C(CH3)3), 37.64 (t, JP–C = 9.1 Hz, PC(CH3)3), 123.09 (s, ArC), 125.83 (t, JP–C = 5.1 Hz, ArC), 146.07 (t, JP–C = 16.2 Hz, ArC), 163.92 (t, JP–C = 9.1 Hz, ArC). 31P{1H} NMR (162 MHz, C6D6, δ): 215.04 (s). IR (ATR, cm−1): νNi–H = 1810. Anal. calcd for C30H56O2P2Ni: C, 63.28; H, 9.91. Found: C, 62.95; H, 9.75.Synthesis of [(1,3-(tBu2PO)2C6H3)Ni(NCCH3)]BF4 (4a)
![[triple bond, length as m-dash]](https://www.rsc.org/images/entities/char_e002.gif) N = 2290.
N = 2290.
Computational details
All quantum chemical calculations based on density functional theory (DFT)35–37 were performed using the Gaussian09 software package.38 Intermediates were optimized in the gas phase using the M06 functional39 to obtain the lowest energy structures along with their electronic energies. A 6-311g* basis set40–43 was employed for all the s- and p-block elements and the LANL2DZ basis set44,45 with effective core potentials for Ni. Subsequent harmonic analyses were performed on all the optimized structures to obtain bond frequencies and thermal corrections to the free energy,46,47 which were added to the previously calculated electronic energies to obtain the absolute free energies in the gas phase. Solvation energies for the optimized structures were obtained at the same level of theory using the SMD (Solvation Model Density) model48 for acetonitrile, which is a polarizable continuum solvent model.The standard reaction free energy for each set of reactants and products was then calculated according to eqn (3). Standard state corrections were made to the free energies to account for the change in going from 1 mol per 24.46 L (gas phase) to 1 M (solution phase), which amounts to RT![[thin space (1/6-em)]](https://www.rsc.org/images/entities/char_2009.gif) ln(24.46) or 1.89 kcal mol−1.
ln(24.46) or 1.89 kcal mol−1.
| ΔG°SMD(MeCN)reaction = ΔG°SMD(MeCN)products − ΔG°SMD(MeCN)reactants | (3) |
To compute the bond dissociation free energy (BDFE) and pKa for 3a in MeCN, an isodesmic scheme, involving the nickel hydride complexes 3a and 3a+ and a set of reference molecules, was employed as shown in eqn (4)–(10).
 | (4) |
 | (5) |
| BDFE(M–H) = ΔG°1 + BDFE(R–H) | (6) |
 | (7) |
 | (8) |
| pKa(M–H) = −log10[exp(−ΔG°2/RT)] + pKa(B–H) | (9) |
| ΔpKa = pKa(MIII–H) − pKa(MII–H) = (ΔG°2(3a+) − ΔG°2(3a))/(2.303RT) | (10) |
Reported values of BDFE(R–H) and pKa(B–H) in MeCN solvent for a set of reference molecules were taken from literature;49,50 ΔG°1 and ΔG°2 were computed by our DFT method discussed above, employing the SMD model for MeCN.48 For pKa calculations, additional benchmarking was performed using other density functionals viz. M06L,51 B3LYP,52–54 B3P86,53,55 BP86 52,55,56 and ωB97xD.57 All electrochemical simulations were performed using DigiElch 7™.58
Acknowledgements
This work was funded by the Center for Electrocatalysis, Transport Phenomena, and Materials (CETM) for Innovative Energy Storage, an Energy Frontier Research Center funded by the U.S. Department of Energy, and the ESD NYSTAR program. S. R would like to thank Andrew Ingram and Kate Waldie for the GC experiment.Notes and references
- R. H. Crabtree, Energy Environ. Sci., 2008, 1, 134–138 CAS.
- C. M. Araujo, D. L. Simone, S. J. Konezny, A. Shim, R. H. Crabtree, G. L. Soloveichik and V. S. Batista, Energy Environ. Sci., 2012, 5, 9534–9542 CAS.
- S. P. Annen, V. Bambagioni, M. Bevilacqua, J. Filippi, A. Marchionni, W. Oberhauser, H. Schönberg, F. Vizza, C. Bianchini and H. Grützmacher, Angew. Chem., Int. Ed. Engl., 2010, 49, 7229–7233 CrossRef CAS PubMed.
- P. Driscoll, E. Deunf, L. Rubin, O. Luca, R. Crabtree, C. Chidsey, J. Arnold and J. Kerr, in ECS Transactions, The Electrochemical Society, 2011, vol. 35, pp. 3–17 Search PubMed.
- P. F. Driscoll, E. Deunf, L. Rubin, J. Arnold and J. B. Kerr, J. Electrochem. Soc., 2013, 160, G3152–G3158 CrossRef CAS.
- M. Bevilacqua, C. Bianchini, A. Marchionni, J. Filippi, A. Lavacchi, H. Miller, W. Oberhauser, F. Vizza, G. Granozzi, L. Artiglia, S. P. Annen, F. Krumeich and H. Grützmacher, Energy Environ. Sci., 2012, 5, 8608–8620 CAS.
- W. Baratta, G. Chelucci, S. Gladiali, K. Siega, M. Toniutti, M. Zanette, E. Zangrando and P. Rigo, Angew. Chem., Int. Ed. Engl., 2005, 44, 6214–6219 CrossRef CAS PubMed.
- A. Fujii, S. Hashiguchi, N. Uematsu, T. Ikariya and R. Noyori, J. Am. Chem. Soc., 1996, 118, 2521–2522 CrossRef CAS.
- M. Yamakawa, H. Ito and R. Noyori, J. Am. Chem. Soc., 2000, 122, 1466–1478 CrossRef CAS.
- K. T. Smith, C. Roemming and M. Tilset, J. Am. Chem. Soc., 1993, 115, 8681–8689 CrossRef CAS.
- O. B. Ryan, M. Tilset and V. D. Parker, J. Am. Chem. Soc., 1990, 112, 2618–2626 CrossRef CAS.
- O. B. Ryan, K. Smith and M. Tilset, J. Organomet. Chem., 1991, 421, 315–322 CrossRef CAS.
- J. P. Collman, P. S. Wagenknecht and N. S. Lewis, J. Am. Chem. Soc., 1992, 114, 5665–5673 CrossRef CAS.
- V. Skagestad and M. Tilset, J. Am. Chem. Soc., 1993, 115, 5077–5083 CrossRef CAS.
- C. Bianchini, M. Peuzzini, A. Ceccanti, F. Laschi and P. Zanello, Inorg. Chim. Acta, 1997, 259, 61–70 CrossRef CAS.
- T.-Y. Cheng, D. J. Szalda, J. Zhang and R. M. Bullock, Inorg. Chem., 2006, 45, 4712–4720 CrossRef CAS PubMed.
- M. J. Krafft, M. Bubrin, A. Paretzki, F. Lissner, J. Fiedler, S. Záliš and W. Kaim, Angew. Chem., Int. Ed. Engl., 2013, 52, 6781–6784 CrossRef CAS PubMed.
- O. V. Ozerov, C. Guo, L. Fan and B. M. Foxman, Organometallics, 2004, 23, 5573–5580 CrossRef CAS.
- L.-C. Liang, P.-S. Chien and P.-Y. Lee, Organometallics, 2008, 27, 3082–3093 CrossRef CAS.
- R. B. Lansing, K. I. Goldberg and R. A. Kemp, Dalton Trans., 2011, 40, 8950–8958 RSC.
- N. Grüger, L.-I. Rodríguez, H. Wadepohl and L. H. Gade, Inorg. Chem., 2013, 52, 2050–2059 CrossRef PubMed.
- C. Rettenmeier, H. Wadepohl and L. H. Gade, Chem.–Eur. J., 2014, 20, 9657–9665 CrossRef CAS PubMed.
- S. Chakraborty, J. A. Krause and H. Guan, Organometallics, 2009, 28, 582–586 CrossRef CAS.
- I. Göttker-Schnetmann, P. White and M. Brookhart, J. Am. Chem. Soc., 2004, 126, 1804–1811 CrossRef PubMed.
- T. Chen, L. Yang, L. Li and K.-W. Huang, Tetrahedron, 2012, 68, 6152–6157 CrossRef CAS.
- V. Pandarus and D. Zargarian, Organometallics, 2007, 26, 4321–4334 CrossRef CAS.
- O. R. Luca, J. D. Blakemore, S. J. Konezny, J. M. Praetorius, T. J. Schmeier, G. B. Hunsinger, V. S. Batista, G. W. Brudvig, N. Hazari and R. H. Crabtree, Inorg. Chem., 2012, 51, 8704–8709 CrossRef CAS PubMed.
- A. J. Bard and L. R. Faulkner, Electrochemical Methods: Fundamentals and Applications, Wiley, New York, 2nd edn, 2001 Search PubMed.
- H. A. Muathen, Indian J. Chem., 1991, 30, 522–524 Search PubMed.
- G. R. Fulmer, A. J. M. Miller, N. H. Sherden, H. E. Gottlieb, A. Nudelman, B. M. Stoltz, J. E. Bercaw and K. I. Goldberg, Organometallics, 2010, 29, 2176–2179 CrossRef CAS.
- B. H. Solis and S. Hammes-Schiffer, Inorg. Chem., 2011, 50, 11252–11262 CrossRef CAS PubMed.
- S. F. Sousa, P. A. Fernandes and M. J. Ramos, J. Phys. Chem. A, 2007, 111, 10439–10452 CrossRef CAS PubMed.
- T. Sperger, I. A. Sanhueza, I. Kalvet and F. Schoenebeck, Chem. Rev., 2015, 115, 9532–9586 CrossRef CAS PubMed.
- K. M. Kadish, J. Q. Ding and T. Malinski, Anal. Chem., 1984, 56, 1741–1744 CrossRef CAS PubMed.
- W. Kohn and L. J. Sham, Phys. Rev., 1965, 140, A1133–A1138 CrossRef.
- P. Hohenberg, Phys. Rev., 1964, 136, B864–B871 CrossRef.
- R. G. Parr and W. Yang, Density Functional Theory of Atoms and Molecules, Oxford University Press, New York, 1989 Search PubMed.
- Gaussian 09, Revision D.01, M. J. Frisch, et al., Gaussian, Inc., Wallingford CT, 2009 Search PubMed.
- Y. Zhao and D. G. Truhlar, Theor. Chem. Acc., 2007, 120, 215–241 CrossRef.
- T. Clark, J. Chandrasekhar, G. W. Spitznagel and P. V. R. Schleyer, J. Comput. Chem., 1983, 4, 294–301 CrossRef CAS.
- M. J. Frisch, J. A. Pople and J. S. Binkley, J. Chem. Phys., 1984, 80, 3265–3269 CrossRef CAS.
- R. Krishnan, J. S. Binkley, R. Seeger and J. A. Pople, J. Chem. Phys., 1980, 72, 650–654 CrossRef CAS.
- A. V. Mitin, J. Baker and P. Pulay, J. Chem. Phys., 2003, 118, 7775–7782 CrossRef CAS.
- P. J. Hay and W. R. Wadt, J. Chem. Phys., 1985, 82, 270–283 CrossRef CAS.
- W. R. Wadt and P. J. Hay, J. Chem. Phys., 1985, 82, 284–298 CrossRef CAS.
- R. F. Ribeiro, A. V. Marenich, C. J. Cramer and D. G. Truhlar, J. Phys. Chem. B, 2011, 115, 14556–14562 CrossRef CAS PubMed.
- J. Ho, A. Klamt and M. L. Coote, J. Phys. Chem. A, 2010, 114, 13442–13444 CrossRef CAS PubMed.
- A. V Marenich, C. J. Cramer and D. G. Truhlar, J. Phys. Chem. B, 2009, 113, 6378–6396 CrossRef PubMed.
- J. J. Warren, T. A. Tronic and J. M. Mayer, Chem. Rev., 2010, 110, 6961–7001 CrossRef CAS PubMed.
- R. H. Morris, J. Am. Chem. Soc., 2014, 136, 1948–1959 CrossRef CAS PubMed.
- Y. Zhao and D. G. Truhlar, J. Chem. Phys., 2006, 125, 194101–194118 CrossRef PubMed.
- A. D. Becke, Phys. Rev. A, 1988, 38, 3098–3100 CrossRef CAS.
- A. D. Becke, J. Chem. Phys., 1993, 98, 5648–5652 CrossRef CAS.
- C. Lee, W. Yang and R. G. Parr, Phys. Rev. B: Condens. Matter Mater. Phys., 1988, 37, 785–789 CrossRef CAS.
- J. P. Perdew, Phys. Rev. B: Condens. Matter Mater. Phys., 1986, 33, 8822–8824 CrossRef.
- J. P. Perdew and W. Yue, Phys. Rev. B: Condens. Matter Mater. Phys., 1986, 33, 8800–8802 CrossRef.
- J.-D. Chai and M. Head-Gordon, J. Chem. Phys., 2009, 131, 174105–174113 CrossRef PubMed.
- M. Rudolph, J. Electroanal. Chem., 2003, 543, 23–39 CrossRef CAS.
Footnotes |
| † Electronic supplementary information (ESI) available: Supplementary electrochemical data, electrochemical simulation data, Cartesian coordinates and energies of DFT optimized structures, sample input files and X-ray analyses. CCDC 1418625–1418630. For ESI and crystallographic data in CIF or other electronic format see DOI: 10.1039/c5sc03189c |
| ‡ These authors contributed equally. |
| This journal is © The Royal Society of Chemistry 2016 |

