
 Open Access Article
 This Open Access Article is licensed under a Creative Commons Attribution-Non Commercial 3.0 Unported Licence
s-Heptazine oligomers: promising structural models for graphitic carbon nitride†
A.
Zambon
abc,
J.-M.
Mouesca
ab,
C.
Gheorghiu
ab,
P. A.
Bayle
ab,
J.
Pécaut
ab,
M.
Claeys-Bruno
d,
S.
Gambarelli
*ab and
L.
Dubois
*ab
aUniv. Grenoble Alpes, INAC-SCIB, F-38000 Grenoble, France. E-mail: serge.gambarelli@cea.fr; lionel.dubois@cea.fr
bCEA, INAC-SCIB, F-38000 Grenoble, France
cAix Marseille Université, LISA EA4672, 13397 Cedex 20, Marseille, France
dFrench Environment and Energy Management Agency 20, avenue du Grésillé-BP 90406 49004, Angers Cedex 01, France
First published on 28th October 2015
Abstract
Graphitic carbon nitride (g-CN) has interesting catalytic properties but is difficult to study due to its structure and how it is produced. In this study, linear s-heptazine oligomers were synthesized to serve as well-defined molecular models for g-CN. Cyclic voltammetry, absorption and emission spectroscopies showed a clear shift of properties towards those of g-CN as the number of heptazine units increased. DFT calculations supported the characterizations, and helped refine the properties observed.
Introduction
Carbon nitride (CN) was first synthesized by Berzelius and Liebig1 in the early 19th century, making it one of the oldest polymers to have been studied. Its graphitic phase, g-CN, is an organic semi-conductor with a gap of around 2.7 eV which has recently attracted considerable attention due to its photocatalytic properties. In addition to being capable of water splitting and a wide range of other important catalytic reactions,2 g-CN also has unique properties in numerous other domains, both in its bulk state and as nanoscale particles.3 Although first synthesized many decades ago, g-CN is still not well characterized. Its general structure was shown to be based on a tri-s-triazine or heptazine core,4 but its three-dimensional structure remains elusive. Initially, g-CN was considered to be a layered 2D material (hence its name), but more recent studies suggest that it is more likely to be formed of linear polymeric chains, named melon or polymeric carbon nitride (PCN) (Chart 1a).5 These chains would then assemble to create layers.5 Study and use of g-CN is hampered by its poor solubility – which prevents the use of classical characterization techniques – and by the fact that alterations to experimental conditions during its synthesis (precursors, temperature, etc.) yield different materials. To help understand the structure–property relationships of this outstanding material it would be very useful to be able to synthesize well-defined, tailored molecular models for g-CN. This type of strategy has previously been successfully used to elucidate the characteristics and fine-tune other materials such as graphene.6 If a method to synthesize low molecular weight analogues of g-CN were found it would provide access to a g-CN (heptazine oligomers) on a range of scales, from the bulk material down to individual molecules. Recently, the photocatalytic properties of melem (heptazine monomer) and a partially characterized low-mass oligomeric heptazine obtained from PCN by solvent extraction were published.7 This article has re-kindled interest in this class of molecules, and has made the need to obtain well-defined heptazine oligomers more pressing. In addition, to contribute to g-CN characterization, the chemistry based on these molecules could be useful in developing new families of ligands with novel physico-chemical properties (fluorescence, absorption, redox, etc.).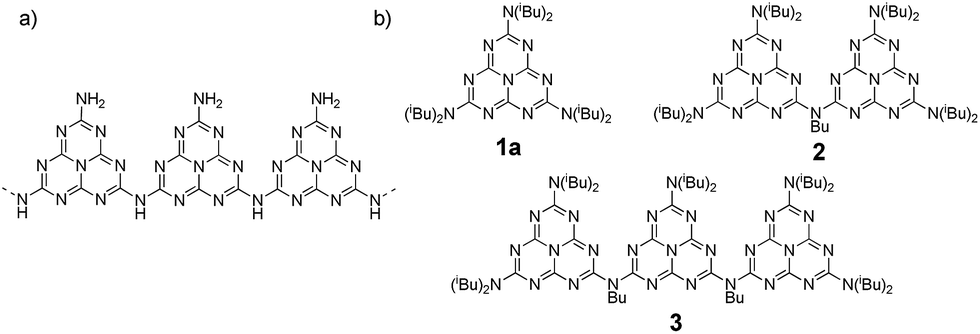 | ||
| Chart 1 (a) proposed structure of PCN and (b) linear oligomers synthesized for this study. | ||
Because the chemistry of heptazine has not yet attracted much attention, heptazine oligomer synthesis is challenging.8 A key problem is that the most widely available and best described precursor material (cyameluric chloride) has three equivalent, very good, leaving groups which must be selectively exchanged by nucleophilic substitution during synthesis. Thus, selective substitution of only one or two chlorine atom(s) is difficult,9 and although reactions with secondary or primary amines have been reported in the literature, they generally lack selectivity. To overcome this hurdle, we chose diisobutylamine as the functional group for peripheral positions; in addition to enhancing selectivity, diisobutyl substituents also result in a final molecule which is more soluble in organic solvents.
In this paper, we present the first report of synthesis of a soluble linear heptazine monomer 1a, dimer 2 and trimer 3 (Scheme 1 and Chart 1b); we also describe their extensive physicochemical characterization and associated DFT analysis.
 | ||
| Scheme 1 Synthesis of heptazine oligomers. | ||
Results and discussion
Synthesis and characterisation
Monomer 1a was synthesized from cyameluric chloride simply by adding a large excess of diisobutylamine at room temperature. Dimer 2 and trimer 3 were synthesized in two steps. Firstly, the primary and secondary amines were selectively substituted at low temperature to obtain dissymmetric heptazines 1b, 1c and 1d (Scheme 1). Compounds 1c and 1b were then deprotonated with butyl lithium to generate a lithium amide which can substitute for the remaining chlorine atom on 1b. To produce 3, two successive coupling reactions were necessary, which is possibly why the yield for this compound (17%) was lower than the yield for 2 (85%). All these compounds, unlike melem and cyameluric chloride, were relatively soluble in a large variety of organic solvents (including acetonitrile, tetrahydrofuran, chloroform, and hexane). This feature facilitates their characterization (see ESI†). The expected structures of both the heptazine core and the alkyl moieties were fully compatible with IR, 1H and 13C liquid NMR spectra (Fig. S1–S20†).8a,9,10 XPS spectra of the as synthesized 1a, 2 and 3 oligomers were recorded (Fig. S58–S60†) and are in good agreement with data reported in literature for g-CN.7X-ray diffraction was performed on single crystals obtained by slow evaporation of a hexane/dichloromethane solution for 1a, and of a nitrobenzene solution for 2 (CCDC numbers 1051347 and 1051348, respectively) (see Table S1 for details†). The structure of 1a is shown in Fig. S26.†As previously reported for melem and its derivatives, the atoms of the heptazine system were found to be coplanar.9,10 The three bonds around the peripheral nitrogen (bearing the di-isobutyl substituent) were coplanar with the heptazine core, indicating an sp2 hybridization and a strong delocalization of the lone nitrogen electron pair onto the heptazine (mean deviation around the mean plane of the heptazine and nearby nitrogen: 0.043 Å). An n–π interaction, with a distance of 3.45 Å, was observed between a peripheral nitrogen and the heptazine core of a nearby molecule. This distance is slightly larger than the interlayer distance measured by powder XRD for g-CN (3.2 Å).5
The mercury drawing for 2 indicates that the three bonds around the bridging nitrogen are coplanar (plane Nb) (Fig. 1). One of the key features of this structure is the wide angle (66.7°) between the two heptazine planes (H1 and H2). Plane Nb is located between H1 and H2, and the respective angles are NbH1: 50.26° and NbH2: 22.67°. (Molecular) DFT calculations were performed on dimer 2 in an isolated state (i.e., without crystal packing). This analysis found the angle between the two heptazine units (calculated value 41.7°) to be the result of antagonistic behaviors: mutual repulsion between the lone-pair electrons of the core nitrogen atoms located close to the bridging bond and the π-delocalization through the bridging nitrogen. Further analysis indicated a low rotational barrier around this dihedral angle (12.5 kJ mol−1) (Table S11†). In stark contrast, the experimental structure for 1a and 2 showed lone pairs for all peripheral nitrogen atoms perpendicular to their respective heptazine planes. This result once again agreed closely with DFT which calculated a high rotational barrier (107 kJ mol−1, Table S6†). To determine experimental values for these rotational barriers, 1H and 13C NMR experiments were performed for oligomers 2 and 3 in toluene at temperatures ranging from 223 K to 353 K (Fig. S23–S25†). For the isobutyl groups, only two distinct sets of 1H signals were detected at low temperatures. These signals became equivalent for 2 at high temperatures, but the coalescence temperature was not reached for 3 in our experiments. Eyring analysis11 of 2 indicated an estimated rotational barrier of 78 kJ mol−1 (see ESI for calculation details†), which is consistent with values published for ethyl groups in a dissymmetric monomeric melem derivative (90 kJ mol−1)9 and with our DFT calculations for 1a and dimer 2 (see above and ESI†). These results suggest that the rotational barriers determined based on NMR data were those of the peripheral nitrogen groups. Almost free rotation around the bridging nitrogen produces symmetrical NMR spectra, leaving only two sets of distinct isobutyl groups.
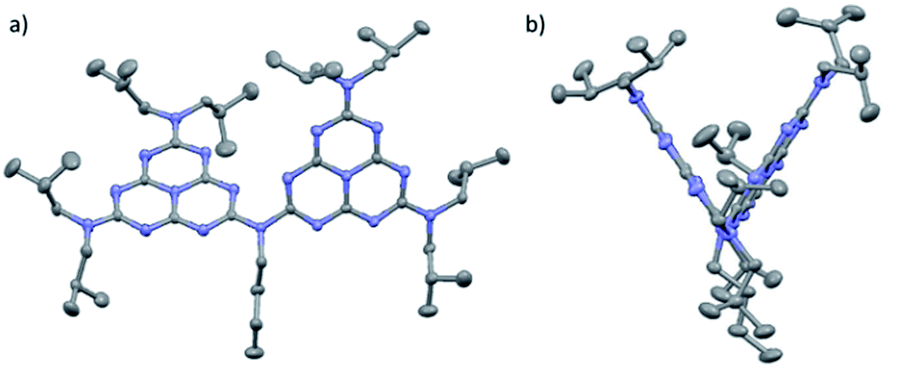 | ||
| Fig. 1 (a) Front and (b) side mercury representations of 2 with 50% probability ellipsoids, based on single-crystal X-ray analysis (nitrobenzene molecules and hydrogen removed). | ||
Optical properties
The optical properties of 1a, 2 and 3 in acetonitrile were studied by absorption and emission spectroscopies at room temperature (Fig. 2 and S27–S32†). The UV absorption spectra show a characteristic shape: a high absorbance zone and a medium-range absorbance tail in the near-UV range. Molar extinction coefficients were 89![[thin space (1/6-em)]](https://www.rsc.org/images/entities/char_2009.gif) 400 M−1 cm−1 for 1a (273 nm), 90200 M−1 cm−1 for 2 (276 nm) and 111300 M−1 cm−1 for 3 (272 nm). The lowest energy transitions were found at 315 nm (ε = 2000 M−1 cm−1) for 1a, 368 nm (2400 M−1 cm−1) for 2 and 370 nm (4900 M−1 cm−1) for 3, indicating a significant batho-chromic shift between 1a and 2 (+53 nm), and a very small one between 2 and 3 (+2 nm). A similar bathochromic shift between 1a and 2 (+48 nm) was found by DFT, but between compounds 2 and 3, the shift calculated (+30 nm) was larger.
400 M−1 cm−1 for 1a (273 nm), 90200 M−1 cm−1 for 2 (276 nm) and 111300 M−1 cm−1 for 3 (272 nm). The lowest energy transitions were found at 315 nm (ε = 2000 M−1 cm−1) for 1a, 368 nm (2400 M−1 cm−1) for 2 and 370 nm (4900 M−1 cm−1) for 3, indicating a significant batho-chromic shift between 1a and 2 (+53 nm), and a very small one between 2 and 3 (+2 nm). A similar bathochromic shift between 1a and 2 (+48 nm) was found by DFT, but between compounds 2 and 3, the shift calculated (+30 nm) was larger.
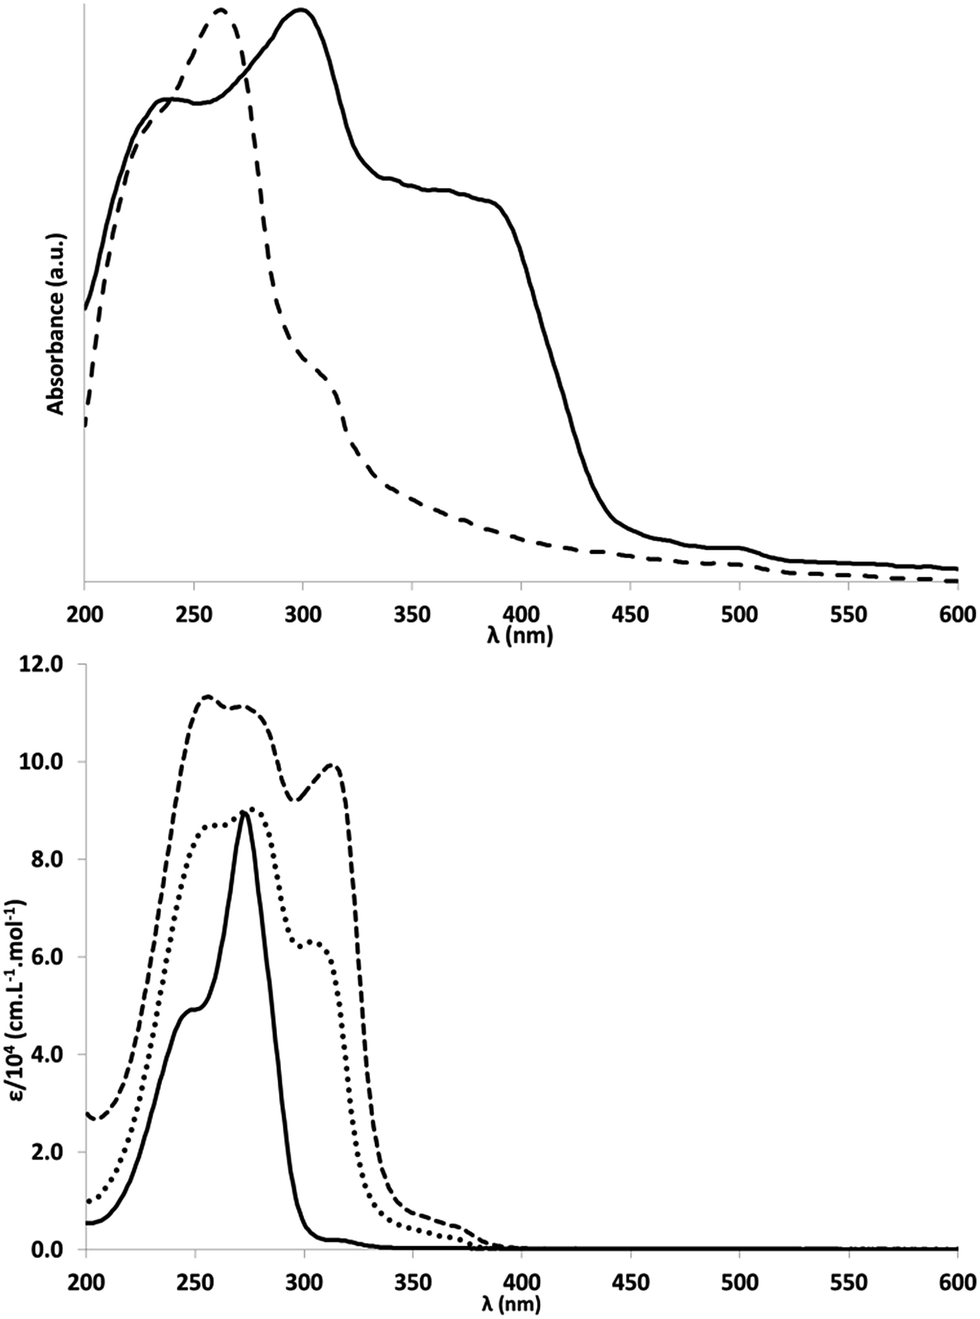 | ||
| Fig. 2 UV/Vis absorption spectra. Top: Solid state spectra (absorbance) of g-CN (solid line) and melem (dashed line). Bottom: 1a (solid line), 2 (dotted line) and 3 (dashed line) in acetonitrile, at room temperature. | ||
Like UV/Vis spectra, emission spectra (Fig. S43†) showed a bathochromic shift of the peak maximum between 1a (382 nm), 2 (417 nm) and 3 (443 nm). Emission spectra were not altered by changing the excitation wavelength, suggesting that the molecules always relax to the same excited state, and that the transition occurs between this excited state and the ground state. In support of this hypothesis, a significant Stokes shift, similar to that found for PCN materials, was observed. Fluorescence quantum yields were then measured for the same excitation wavelengths above 300 nm (instrumental limit). Results of this analysis were, for 1a: 315 nm (yield: 0.4%); for 2: 304 nm (0.5%), 353 nm (3.4%), 367 nm (2.5%); for 3: 313 nm (2.7%), 356 nm (14.7%), 372 nm (20.4%). Whatever the excitation wavelength, the quantum yield increased for 3 compared to 1a. The values obtained for 3 were similar to those reported for PCN nanosheets (19.6%) and higher than those found for bulk PCN (4.8%) under UV illumination.10,12 Both UV/visible spectra and emission spectra were very similar to those published for colloidal single-layer carbon nitride.3
Isobutyl substituents have a rather low effect on the optical properties of 1a compare to melem. For example, the maximum of the emission spectra of melem is given at 366 nm, which is only 16 nm shifted toward higher energy compare to 1a.10 A small shift of 10 nm is also observed in absorption spectroscopy (λmax = 263 nm for melem and λmax = 273 nm for 1a).
The absorption wavelengths of the experimental UV-visible spectra were well reproduced by TD-DFT calculations (see ESI: Fig. S33–S42†). The main orbitals involved in the lowest energy transition (hereafter referred to as the tail transition) were found to be from external nitrogen and core carbon atoms for monomer 1a (see orbitals in Fig. S46–S57†). For compounds 2 and 3, these orbitals were derived from a combination of external and bridging nitrogen/carbon atoms and core carbon atoms (see ESI for details†). Further calculations were therefore performed to better assess how both the nature of peripheral groups and their dihedral angle w.r.t. the core influenced the absorption spectra.
UV-Vis spectra calculated for 1a were compared to those calculated for melem (alkyl chain replaced by hydrogen). In these calculations, 1a showed a pronounced bathochromic shift with increasing dihedral angle of the N(iBu)2 groups, modulated by the orbitals involved in the transition: when only heptazine core orbitals were involved, the red-shift was much less pronounced (from 256 nm at 0° to 294 nm at 90°; see Table S5, Fig. S35 and 36†) than when peripheral groups were involved (tail transition from 322 nm at a dihedral angle of 0° to 750 nm at 90°). For melem, the same effect was observed on a smaller scale (from 264 nm at 0° to 418 nm at 75°; the transition probability at 90° was 0, see Table S7, Fig. S37 and 38†). Thus, the presence of the electron donating iBu alkyl chains leads to a larger red-shift upon increasing the tilt. For dimer 2 (Table S10 and Fig. S40†) and dimelem (Table S12 and Fig. S41†), similar effects (offset and rotation-induced red-shifts) were observed for a 30° rotation of all peripheral ligands, resulting in similar red-shifts to those computed for 1a at the same angle.
Because of the almost free rotation around the bridging nitrogen atoms, in our calculations we also varied the relative angle between the two heptazine units (between 0° and 90°), while maintaining the external nitrogen groups coplanar with their respective heptazine cores (see Fig. S40 and 41†). This variation in the relative angle had almost no effect on UV-visible spectra for 2 and dimelem, confirming the relevance of our oligomers: the UV-visible properties of PCN were thus reproduced despite different angles between the heptazine units in the different molecules.
Electrochemistry
The electrochemical properties of 1a, 2 and 3 in acetonitrile were investigated by cyclic voltammetry (Table 1, Fig. 3 and S44†). Oxidation causes completely irreversible electron transfers in all three compounds, at 2.111, 2.119 and 2.113 V per NHE, respectively, for the first wave. This first electron transfer was accompanied by decomposition of the corresponding radical cation as, after a first sweep in potential, we observed electrode passivation. Upon reduction, no wave was observed for 1a in acetonitrile as its reduction potential was beyond the electrolyte's electrochemical window (in DMSO, 1a exhibits a quasi-reversible electron transfer at −2.171 V per NHE). In acetonitrile, 2 and 3 underwent a first quasi-reversible electron transfer (−1.632 and −1.326 V per NHE, respectively) followed by a second irreversible reduction reaction, probably associated with a reversible chemical rearrangement. The similar oxidation potentials for 1a, 2 and 3 were notable, in contrast the first reduction potential increased significantly with the number of conjugated heptazines. This behaviour, already predicted in linear heptazine models, was rationalized by DFT calculations.13 In 1a, 2 and 3, several quasi-degenerate orbitals were found to be close to the HOMO level (Fig. S45†). Peripheral nitrogen substituents and low delocalization on the heptazine units significantly contributed to the occupied orbitals closest to the HOMO. Consequently, their energies did not vary significantly between 1a and 3, and the corresponding oxidation potentials were similar. DFT analysis also showed that the LUMO level for the heptazine oligomers was composed of one energetically isolated orbital to which all heptazine cores contributed (through delocalization). The reducing electron would therefore be delocalized over all the heptazine units, facilitating the reduction process when greater numbers of heptazine units are linked. This orbital ladder structure is strongly reminiscent of the band structure reported for g-CN, and is also found in other oligomers composed of several linked delocalized units.2c| Erd1/2a (V) | ΔErdpa (mV) | Eoxpc (V) | ErdDFT (V) | EoxDFT (V) | Eoxp − Erd1/2 | Eoptgd (eV) | |
|---|---|---|---|---|---|---|---|
| a Quasi-reversible first half-wave reduction potential. b Measured in DMSO. c First irreversible oxidation wave. d E optg values were estimated from the start of the absorption spectra. | |||||||
| 1a | −2.171b | 71b | +2.111 | −2.46 | 1.89 | 4.282 | 3.65 |
| 2 | −1.596 | 73 | +2.119 | −1.57 | 1.71 | 3.715 | 3.24 |
| 3 | −1.296 | 61 | +2.113 | −1.32 | 1.70 | 3.409 | 3.16 |
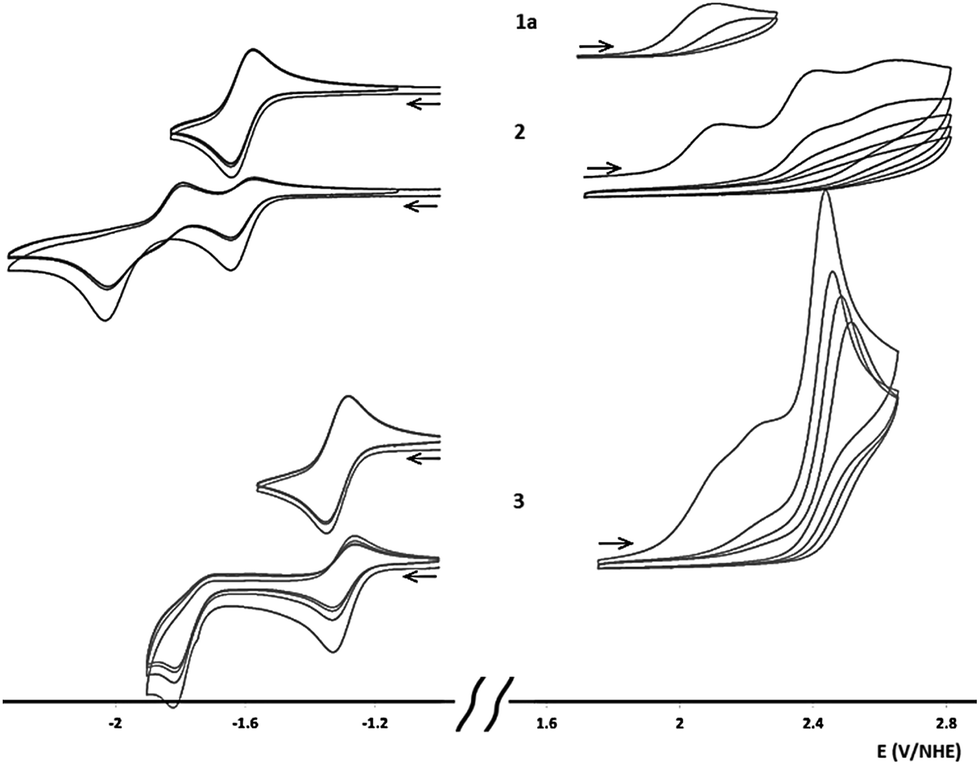 | ||
| Fig. 3 Cyclovoltamograms for 1a, 2 and 3. Two curves are shown for reduction of 2 and 3, top: scanning only the first reduction wave; bottom: scanning the second reduction wave. Conditions: room temperature, 1 mM compound, vitreous carbon electrode (dia = 3 mm); electrolyte: nBu4PF6 (0.1 M)/acetonitrile; platinum counter-electrode; scan rate: 100 mV s−1. Arrow indicates initial potential and scanning direction. | ||
Analysis of properties
The properties of oligomers are often investigated as a function of their size by plotting their physico-chemical characteristics as a function of 1/N, N being the number of core unit(s).16 In this representation (N → inf, 1/N → 0), even if some “saturation” effects are omitted, the intercept values resulting from linear interpolations can be reliably used to estimate properties such as band gap, UV-visible transitions, etc. for an equivalent ideal infinite polymer. This method has already been used to evaluate band gap of heptazine model by DFT calculation.17 We used this method to compare the properties of the heptazine oligomers studied in this work to those of PCN materials (Fig. 4). A caveat of this comparison is that the chemical structure of an infinite polymer based on our oligomers would be expected to be quite different from that of PCN, and the presence of iBu/nBu groups rather than H on peripheral nitrogen groups could also modify some physical and chemical properties. | ||
| Fig. 4 Energy diagram plotting reduction and oxidation potentials (top) as well as optical gaps (bottom) for 1a, 2, 3 as a function of the inverse of the number of heptazine units (N). CB and VB for g-CN were positioned based on ref. 15. O2 and H2 redox potentials were calculated at pH = 7. | ||
The oxidation potential for compounds 1a, 2 and 3 extrapolated to 2.12 V, and the reduction potential extrapolated to −0.91 V, i.e., a (electrochemical) gap of 3.03 eV for the putative infinite polymer. This extrapolated value was only slightly greater than the optical gap extrapolated based on the UV-visible spectrum (2.89 eV, 430 nm). Extrapolated DFT values provided comparable, but slightly smaller values (electrochemical gap: 2.31 eV and optical gap: 2.49 eV, 498 nm). The extrapolated properties for the putative infinite polymer were surprisingly similar to the gap calculated for bulk PCN (2.6 eV)2c and its optical gap (2.67 eV, 464 nm).15 These results strongly suggest a heptazine structure for PCN rather than a triazine structure.13,18 It will be interesting to perform the same kind of physico-chemical studies on the triazine oligomers already described in literature.19
Conclusions
This article reports the synthesis of soluble heptazine oligomers for the first time. These oligomers are surprisingly good molecular models of PCN, and the addition of peripheral groups does not appear to significantly change the properties of the heptazine cores. These perfectly characterised molecules display interesting features, such as strong fluorescence and high absorbance in the UV region with a significant red-shift as the number of linked heptazines increases. Our spectroscopic results are consistent with the oligomers studied being described as “loosely interacting” monomer units, in line with the conclusions of a recent photophysical study of bulk PCN.20 Our data and their subsequent extrapolation suggest that sizeable optical absorption in the visible range is unlikely to appear for pure linear heptazine oligomers until a high molecular mass has been reached, in agreement with theoretical studies of linear heptazine structures.13 The recently reported visible absorption data for di- and trimelem fractions could therefore be attributed either to additional “impurities” (such as alternative peripheral groups) or to solid effects.7 Finally, our oligomers are readily derivatized, opening up new possibilities for heptazine chemistry, making it possible to incorporate g-CN-like properties at will in organic molecules or in coordination complexes.Acknowledgements
This work was supported by the French Environment and Energy Management Agency (ADEME) and the CEA's DSM Energy program (MECANICS grant). We thank Dr Maighread Gallagher-Gambarelli for advice on English language usages.Notes and references
- J. Liebig, Ann. Pharm., 1834, 10, 1 CrossRef.
- (a) Y. Wang, X. Wang and M. Antonietti, Angew. Chem., Int. Ed., 2012, 51, 68 CrossRef CAS PubMed; (b) F. Su, M. Antonietti and X. Wang, Catal. Sci. Technol., 2012, 2, 1005 RSC; (c) X. Wang, K. Maeda, A. Thomas, K. Takanabe, G. Xin, J. M. Carlsson, K. Domen and M. Antonietti, Nat. Mater., 2009, 8, 76 CrossRef CAS PubMed; (d) A. Thomas, A. Fischer, F. Goettmann, M. Antonietti, J.-O. Mueller, R. Schloegl and J. M. Carlsson, J. Mater. Chem., 2008, 18, 4893 RSC; (e) F. Goettmann, A. Thomas and M. Antonietti, Angew. Chem., Int. Ed., 2007, 46, 2717 CrossRef CAS PubMed.
- Y. V. Panasiuk, A. E. Raevskaya, O. L. Stroyuk, P. M. Lytvyn and S. Y. Kuchmiy, RSC Adv., 2015, 5, 46843 RSC.
- (a) C. E. Redemanann and D. H. J. Lucas, J. Am. Chem. Soc., 1940, 62, 842 CrossRef; (b) L. Pauling and J. H. Sturdivant, Proc. Natl. Acad. Sci. U. S. A., 1937, 23, 615 CrossRef CAS PubMed.
- B. V. Lotsch, M. Doeblinger, J. Sehnert, L. Seyfarth, J. Senker, O. Oeckler and W. Schnick, Chem.–Eur. J., 2007, 13, 4969 CrossRef CAS PubMed.
- L. Chen, Y. Hernandez, X. Feng and K. Muellen, Angew. Chem., Int. Ed., 2012, 51, 7640 CrossRef CAS PubMed.
- V. W. H. Lau, M. B. Mesch, V. Duppel, V. Blum, J. Senker and B. V. Lotsch, J. Am. Chem. Soc., 2015, 137, 1064 CrossRef CAS PubMed.
- (a) H. Schroeder and E. Kober, J. Org. Chem., 1962, 27, 4262 CrossRef CAS; (b) J. Li, H. Nomura, H. Miyazaki and C. Adachi, Chem. Commun., 2014, 50, 6174 RSC; (c) E. Wirnhier and W. Schnick, Eur. J. Inorg. Chem., 2012, 1840 CrossRef CAS; (d) A. Schwarzer, U. Boehme and E. Kroke, Chem.–Eur. J., 2012, 18, 12052 CrossRef CAS PubMed; (e) T. Saplinova, C. Lehnert, U. Boehme, J. Wagler and E. Kroke, New J. Chem., 2010, 34, 1893 RSC; (f) T. Saplinova, V. Bakumov, T. Gmeiner, J. Wagler, M. Schwarz and E. Kroke, Z. Anorg. Allg. Chem., 2009, 635, 2480 CAS; (g) B. Traber, T. Oeser, R. Gleiter, M. Goebel and R. Wortmann, Eur. J. Org. Chem., 2004, 4387 CrossRef CAS; (h) D. R. Miller, D. C. Swenson and E. G. Gillan, J. Am. Chem. Soc., 2004, 126, 5372 CrossRef CAS PubMed; (i) E. Kroke, M. Schwarz, E. Horath-Bordon, P. Kroll, B. Noll and A. D. Norman, New J. Chem., 2002, 26, 508 RSC; (j) A. Schwarzer, T. Saplinova and E. Kroke, Coord. Chem. Rev., 2013, 257, 2032 CrossRef CAS.
- A. Schwarzer and E. Kroke, New J. Chem., 2011, 35, 953 RSC.
- B. Jurgens, E. Irran, J. Senker, P. Kroll, H. Muller and W. Schnick, J. Am. Chem. Soc., 2003, 125, 10288 CrossRef PubMed.
- (a) M. Oki, Applications of Dynamic NMR Spectroscopy to Organic Chemistry, Deerfield Beach, Florida, USA, 1985 Search PubMed; (b) J. Sandström, Dynamic NMR spectroscopy, London, 1982 Search PubMed.
- X. Zhang, X. Xie, H. Wang, J. Zhang, B. Pan and Y. Xie, J. Am. Chem. Soc., 2013, 135, 18 CrossRef CAS PubMed.
- C. Butchosa, P. Guiglion and M. A. Zwijnenburg, J. Phys. Chem. C, 2014, 118, 24833 CAS.
- V. V. Pavlishchuk and A. W. Addison, Inorg. Chim. Acta, 2000, 298, 97 CrossRef CAS.
- J. S. Zhang, X. F. Chen, K. Takanabe, K. Maeda, K. Domen, J. D. Epping, X. Z. Fu, M. Antonietti and X. C. Wang, Angew. Chem., Int. Ed., 2010, 49, 441 CrossRef CAS PubMed.
- (a) J. Gierschner, J. Cornil and H.-J. Egelhaaf, Adv. Mater., 2007, 19, 173 CrossRef CAS; (b) J. Rissler, Chem. Phys. Lett., 2004, 395, 92 CrossRef CAS; (c) H. Meier, U. Stalmach and H. Kolshorn, Acta Polym., 1997, 48, 379 CrossRef CAS.
- P. Chamorro-Posada, J. Vazquez-Cabo, F. M. Sanchez-Arevalo, P. Martin-Ramos, J. Martin-Gil, L. M. Navas-Gracia and R. C. Dante, J. Solid State Chem., 2014, 219, 232 CrossRef CAS.
- G. Algara-Siller, N. Severin, S. Y. Chong, T. Bjorkman, R. G. Palgrave, A. Laybourn, M. Antonietti, Y. Z. Khimyak, A. V. Krasheninnikov, J. P. Rabe, U. Kaiser, A. I. Cooper, A. Thomas and M. J. Bojdys, Angew. Chem., Int. Ed., 2014, 53, 7450 CrossRef CAS PubMed.
- W. J. Schnabel, R. Ratz and E. Kober, J. Org. Chem., 1962, 27, 2514 CrossRef CAS.
- (a) C. Merschjann, T. Tyborski, S. Orthmann, F. Yang, K. Schwarzburg, M. Lublow, M. C. Lux-Steiner and T. Schedel-Niedrig, Phys. Rev. B: Condens. Matter Mater. Phys., 2013, 87, 205204 CrossRef; (b) T. Tyborski, C. Merschjann, S. Orthmann, F. Yang, M. C. Lux-Steiner and T. Schedel-Niedrig, J. Phys.: Condens. Matter, 2012, 24, 162201 CrossRef CAS PubMed.
Footnote |
| † Electronic supplementary information (ESI) available: Experimental procedures, DFT calculations and physical data. CCDC 1051347 and 1051348. For ESI and crystallographic data in CIF or other electronic format see DOI: 10.1039/c5sc02992a |
| This journal is © The Royal Society of Chemistry 2016 |