
When do students recognize relationships between molecular structure and properties? A longitudinal comparison of the impact of traditional and transformed curricula
Sonia M.
Underwood
*a,
David
Reyes-Gastelum
b and
Melanie M.
Cooper
c
aDepartment of Chemistry & Biochemistry and STEM Transformation Institute, Florida International University, Miami, FL 33199, USA. E-mail: sonia.underwood@fiu.edu
bCenter for Statistical Training and Consulting, Michigan State University, East Lansing, MI 48824, USA
cDepartment of Chemistry, Michigan State University, East Lansing, MI 48824, USA
First published on 2nd February 2016
Abstract
The ability to use a chemical structure to predict and explain phenomenon is essential to a robust understanding of chemistry; however, previous research has shown that students find it difficult to make the connection between structure and properties. In this study we examine how student recognition of the connections between structure and properties evolves during the first two years of college chemistry courses. In addition, we investigate how an alternative general chemistry curriculum (Chemistry, Life, the Universe and Everything (CLUE)) impacts students' understanding during these first two-years. Using discrete-time survival analysis to analyze student responses to the Implicit Information from Lewis Structures Instrument (IILSI), we found that it takes multiple semesters for students enrolled in a traditional curriculum to recognize that chemical structures can be used as models to predict chemical and physical properties. Students in the CLUE curriculum, however, tend to make this connection earlier than a matched cohort of students from a traditional curriculum, and this advantage is maintained throughout the two semesters of organic chemistry. In general, the control group takes an additional year of organic chemistry to reach the same level as the CLUE students after a year of general chemistry.
Introduction
Understanding the relationship between the molecular structure of a compound and its macroscopic, observable properties is a core idea in chemistry (Murphy et al., 2012; Raker et al., 2013). It is crucial that students learn how to construct, decode and use structural representations early in a sequence of chemistry courses, otherwise much of what follows will simply be an exercise in memorization. While there are many structural representations that students encounter, Lewis structures are the first structures that students are introduced to that encode enough information to predict properties. Unfortunately, as has been well documented, many students have difficulty using such representations to predict the macroscopic properties of substances (Kozma and Russell, 1997; Shane and Bodner, 2006; Talanquer, 2008; Cooper et al., 2010, 2013; DeFever et al., 2015).Background
This paper is part of an ongoing research project in which we are attempting to understand how students construct and use molecular representations to predict and explain phenomena. As we have discussed previously it is not surprising that students have difficulty using molecular structures to predict properties because the task is complex and requires that students string together a fairly long sequence of actions and inferences (Cooper et al., 2012a). Students must determine the three-dimensional shape of the molecule, and use the electronegativity of the different atoms in each bond to determine bond polarity and overall molecular polarity. With this information students can then establish how molecules of the compound would interact through intermolecular forces and think about how these interactions change the energy of the system before they can predict macroscopic properties. For example, we expect students in general chemistry to be able to choose which substance has the highest boiling or melting point from a range of compounds, or is most soluble in water, or will exhibit acidic or basic properties. In effect we are asking students to move from using the structural drawing as a representation of structure to a model (National Research Council, 2012) that can be used to predict and explain macroscopic properties.In the first study in this series we asked students what they thought they could predict or explain by using a structure (Cooper et al., 2010). After a year of general chemistry all students (not surprisingly) understood that Lewis structures can be used to predict structural information, however, the same is not true for physical or chemical properties. Even after a year of organic chemistry, typically only about half of the students told us that they were able to predict any kind of property from the structure. These findings were further supported after the development of the Implicit Information from Lewis Structures Instrument (IILSI) which is a quick and reliable way to identify what students report they can do with a Lewis structure (Cooper et al., 2012a). The IILSI consists of one multiple-answer question: “What information could you determine using a Lewis structure and any other chemistry knowledge you may have? (Mark all that may apply)”. The students are presented with 16 types of information, which range from explicit structural information (e.g. element(s) present and number of bonds between particular atoms) to implicit information (e.g. acidity/basicity and relative boiling point) that must be determined using a Lewis structure and other knowledge. The IILSI also includes an additional answer “no information” for instances where (1) students truly believe no information can be predicted using a Lewis structure and (2) to help detect participants who are randomly selecting answer choices. Using the IILSI we were able to show that even after two years of chemistry many students did not seem to recognize that they could use a molecular structure to predict properties (Cooper et al., 2012a). We continued this study by implementing discrete-time survival analysis, an analysis method that allows us to determine when students first identify they can predict a particular property from a chemical structure, as they move through a curriculum (Underwood et al., 2015).
Survival analysis: identifying when an event occurs
Survival analysis originates from studies on mortality tables that are used to identify the length of time before death (hence the name) (Miller, 1981). This analysis framework has been applied to other fields such as sociology (where it is referred to as event history) and engineering (where it is referred to as reliability analysis or failure time) (Allison, 2010). It has also been used in education research to investigate length of career time for special education teachers (Singer and Willett, 1993) and retention factors and degree completion rates for students (Zwick and Sklar, 2005; Ishitani, 2006; Bowers, 2010). In our study (Underwood et al., 2015) we implemented survival analysis to determine not when something failed or someone died or left a course, but rather when students first began to recognize the connections between structure and properties.Discrete-time survival analysis is preferred over other methods of data analysis for a number of reasons. (1) It can handle the issue of attrition. Since students are not required, and typically do not, take four semesters of chemistry, many of the students who begin the study tend to leave before the end of the study. One of the assumptions of survival analysis is that those students who leave are equivalent to those who stay. We have previously shown that this is a reasonable assumption (Underwood et al., 2015). That is, students who do not continue have the same average grades and same IILSI distributions as those who stay. (2) It provides a single model to perform the analysis which allows us to avoid multiple testing which can result in statistical bias (Agresti and Finley, 1979; Hinkle et al., 1988; Shaffer, 1995; Millis, 2003). (3) It can be used to identify both whether and when students first connect structure–property relationships. (4) It is a more flexible modeling technique than other types of survival analysis so that the graphical representations of the findings (which we call competency curves) were not forced to a specific shape (for example, exponential (Fig. 1a) versus linear (Fig. 1b)). The complete details of how and why we used this method with the IILSI data have been reported previously (Underwood et al., 2015).
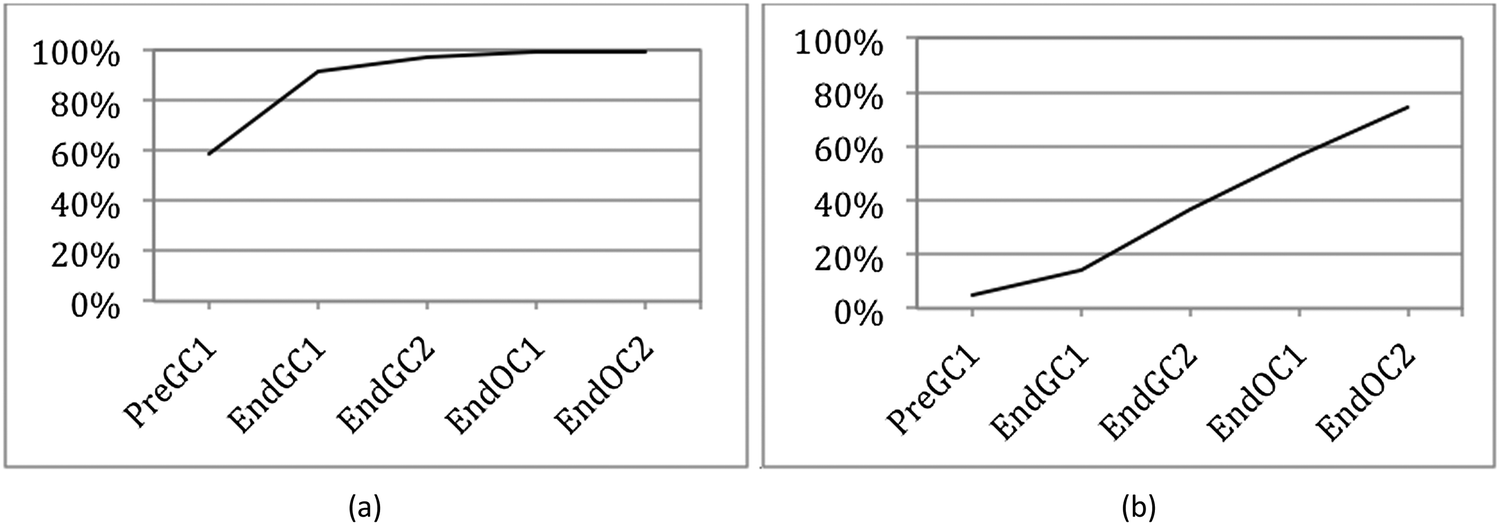 | ||
| Fig. 1 Competency curve for IILSI items (a) number of valence electrons and (b) acidity/basicity. | ||
We used student responses from administrations of the IILSI that were collected to generate trajectories, which we call competency curves, for each item on the IILSI (Underwood et al., 2015). An example of a competency curve for the IILSI item number of valence electrons is shown in Fig. 1a. For this item we have an initial probability of 0.59, meaning that approximately 60% of the students would experience the event (i.e. select this item) at the first time point (Pre GC1 – pre-instruction during the first semester of general chemistry). The remaining 40% of students, who did not select this information during the first administration, had a probability of 0.79 for initially selecting this information at the second time point. That is, at End GC1 (i.e. time point two) an additional 30% of the total starting population of students had now selected this information. Therefore, the combined probabilities for the first two time points, shown in Fig. 1a, is 90%.
The positive slope of the competency curve indicates, just as we expect, that with additional instruction, there is an increase in the number of students who indicate that they recognize that valence electrons can be determined from a Lewis structure. What is not predictable, however, is the shape of the competency curve. For example, the acidity/basicity trajectory in Fig. 1b is approximately linear while the number of electrons trajectory is approximately exponential. As shown in Fig. 1b there are very few students who indicate that acidity or basicity can be predicted from a Lewis structure at the beginning of college level general chemistry. After learning about acid–base reactions during the second semester of general chemistry (change from time point two to three), there is a small increase in the percentage of students who choose this item on the IILSI. As students move through organic chemistry (time point three to four and time point four to five), a greater percentage of students have indicated that they recognize there is a connection between structure and acid/base properties. In our earlier studies we found that the shape of the curve was either exponential or linear. The exponential curves were typically associated with structural features that could be determined from a Lewis structure, and the linear trajectories were typically associated with physical or chemical properties. In general, it took much longer to associate properties with structure.
A transformed curriculum: chemistry, life, the universe and everything
While understanding how students develop knowledge and expertise is important, it is even more essential to incorporate this understanding back into our teaching and learning activities. Much of what we have learned, both from prior research studies, and our ongoing studies has been (and is still being) incorporated into a new general chemistry curriculum: Chemistry, Life, the Universe and Everything (CLUE). We have previously discussed how CLUE was originally built around interconnected core ideas of molecular level structure, macroscopic properties, and energy and forces (Cooper and Klymkowsky, 2013). These core ideas are developed over time to help students make explicit connections among them and develop a coherent understanding. In our studies on the outcomes of CLUE we have compared matched cohorts of CLUE and traditional students and have shown that CLUE students were significantly better than their peers at (1) constructing Lewis structures (Cooper et al., 2012b), (2) recognizing that Lewis structures can be used to predict properties (Cooper et al., 2012b), and (3) representing intermolecular forces as an interaction between molecules (rather than within) (Williams et al., 2015), an essential step in understanding how a molecular structure affects the macroscopic properties of the compound (Cooper et al., 2015).While we have previously reported that CLUE students are more likely to report that Lewis structures can be used to predict properties compared to their peers from a traditional class, these earlier studies were cross-sectional in nature. In this longitudinal study we use discrete-time survival analysis to investigate how student understanding about structure–property relationships evolves over time for both CLUE and traditional students.
Research questions
(1) How does student recognition of the connections between structure and properties evolve during the first two years of college chemistry courses?(2) In what ways does an alternative general chemistry curriculum impact student recognition of the connections between structure and properties during their first two-years of college chemistry courses?
Methods
Participants
The quasi-experimental study presented in this paper focuses on two separate cohorts of two equivalent groups of students enrolled in introductory college level chemistry courses (a four semester sequence of general chemistry and organic chemistry courses) at a medium sized southeastern research university in the United States. The CLUE groups consist of students who were enrolled in the CLUE curriculum for general chemistry and a traditional curriculum for organic chemistry (CLUE Cohort 1: N = 88 and CLUE Cohort 2: N = 177). These students were taught by three different instructors for CLUE, and were then enrolled in the same organic chemistry classes as the traditional students. The traditional groups consist of a purposefully selected matched control group of students from the population of approximately 1400 students who were enrolled each Fall in the traditional chemistry curriculum (Traditional Cohort 1: N = 125, Traditional Cohort 2: N = 111). An additional cohort of students for each group, Cohort 2, was investigated for replication purposes.The traditional general chemistry course at the institution where this study was performed used commercially available curriculum materials including a textbook (McMurry and Fay, 2014) and an online homework system (Mastering Chemistry, 2013); teaching methods such as the use of clickers and in-class group quizzes were also used. We verified that there was no initial significant difference between the matched CLUE and traditional students by comparing several pre-instructional measures such as SAT composite scores and pre-instruction IILSI results. A complete list of the comparison measures and results for both cohorts can be found in Appendix 1.
Study design
The IILSI was administered five times to both cohorts throughout two years of general and organic chemistry courses (Fig. 2). The time points were: (1) pre-instruction in first semester general chemistry (Pre GC1), (2) end of first semester general chemistry (End GC1), (3) end of second semester general chemistry (End GC2), (4) end of first semester organic chemistry (End OC1), and (5) end of second semester organic chemistry (End OC2). It should be noted that the Pre GC1 administration of the IILSI for Cohort 2 was somewhat delayed due to external constraints; meaning it was collected during the time that students were learning about how to draw Lewis structures. This delay in the data collection does not influence the results presented here, since the percentage of students who select the items related to properties during the first semester (e.g. acidity/basicity in Fig. 1b) are statistically equivalent (see Appendix 1, Table 10).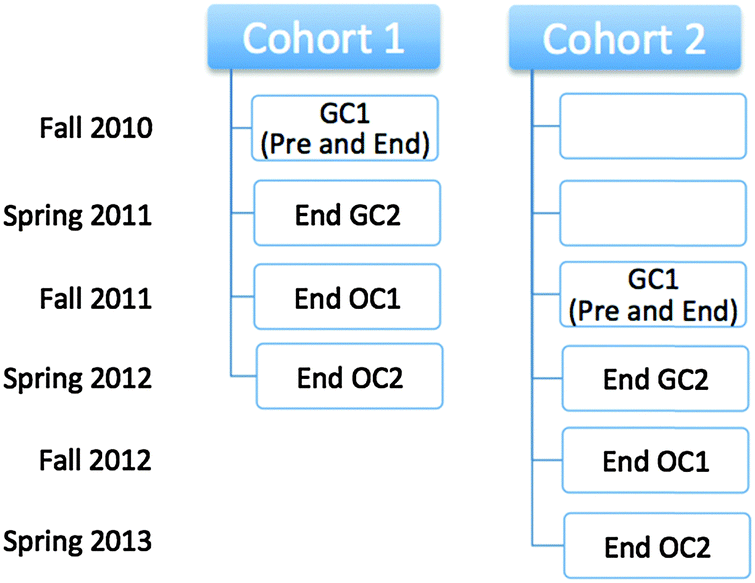 | ||
| Fig. 2 Data collection times for the two cohorts of students. | ||
While we recognize that there is an inherent conflict of interest in assessing the effects of this curriculum transformation, we attempted to minimize the connection between the data collection and the lecture course. All administrations of the IILSI for this study were conducted in the students' laboratory sections. The instructors for the lecture courses were not involved in the collection of the data and the students enrolled in both curricula were intermixed within the same laboratory sections and treated equally during the administration process. The students received participation credit towards their laboratory grade for completing the IILSI. Each administration was conducted using an online software platform: either SurveyMonkey for Cohort 1 or beSocratic (Bryfczynski, 2012; Cooper et al., 2014) for Cohort 2. The IILSI typically takes about five minutes to complete.
Only students who began their chemistry courses in the first semester of general chemistry at this university were included in this study. That is, transfer students or students with Advanced Placement course exemption credit were not included for two reasons. (1) We wanted to monitor the trajectories of students over time and study their changes as students advance through the chemistry course sequence and (2) we were interested in how the two curricula impacted student responses. All students involved in this study signed informed consent forms. Participants were given unique identifiers known only to the authors so that student responses could be tracked over time.
Analysis
As previously discussed discrete-time survival analysis was used to identify whether and when students first identify the connection between a Lewis structure and a particular property. Student submissions for the five administrations were collated using the unique identifier assigned to each student. SPSS 21 was used to prepare the data file for performing discrete-time survival analysis (see Singer and Willett (1993) for how to transform a person-oriented dataset format into a person-period dataset format). Once the dataset was in the proper format, it was transferred into SAS 9.3 to run the SurveyLogistic procedure (S.A.S. Institute, 2012). This method uses a single statistical model that includes a time variable, cohort variable, group variable, and the interactions among the three variables ((1) time and group, (2) time and cohort and (3) time, group and cohort). The time variable was coded to capture the change between two time points (e.g. End OC1 to End OC2 represents time 4–5). The two cohorts of students were represented by the cohort variable (Cohort = 1 or 2) and the group variable was coded as either Group = 0 for students enrolled in a traditional curriculum or Group = 1 for students who were part of the CLUE curriculum. We have previously reported a detailed procedure on how to prepare the IILSI data and interpret the results when performing discrete-time survival analysis (Underwood et al., 2015).Results and discussion
Research question 1: how does student recognition of the connection between structure and properties evolve during the first two years of college chemistry courses?
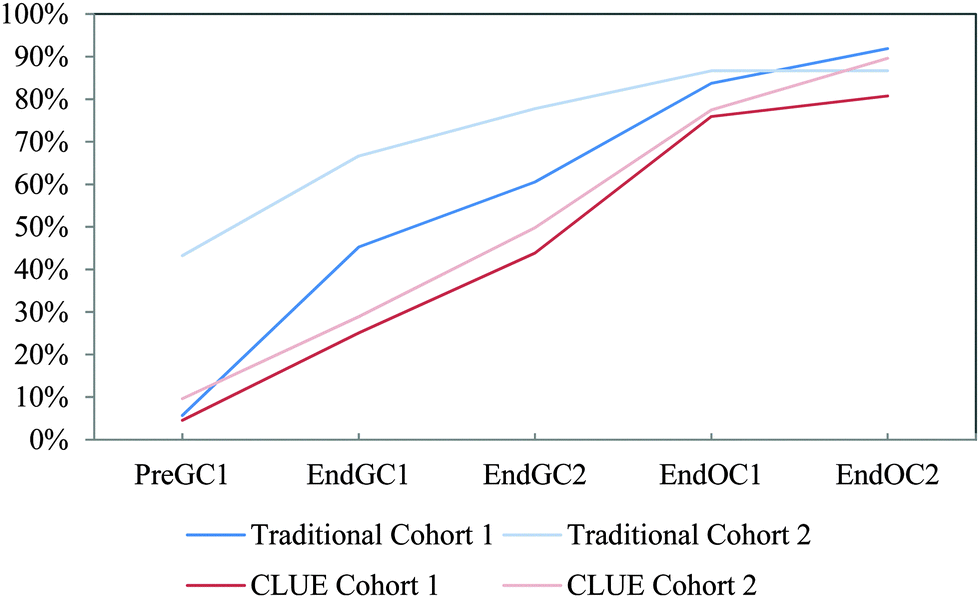
Before we can compare how the CLUE curriculum impacts student understanding, we must further analyze how students enrolled in a traditional curriculum develop these ideas over time. We have previously shown that the majority of students report that structural information (such as number of valence electrons and type of bond(s)) can be determined from a structure by the end of the first semester of general chemistry (Underwood et al., 2015). Therefore, in this paper we focus on the macroscopic properties that can be predicted from a structure (relative boiling point, relative melting point, physical properties, acidity/basicity, and reactivity), particularly since our previous research shows that this information is more difficult for students to connect (Cooper et al., 2012a, 2012b; Underwood et al., 2015). Using the trajectories for these five IILSI items (Fig. 3), we first investigated how representative our subsample of students (i.e. traditional control group) was compared to the original population of students (i.e. traditional population) previously published (Underwood et al., 2015).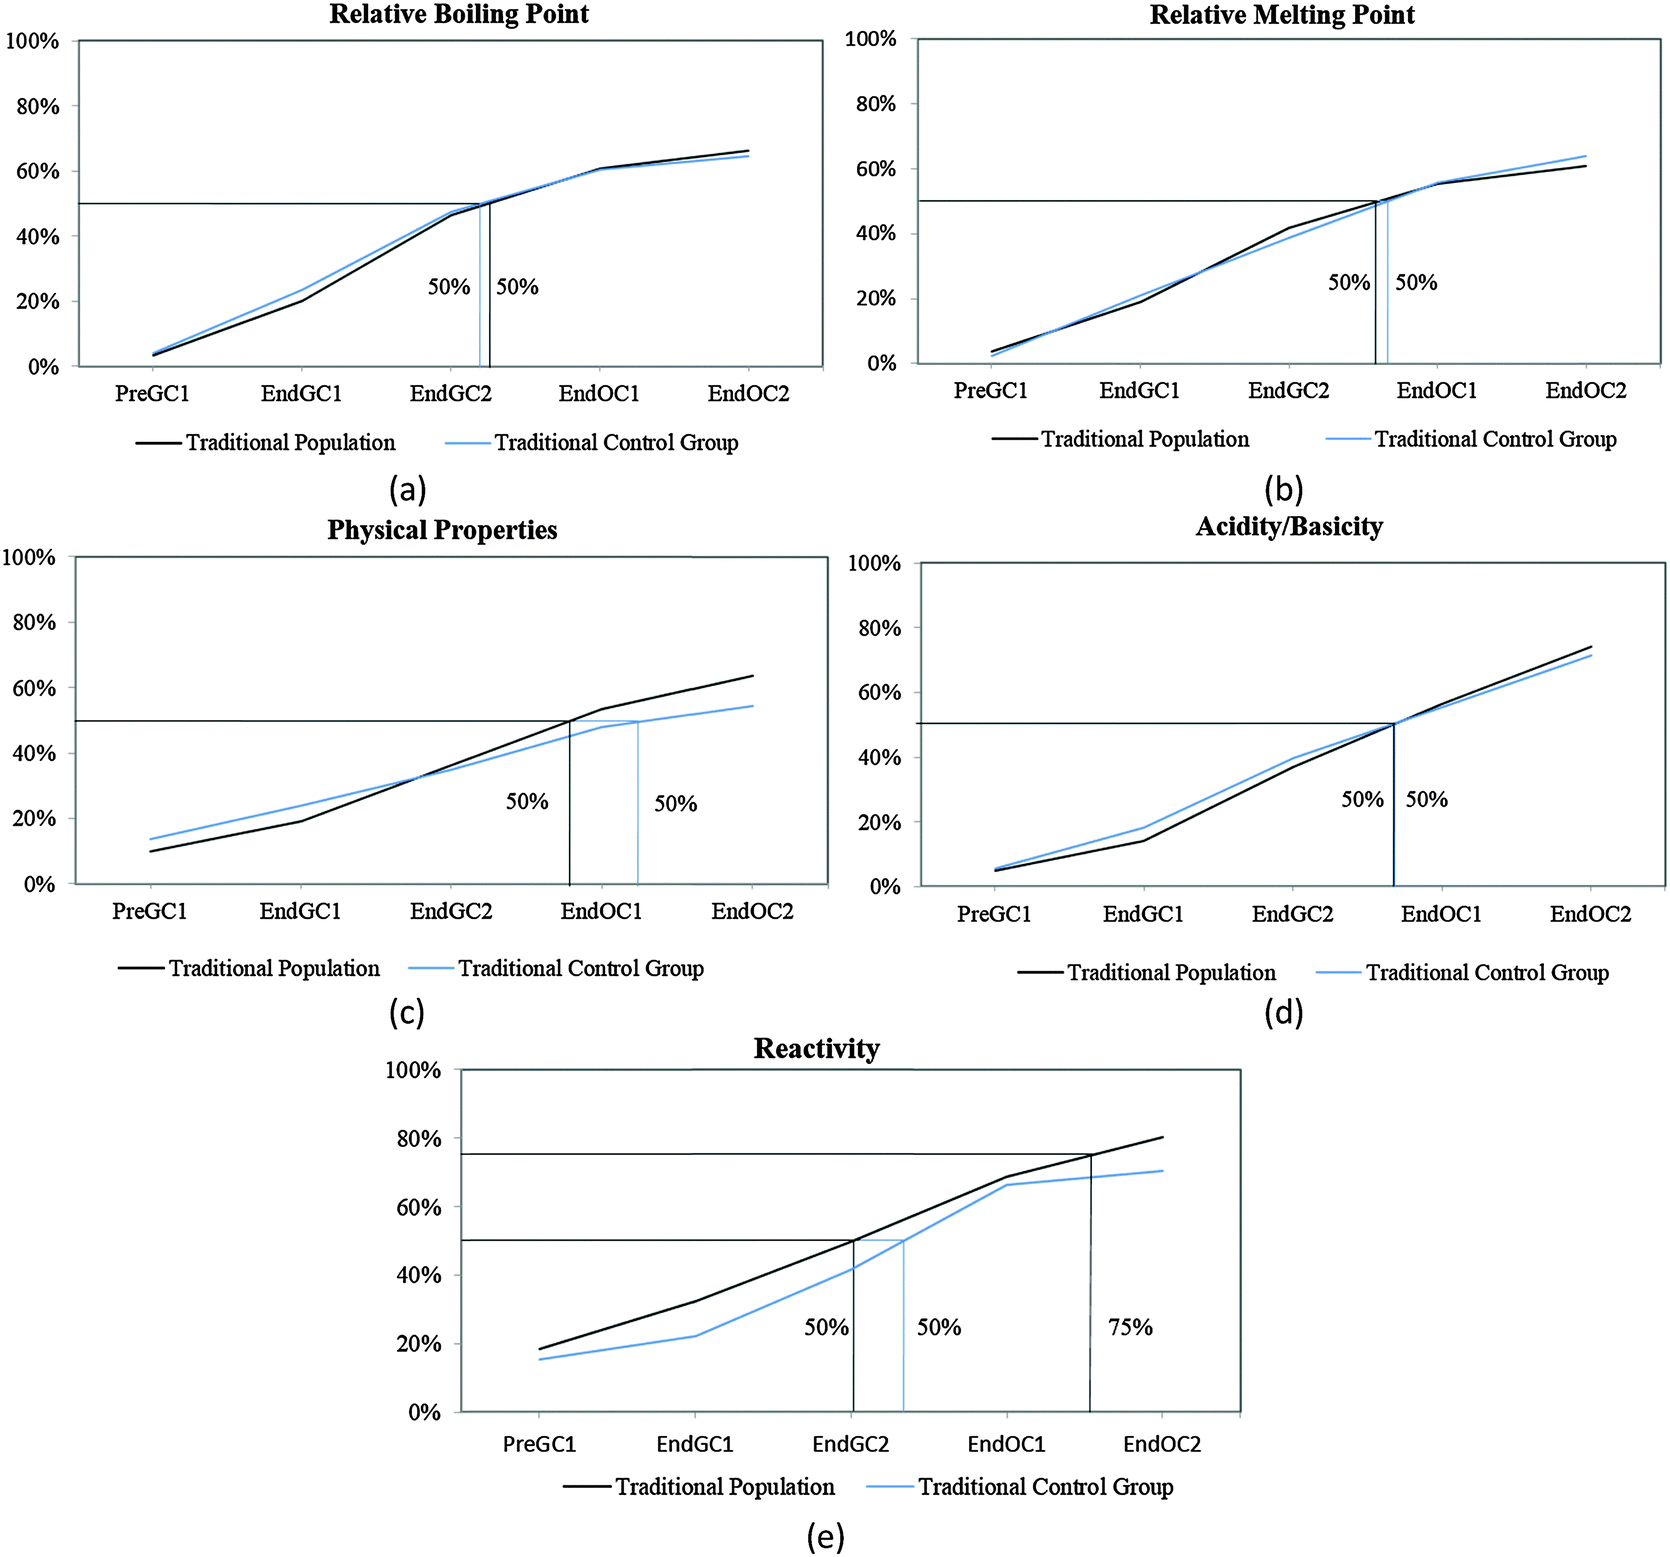 | ||
| Fig. 3 Competency curves for Cohort 1 students (population and control group) enrolled in a traditional curriculum. | ||
It is common for analyses that use survival analysis to report the time period when 50% of the population has experienced the event, that is, the time it takes for half of the population to experience the event. Here we also report the time period when 75% (i.e. the next quartile) of students have predicted the particular property, since we are investigating student learning and ideally want more than half the students to grasp an idea. Using these two thresholds the competency curves for the original population of students and the subsample of students enrolled in the traditional curriculum (the control group) for Cohort 1 students produced similar trends (Fig. 3). As we have previously shown (Underwood et al., 2015), and reconfirmed here with our traditional control group, the competency curves for the five items (relative boiling point, relative melting point, physical properties, acidity/basicity, and reactivity) are essentially linear. As might be expected, more students make these connections with each additional semester; however, it is not until students are enrolled in the first-semester of organic chemistry (End OC1) that 50% of them have reported they can use the structure to predict these five properties (Fig. 3).
While the curves for these five items all continue on an upward trajectory, only reactivity and acidity/basicity (Fig. 3d and e) near the 75% threshold by the end the study (End OC2) for Cohort 1 students. Only about 60% of Cohort 1 students have chosen the physical property items (relative boiling point, relative melting point, and physical properties – Fig. 3a–c) by the end of the study. Even though there are small differences between trajectories of the control group and the traditional population for Cohort 1 students, overall the two groups of students produce similar trends; meaning that the subsample of traditional students were a representative sample of the population. The trajectories for these five properties suggest that after two years of introductory chemistry courses many of the students in our study who were enrolled in this traditional curriculum left without ever recognizing that a structure can be used as a model to predict chemical/physical properties. That is, about 30% of students never selected chemical properties and about 40% of students never selected physical properties by the end of the study. The slight difference between these two groups (population and subsample) may perhaps be ascribed to the emphasis on chemical reactivity in organic chemistry resulting in a higher proportion of students eventually indicating that chemical properties can be predicted using structural features. It is important to note that the majority of students in this study do not complete two years of introductory chemistry courses; in fact only about 10% of our original sample completed all four semesters of introductory chemistry courses at the institution of interest. This suggests that when the majority of the students leave after a year of general chemistry, over half of the population have not recognized that structures can be used to predict properties. These findings were replicated with the additional cohort of students shown in Table 1 (for additional competency curves for this comparison see Appendix 2 Fig. 6).
| IILSI item | Group | Population | Subsample | ||
|---|---|---|---|---|---|
| Time point for 50% threshold | Time point for 75% threshold | Time point for 50% threshold | Time point for 75% threshold | ||
| Relative boiling point | 1 | End OC1 | — | End OC1 | — |
| 2 | End GC2 | — | End OC1 | End OC2 | |
| Relative melting point | 1 | End OC1 | — | End OC1 | — |
| 2 | End OC1 | — | End OC1 | — | |
| Physical properties | 1 | End OC1 | — | End OC2 | — |
| 2 | End OC1 | — | End OC1 | — | |
| Acidity/basicity | 1 | End OC1 | — | End OC1 | — |
| 2 | End OC1 | End OC2 | End OC1 | End OC2 | |
| Reactivity | 1 | End GC2 | End OC2 | End OC1 | — |
| 2 | End GC2 | End OC2 | End OC1 | End OC2 | |
Research question 2: in what ways does an alternative general chemistry curriculum impact student recognition of the connections between structure and properties during their first two-years of college chemistry courses?
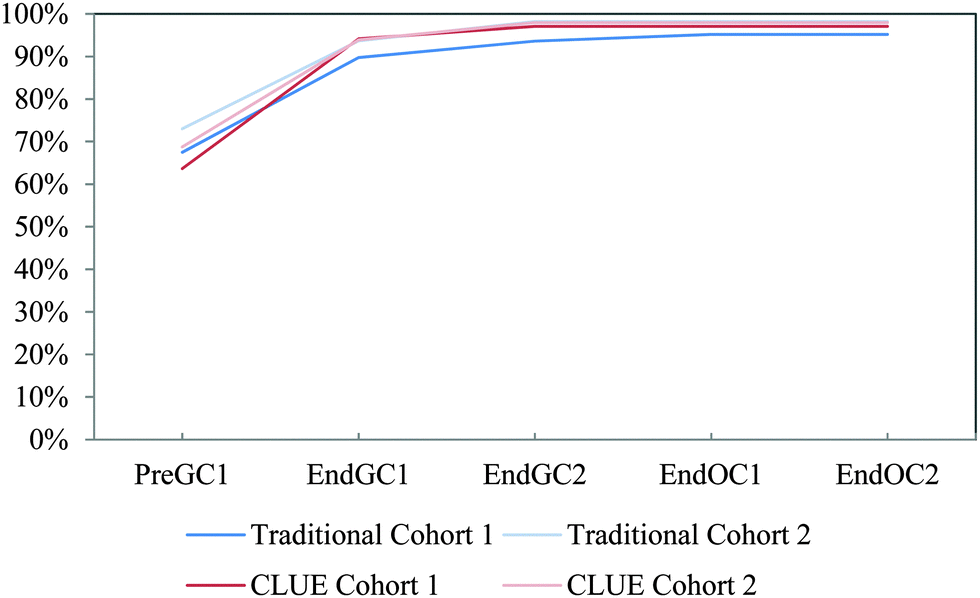
We compared CLUE and the subsample of traditional student (referred to as traditional) responses to the IILSI over the same two-year time period to identify how the CLUE curriculum impacts whether and when students begin to connect structure–property relationships. Two main findings emerged: (1) students enrolled in the CLUE curriculum connect structure and properties earlier than students from the traditional curriculum during the four-semester sequence and (2) differences between students from the two curricula remain even after four semesters.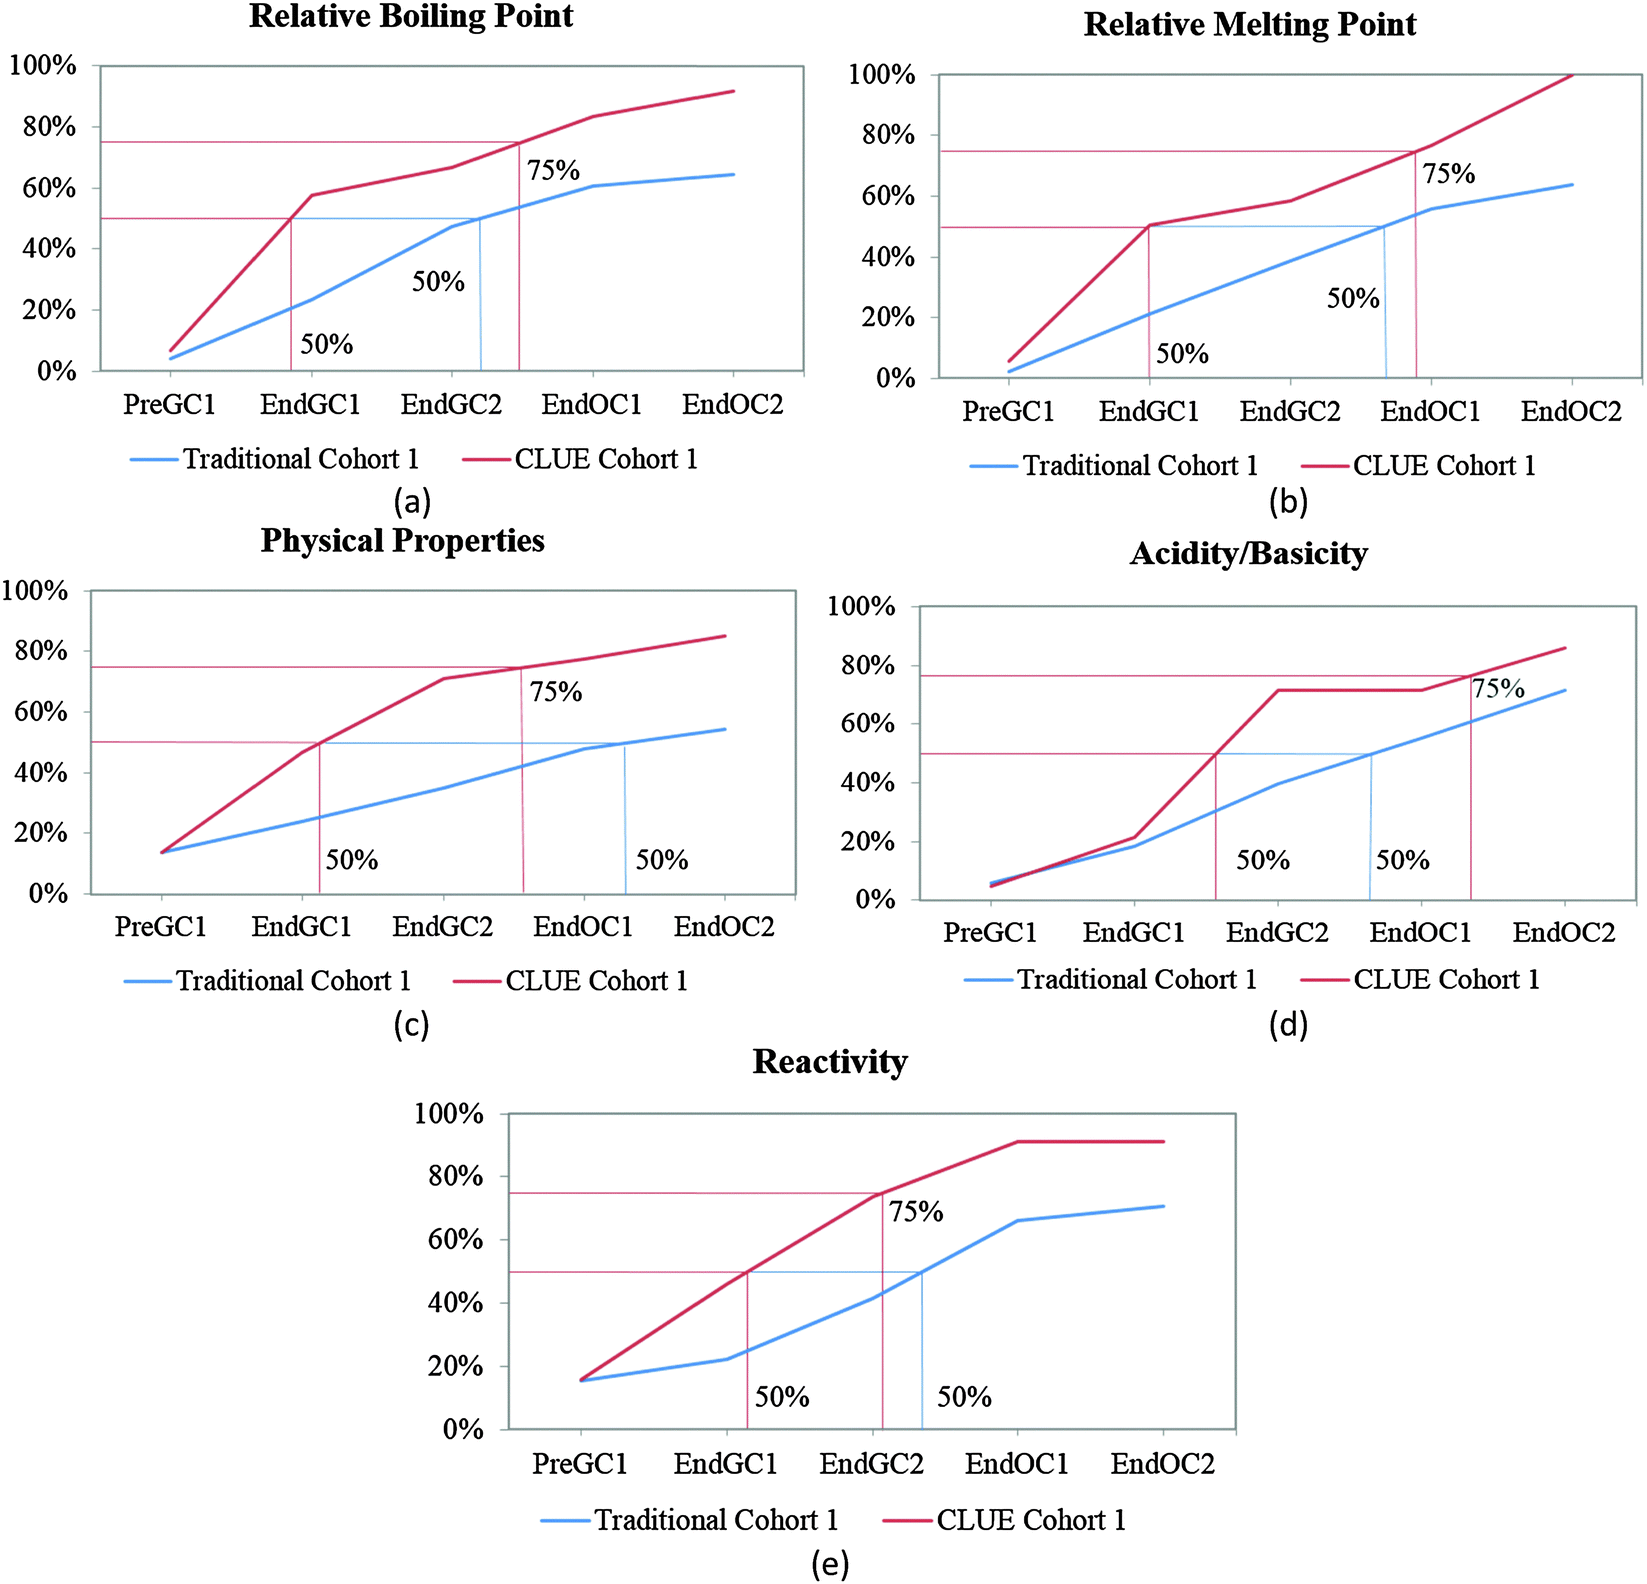 | ||
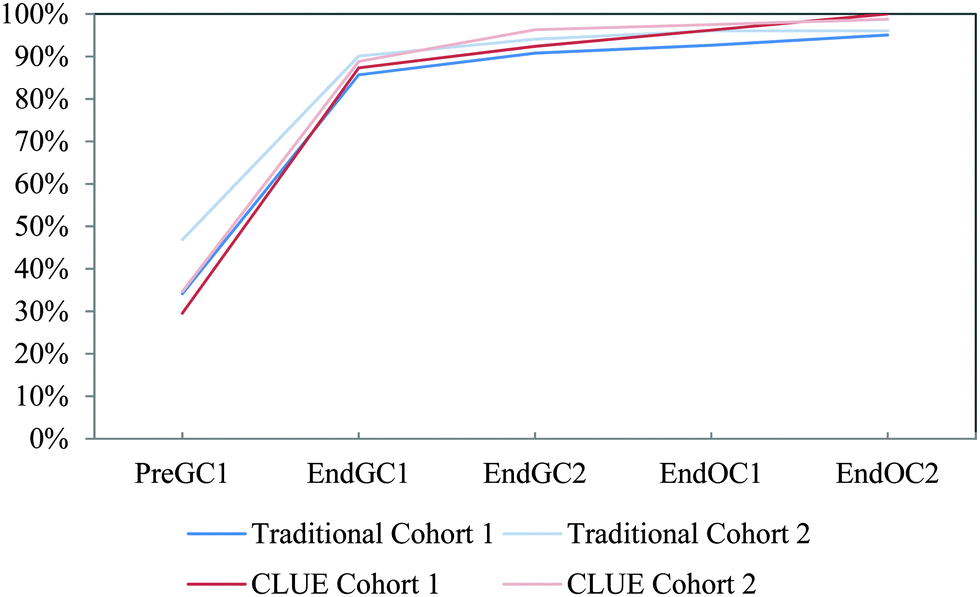
| Fig. 4 Competency curves comparing Cohort 1 CLUE and traditional control groups. | ||
It is interesting to note that the shapes of the trajectories are different for CLUE and traditional students. As previously discussed, the trajectories for traditional students are linear, but the CLUE trajectories typically rise much more steeply over the first two semesters and then change slope over the organic chemistry semesters. That is, the “CLUE effect” is seen during the time that students are enrolled in the class, and then subsequently there is little difference in the trajectories of the CLUE and traditional students. This finding is similar to the results of our investigations on the ways that students represent intermolecular forces; that is, there were large significant differences between CLUE and traditional students at the end of the second semester of general chemistry, but then little subsequent change (Williams et al., 2015).
We attribute the difference observed between the two groups to the different ways that students learn about structure–property relationships in the two curricula. For example, although both curricula at the institution cover the topic of acid–base chemistry in some depth during the second semester of general chemistry the approach differs. In the CLUE curriculum, acid–base chemistry underlies a great deal of the discussion of chemical reactivity, equilibrium, reaction rates and mechanisms, which are also a traditional part of the second semester general chemistry curriculum. By using acid–base chemistry as the focus and the examples for each of these topics, the connections between the concepts are emphasized. In the traditional curriculum, each topic is treated separately (and indeed is sometimes taught in a different sequence); using different chemical examples and emphasis is placed on calculations, and procedures, rather than the causal mechanisms, reasoning, and the underlying chemistry. Indeed in many general chemistry texts acid–base equilibrium merits its own chapter, and may be seen by students as a separate topic not only from equilibrium itself, but also from the prior acid–base chemistry that they have been taught.
Physical properties are another example of curricular differences. While both curricula address the idea that the molecular level structure of a compound can be used to predict properties such as melting or boiling points in the first semester, and reinforce it during the second semester, the context of the topics differs. The traditional curriculum often separates the idea of structure and properties into distinct chapters (the chapter on Lewis structures sometimes is separated by several chapters from physical properties – where the discussion of intermolecular forces and boiling/melting point occurs (e.g.McMurry and Fay, 2014)). In the CLUE curriculum students begin the first semester of general chemistry by learning about why atoms and molecules stick together by London dispersion forces. This discussion is continued throughout both semesters of general chemistry by introducing more complex species, and more complex interactions in the form of a learning progression (e.g.Corcoran et al., 2009; Krajcik et al., 2012; Cooper et al., 2012b; Sevian and Talanquer, 2014) to include a discussion about the energy needed to overcome the attractive forces between molecules (i.e. intermolecular forces) and how the strength of interactions between molecules influences other topics such as solubility and reactivity.
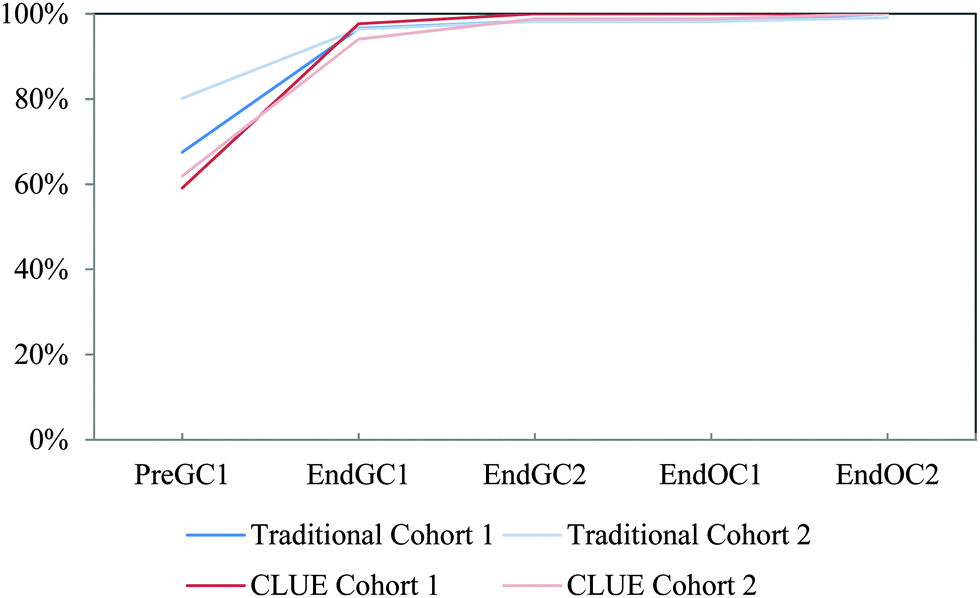
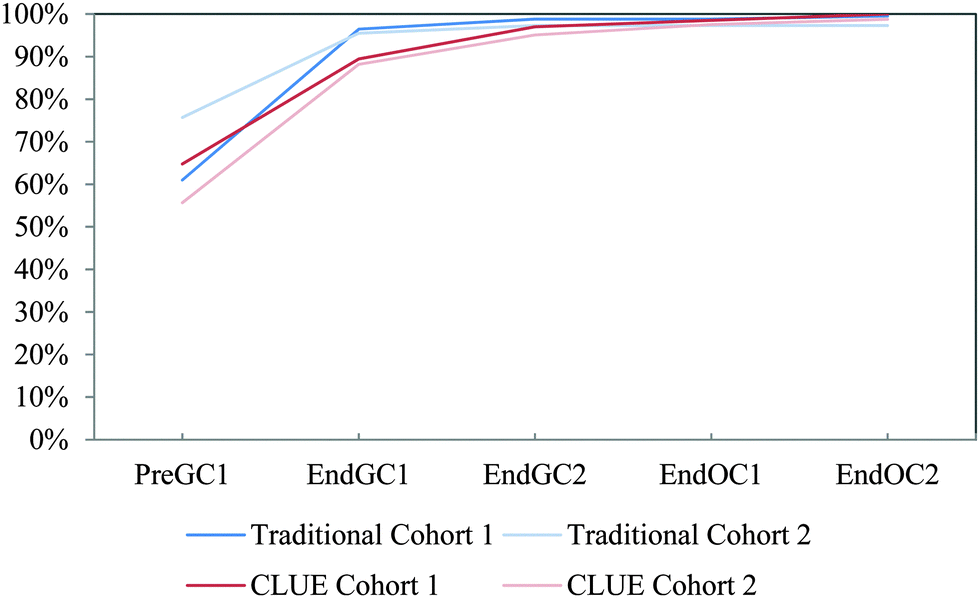
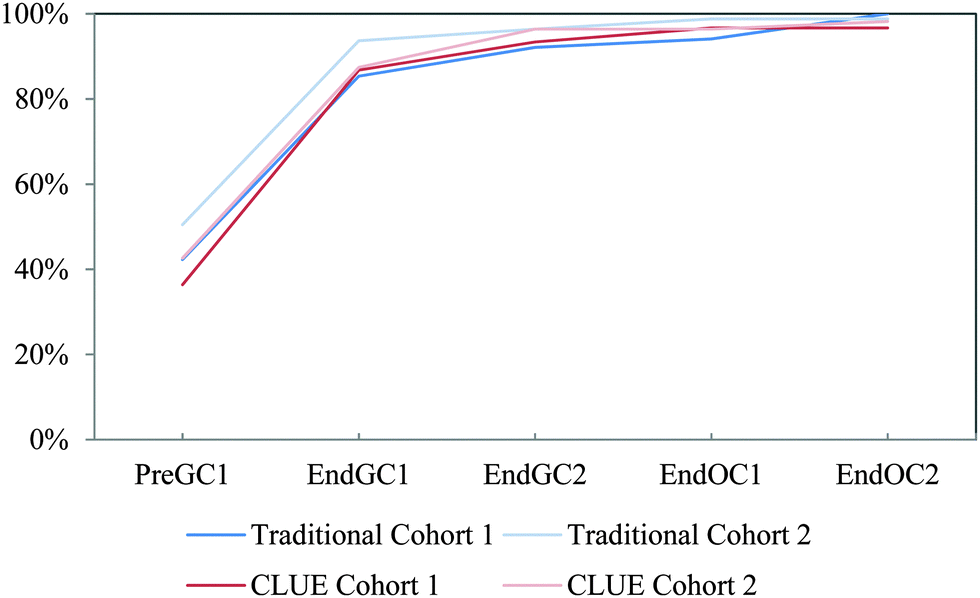
Cohort 2 students were also compared to the Cohort 1 students to determine the reproducibility of the effects of the CLUE curriculum as shown in Fig. 5. In general the results are very similar, in that the CLUE students achieve and maintain their improvement over the traditional students for both cohorts one and two, and are typically one to two semesters ahead of their traditional peers. The exception to this is reactivity (Fig. 5e), which produced the most noticeable difference between the two cohorts of students. While we are not sure of the reason for this, our findings support the need to reassess curricular effects regularly to determine whether effects are reproduced (Fig. 5 and Table 2). The competency curves for the other 11 IILSI items for both cohorts of CLUE and traditional groups are shown in Appendix 3 Fig. 7–17.
 | ||
| Fig. 5 Competency curves comparing Cohorts 1 and 2 students enrolled in the CLUE and traditional curricula. | ||
| IILSI item | Cohort | Traditional | CLUE | ||
|---|---|---|---|---|---|
| Time point for 50% threshold | Time point for 75% threshold | Time point for 50% threshold | Time point for 75% threshold | ||
| Relative boiling point | 1 | End OC1 | — | End GC1 | End OC1 |
| 2 | End OC1 | End OC2 | End GC1 | End OC1 | |
| Relative melting point | 1 | End OC1 | — | End GC1 | End OC1 |
| 2 | End OC1 | — | End GC2 | End OC2 | |
| Physical properties | 1 | End OC2 | — | End GC2 | End OC1 |
| 2 | End OC1 | — | End GC2 | End OC1 | |
| Acidity/basicity | 1 | End OC1 | — | End GC2 | End OC2 |
| 2 | End OC1 | End OC2 | End GC2 | End OC1 | |
| Reactivity | 1 | End OC1 | — | End GC2 | End OC1 |
| 2 | End OC1 | End OC2 | End GC2 | End OC2 | |
A chi-squared analysis was used to show that after four semesters of chemistry, the percent of CLUE students in Cohort 1 who have reported a connection between structure and properties is significantly different than traditional students (Table 3). For example, at the end of four semesters of chemistry about 15% of the students in the CLUE curriculum have never reported using a chemical structure to predict physical properties compared to almost 40% of the students for the matched control group. The differences found between the two curricula range from small to medium effect sizes based on Cohen's recommendations (0.1 is small, 0.3 is medium, and 0.5 is large) (Cohen, 1988).
| IILSI item | Time point | Traditional (N = 123) (%) | CLUE (N = 88) (%) | X 2 | p-Value | Effect size (ϕ) |
|---|---|---|---|---|---|---|
| Relative boiling point | End GC2 | 47 | 67 | 7.43 | 0.006 | 0.19 |
| End OC2 | 65 | 92 | 20.17 | <0.001 | 0.31 | |
| Relative melting point | End GC2 | 39 | 58 | 6.64 | 0.01 | 0.18 |
| End OC2 | 64 | 100 | 37.64 | <0.001 | 0.42 | |
| Physical properties | End GC2 | 35 | 71 | 24.45 | <0.001 | 0.34 |
| End OC2 | 54 | 85 | 20.67 | <0.001 | 0.31 | |
| Acidity/basicity | End GC2 | 40 | 72 | 19.51 | <0.001 | 0.30 |
| End OC2 | 72 | 86 | 5.68 | 0.017 | 0.16 | |
| Reactivity | End GC2 | 42 | 74 | 20.47 | <0.001 | 0.31 |
| End OC2 | 71 | 91 | 11.46 | 0.001 | 0.23 |
A similar analysis of Cohort 2 further supports our initial findings of significant differences between the ways that CLUE and traditional groups respond to the IILSI. There were, however, some differences between Cohorts 1 and 2 CLUE students' responses as shown in Table 4 (although it should be noted that these students are not matched by factors such as major, sex or pre-instruction assessment measures). We found that at the end points for each year (End GC2 and End OC2), the there were no significant differences between CLUE students in Cohorts 1 and 2 responses (Table 4), for all except four time points, using a chi-squared analysis. It should be noted that three out of these four times points are differences after a year of organic chemistry rather than the CLUE general chemistry curriculum. Overall, we believe that the replication study supports our contention that the CLUE curriculum is causing differences in the ways that student understand structure property relationships.
| IILSI item | Time point | CLUE Cohort 1 (N = 88) (%) | CLUE Cohort 2 (N = 176) (%) | X 2 | p-Value | Effect size (ϕ) |
|---|---|---|---|---|---|---|
| Relative boiling point | End GC2 | 67 | 69 | 0.02 | 0.89 | |
| End OC2 | 92 | 79 | 6.30 | 0.01 | 0.15 | |
| Relative melting point | End GC2 | 58 | 65 | 1.07 | 0.30 | |
| End OC2 | 100 | 77 | 21.84 | <0.001 | 0.29 | |
| Physical properties | End GC2 | 71 | 61 | 1.74 | 0.19 | |
| End OC2 | 85 | 85 | 0.00 | 1.00 | ||
| Acidity/basicity | End GC2 | 72 | 68 | 0.27 | 0.61 | |
| End OC2 | 86 | 91 | 1.16 | 0.28 | ||
| Reactivity | End GC2 | 74 | 56 | 7.46 | 0.01 | 0.17 |
| End OC2 | 91 | 80 | 4.25 | 0.04 | 0.13 |
Conclusions
We have previously shown that after a semester of instruction students are aware that structural information is encoded within a Lewis structure; however, recognition that a structure can be used to predict chemical and physical properties typically takes a much longer period of time (Underwood et al., 2015). That is, using structures as models to predict and explain properties is much more difficult to learn than using them as representations. In this paper, we used thresholds to indicate when 50% and 75% of the students reported awareness that a chemical structure can be used to predict chemical and physical properties. We found that for students in a traditional chemistry curriculum the 50% threshold occurred during the first semester of organic chemistry. In contrast, a greater proportion of students in the CLUE curriculum tend to make the structure–property connection earlier, and this advantage is maintained throughout the two semesters of organic chemistry. The time point when 50% of the students recognize the connection between structure and properties is at least one semester earlier for CLUE students compared to the matched control group. Indeed it takes the control group an additional year of organic chemistry to reach the same level as the CLUE students after a year of general chemistry.Since we know that the majority of students enrolled in general chemistry will not continue on to take organic chemistry, for students in traditionally structured courses this means that 60% of students leave chemistry without recognizing Lewis structures as models that can be used to predict and explain phenomena. For students in the CLUE curriculum about 35% of students have not made this connection. Furthermore, if students in organic chemistry do not begin the course with a sound grasp of structure–property relationships, it is hardly surprising if they resort to memorization for the majority of the course.
Implications for teaching and further research
There are a number of implications for teaching from this work.(1) Changing the structure of the curriculum and concomitant activities and assessments can dramatically change trajectory of student competence over time. Clearly it is advisable that students learn and use the core idea that structure and properties are related as early as possible. In the CLUE curriculum this concept is one of the major ideas that is returned to throughout the curriculum, and as we have shown here and elsewhere (Cooper et al., 2012b; Williams et al., 2015) students from this curriculum consistently exhibit more understanding of the ways that structure and properties are related. However, it is possible that some institutions are not ready or able to completely redesign their general chemistry curriculum. The question is, what changes can be implemented within a more traditional sequence and set of assessments?
We suggest that instructors make every effort to reinforce structure–property relationships as often as possible. Beginning in the first semester, students should learn that Lewis structures are cartoons of three-dimensional structures that allow a great deal of information to be encoded within them. Using chemical structures to predict properties requires the concatenation of several skills or facts, that is, going from two-dimensional to three-dimensional, determining shape, polarity and types of intermolecular forces. If students are tested on these individual steps but not on the overall concept it is unlikely that they will make the connection between structure and properties themselves. In the second semester, where the topics traditionally emphasized are equilibrium, kinetics and thermodynamics, it is easy for students to lose the idea that underlying all the calculations is a chemical system, the behavior of which can be predicted and explained. For example, while much of a traditional kinetics chapter might be given to determining rate laws for increasingly esoteric reactions, it might be more productive to use that data to discuss why Brønsted acid–base reactions are typically fast compared to reactions that involve carbon–carbon bond breaking. Using acid–base reactions as the chemical system on which to “hang” the other concepts allows students to see how these concepts are connected. If each concept is introduced using complex reactions that students are unfamiliar with, it is difficult for them to connect their knowledge and build a more expert-like coherent framework.
In addition, CLUE students routinely perform homework and in-class activities where they must construct models, explanations and arguments, using beSocratic – a formative assessment system that allows for student free-form input (Bryfczynski, 2012; Cooper et al., 2014). We believe that requiring students to construct responses rather than simply recognizing answers is also crucial to the development of coherent understanding. Students who are asked to explain why a phenomenon occurs, and to support that explanation with evidence and reasoning are more likely to make connections among the ideas they are learning. Students who are assessed entirely by multiple-choice items that focus on pieces of knowledge have less chance to practice these skills.
(2) Most of the students in this study, and those in our earlier studies have been successful in their chemistry courses. Indeed students who emerge from a traditional general chemistry course can be successful in organic chemistry, despite not understanding a central idea of chemistry. Perhaps it is time to develop more targeted and nuanced assessments that can probe important ideas and connections, and to provide evidence that students do actually make these connections.
In theory the ideas that are probed with the IILSI are “covered” in general chemistry, yet we now know that many students leave this course without recognizing this connection. If these students move on to a traditional organic chemistry course sequence most faculty assume that students have mastered these basics, and while the course may begin with a brief review, it clearly is not enough for many students. While the proportion of students who self-report that they can determine structure–property relationships does seem to improve through organic chemistry, there are a significant number of students who never learn this skill.
Our findings here, coupled with our earlier work, indicate that as instructors we must think carefully about the structure of the curriculum and the kinds of learning activities that students are asked to perform. That is, we must consider what information is presented to the students and how that information is organized. We believe that our findings indicate that students who learn in an environment where the structure–property relationship is explicitly developed in a scaffolded learning progression have a better grasp of the subject.
Study limitations
The studies here were performed at one university, and although they are replicated, they do not necessarily reflect how students at other institutions may answer the IILSI. However, the students in this study on average score around the 75th percentile on the ACS general chemistry examination. We have also gathered student responses to the IILSI from a wider range of institutions, and that work will be reported in a later publication. However, we have no reason to believe that the traditional students' performance is anomalous.As noted earlier, the IILSI is a student self-report; it does not reveal whether students are actually able to (for example) correctly predict the relative boiling points for a set of compounds, or predict how an acid might react. However, we believe that students must first become aware that a Lewis structure can be used as a model for it to become a meaningful tool to predict properties. The findings we present here are an important first step; however, evidence that students can actually perform these tasks must also be collected. In fact, in other work we have shown that while both CLUE and control groups indicate similarly that intermolecular forces can be predicted from a structure by the end of general chemistry [X2 (1, N = 141) = 3.83, p = 0.05] (Cooper et al., 2012b), there is a significant difference between their understanding of where intermolecular forces are actually located (Williams et al., 2015). The majority of CLUE students draw representations of intermolecular forces as an interaction between molecules, while a majority of traditional students draw representations showing IMFs as forces operating within a molecule. In our current work, we are collecting student-constructed responses to assessment items to investigate how their responses on the IILSI correspond to activities where they must put their knowledge to use.
Appendix 1: pre-instruction comparisons for both cohorts of students
Several pre-instruction assessment measures as well as student demographic information were compared between the CLUE and traditional groups for this quasi-experimental longitudinal study for each cohort (Tables 5–10). The demographic information (sex and common majors) for students in each group for Cohorts 1 and 2 are shown in Tables 5 and 8. It should be noted that when the CLUE curriculum was offered for the first time (Cohort 1), primarily biology focused majors who enrolled. The second cohort of students, however, included additional majors. The pre-instruction assessment measures that were examined vary between the two cohorts of students. For Cohort 1 students the various measures included in Table 6 are: SAT composite scores (or ACT equivalency), Test of Logical Thinking (TOLT) (Tobin and Capie, 1981), both subscales of the shortened version of the Attitude towards the Subject of Chemistry Inventory (ASCIv2) (Bauer, 2008; Brandriet et al., 2011) and the Self-Efficacy for Learning and Performance subscale from the Motivated Strategies for Learning Questionnaire (MSLQ) (Pintrich et al., 1991). Table 9 for Cohort 2 students include scores from the SAT (or ACT equivalency), Metacognitive Activities Inventory (MCAI) (Cooper and Sandi-Urena, 2009) and Students' Understanding of Models in Science (SUMS) (Treagust et al., 2002). For both cohorts of students the Implicit Information from Lewis Structures Instrument (IILSI) (Cooper et al., 2012a, 2012b) was additionally used to verify that the two groups of students were similar prior to instruction (Tables 7 and 10).The TOLT measures students' formal reasoning ability and consists of 10 problems where eight are two-tiered multiple-choice questions in nature (i.e. students select an answer followed by selecting their reasoning) followed by two open-ended questions (Tobin and Capie, 1981). The ASCIv2 explores students' attitudes towards their chemistry course and consists of eight 7-point Likert scale questions (four for each subscale – intellectual accessibility and emotional satisfaction) (Bauer, 2008; Brandriet et al., 2011). The self-efficacy for learning and performance subscale from the MSLQ consists of eight 7-point Likert scale items (Pintrich et al., 1991). The MCAI evaluates students' views regarding their problem-solving skills and consists of 27 5-point Likert scale items (Cooper and Sandi-Urena, 2009). Last, the SUMS covers five different ideas about student understanding of models (models as multiple representations (MR), models as exact replicas (ER), models as explanatory tools (ET), the uses of scientific models (USM) and the changing nature of models (CNM)) and consists of 27 5-point Likert scale questions (Treagust et al., 2002).
A chi-square analysis was used to determine difference in proportion of student sex and IILSI pre-instruction (PreGC1) responses, while the non-parametric Mann–Whitney measure was used to evaluate the remaining pre-instruction assessment measures (SAT, TOLT, ASCIv2, MSLQ, MCAI, and SUMS). For each of these comparison measures, the students who completed each of the assessments are included (i.e. pairwise comparisons were conducted to maximize the number of students considered for each analysis measure). However, no differences were found when considering only the students who completed all of the assessments were further examined (i.e. listwise deletion comparisons).
Cohort 1 Fall 2010 – Spring 2012
| Demographics | Traditional (N = 125) | CLUE (N = 88) | p-Value | X 2 |
|---|---|---|---|---|
| Sex | 33% males, 67% females | 41% males, 59% females | 0.29 | 1.14 |
| Common majors | Biological science (52%) | Biological science (63%) | N/A |
| Assessments | Group | N | Median | Mean | p-Value | U | z |
|---|---|---|---|---|---|---|---|
| SAT composite (out of 1600) | Traditional | 114 | 1190 | 1187 | 0.49 | 4184 | −0.69 |
| CLUE | 78 | 1185 | 1172 | ||||
| TOLT (out of 10) | Traditional | 114 | 8 | 8 | 0.58 | 4625 | −0.56 |
| CLUE | 85 | 9 | 8 | ||||
| Intellectual accessibility – ASCIv2 (out of 7) | Traditional | 110 | 3.2 | 3.2 | 0.65 | 4177 | −0.45 |
| CLUE | 79 | 3.2 | 3.1 | ||||
| Emotional satisfaction – ASCIv2 (out of 7) | Traditional | 110 | 4.0 | 3.9 | 0.72 | 4212 | −0.36 |
| CLUE | 79 | 4.0 | 3.9 | ||||
| MSLQ (out of 7) | Traditional | 110 | 5.6 | 5.5 | 0.32 | 3977 | −0.99 |
| CLUE | 79 | 5.9 | 5.6 |
| Pre-instruction IILSI items (PreGC1) | Traditional (N = 116) (%) | CLUE (N = 84) (%) | X 2 | p-Value |
|---|---|---|---|---|
| No information | 3 | 2 | 0.00 | 0.99 |
| Element(s) present | 72 | 67 | 0.34 | 0.56 |
| Number of valence electrons | 65 | 68 | 0.10 | 0.75 |
| Number of bonds between particular atoms | 63 | 67 | 0.16 | 0.69 |
| Type of bond(s) | 72 | 62 | 1.65 | 0.20 |
| Formal charges | 12 | 14 | 0.06 | 0.81 |
| Bond angle | 36 | 31 | 0.39 | 0.53 |
| Geometry/shape | 45 | 38 | 0.65 | 0.42 |
| Potential for resonance | 6 | 5 | 0.01 | 0.94 |
| Hybridization | 9 | 17 | 2.27 | 0.13 |
| Polarity | 41 | 39 | 0.00 | 0.98 |
| Intermolecular forces | 12 | 14 | 0.06 | 0.81 |
| Acidity/basicity | 6 | 5 | 0.01 | 0.94 |
| Reactivity | 16 | 17 | 0.00 | 1.00 |
| Relative boiling point | 4 | 7 | 0.31 | 0.58 |
| Relative melting point | 3 | 6 | 0.70 | 0.41 |
| Physical properties | 15 | 14 | 0.00 | 1.00 |
Cohort 2 Fall 2011 – Spring 2013
| Demographics | Traditional (N = 111) | CLUE (N = 177) | p-Value | X 2 |
|---|---|---|---|---|
| Sex | 33% males, 67% females | 40% males, 60% females | 0.30 | 1.06 |
| Common majors | General engineering (22%), biological science (22%) | General engineering (16%), biological science (45%) | N/A |
| Assessments | Group | N | Median | Mean | p-Value | U | z |
|---|---|---|---|---|---|---|---|
| SAT composite (out of 1600) | Traditional | 99 | 1240 | 1242 | 0.50 | 7886 | −0.68 |
| CLUE | 139 | 1240 | 1254 | ||||
| MCAI (out of 100) | Traditional | 81 | 77 | 78 | 0.82 | 7927 | −0.23 |
| CLUE | 159 | 78 | 78 | ||||
| ET – SUMS (out of 5) | Traditional | 101 | 4.4 | 4.3 | 0.08 | 7787 | −1.77 |
| CLUE | 159 | 4.4 | 4.4 | ||||
| ER – SUMS (out of 5) | Traditional | 101 | 3.8 | 3.8 | 0.56 | 8528 | −0.59 |
| CLUE | 159 | 3.8 | 3.7 | ||||
| USM – SUMS (out of 5) | Traditional | 101 | 3.5 | 3.4 | 0.18 | 8058 | −1.35 |
| CLUE | 159 | 3.5 | 3.5 | ||||
| CNM – SUMS (out of 5) | Traditional | 101 | 4.0 | 4.3 | 0.06 | 7746 | −1.88 |
| CLUE | 159 | 4.3 | 4.4 | ||||
| MR – SUMS (out of 5) | Traditional | 101 | 4.0 | 4.0 | 0.99 | 8894 | −0.02 |
| CLUE | 159 | 4.0 | 4.0 |
| Pre-instruction IILSI items (PreGC1) | Traditional (N = 98) (%) | CLUE (N = 159) (%) | X 2 | p-Value |
|---|---|---|---|---|
| No information | 1 | 2 | 0.00 | 0.98 |
| Element(s) present | 83 | 76 | 1.18 | 0.28 |
| Number of valence electrons | 86 | 62 | 15.87 | <0.001 |
| Number of bonds between particular atoms | 89 | 74 | 7.09 | 0.008 |
| Type of bond(s) | 91 | 69 | 15.80 | <0.001 |
| Formal charges | 62 | 17 | 53.18 | <0.001 |
| Bond angle | 53 | 38 | 4.74 | 0.03 |
| Geometry/shape | 57 | 47 | 2.03 | 0.15 |
| Potential for resonance | 49 | 11 | 45.04 | <0.001 |
| Hybridization | 27 | 16 | 3.29 | 0.07 |
| Polarity | 63 | 61 | 0.05 | 0.82 |
| Intermolecular forces | 33 | 25 | 1.62 | 0.20 |
| Acidity/basicity | 12 | 13 | 0.00 | 0.97 |
| Reactivity | 26 | 23 | 0.14 | 0.71 |
| Relative boiling point | 9 | 8 | 0.05 | 0.82 |
| Relative melting point | 8 | 6 | 0.28 | 0.60 |
| Physical properties | 16 | 19 | 0.12 | 0.73 |
Appendix 2: competency curves for Cohort 2 comparison for students enrolled in traditional curriculum
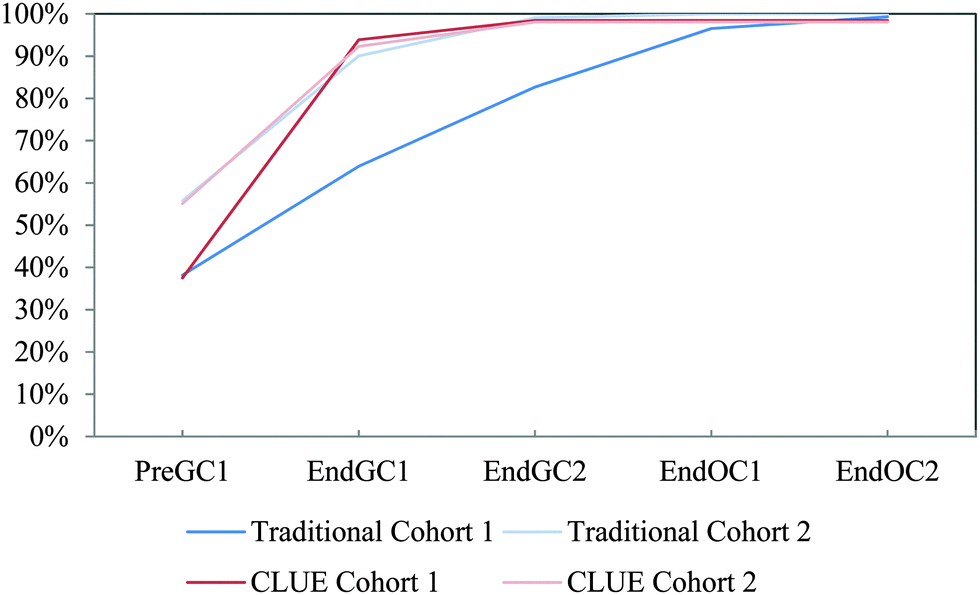
The competency curves produced for Cohort 2 student responses show similar linear trajectories (Fig. 6) to Cohort 1 responses (Fig. 3) for these five IILSI items. In the paper, Table 1 compares the time points for when each of the 50% and 75% thresholds were reached. We found that the results from Cohort 2 further support the findings produced from Cohort 1 and that the results for this part of the study were replicated. Although it may appear that there are slight differences between the two cohorts; for example, as shown in the paper in Table 1 for acidity/basicity, the population group for Cohort 2 just reaches the 75% threshold during the time point End OC2 while Cohort 1 students do not reach the threshold but fall slightly short at 74%. The few differences between the two cohorts are minimal, meaning that Cohort 2 responses further supported the findings from Cohort 1.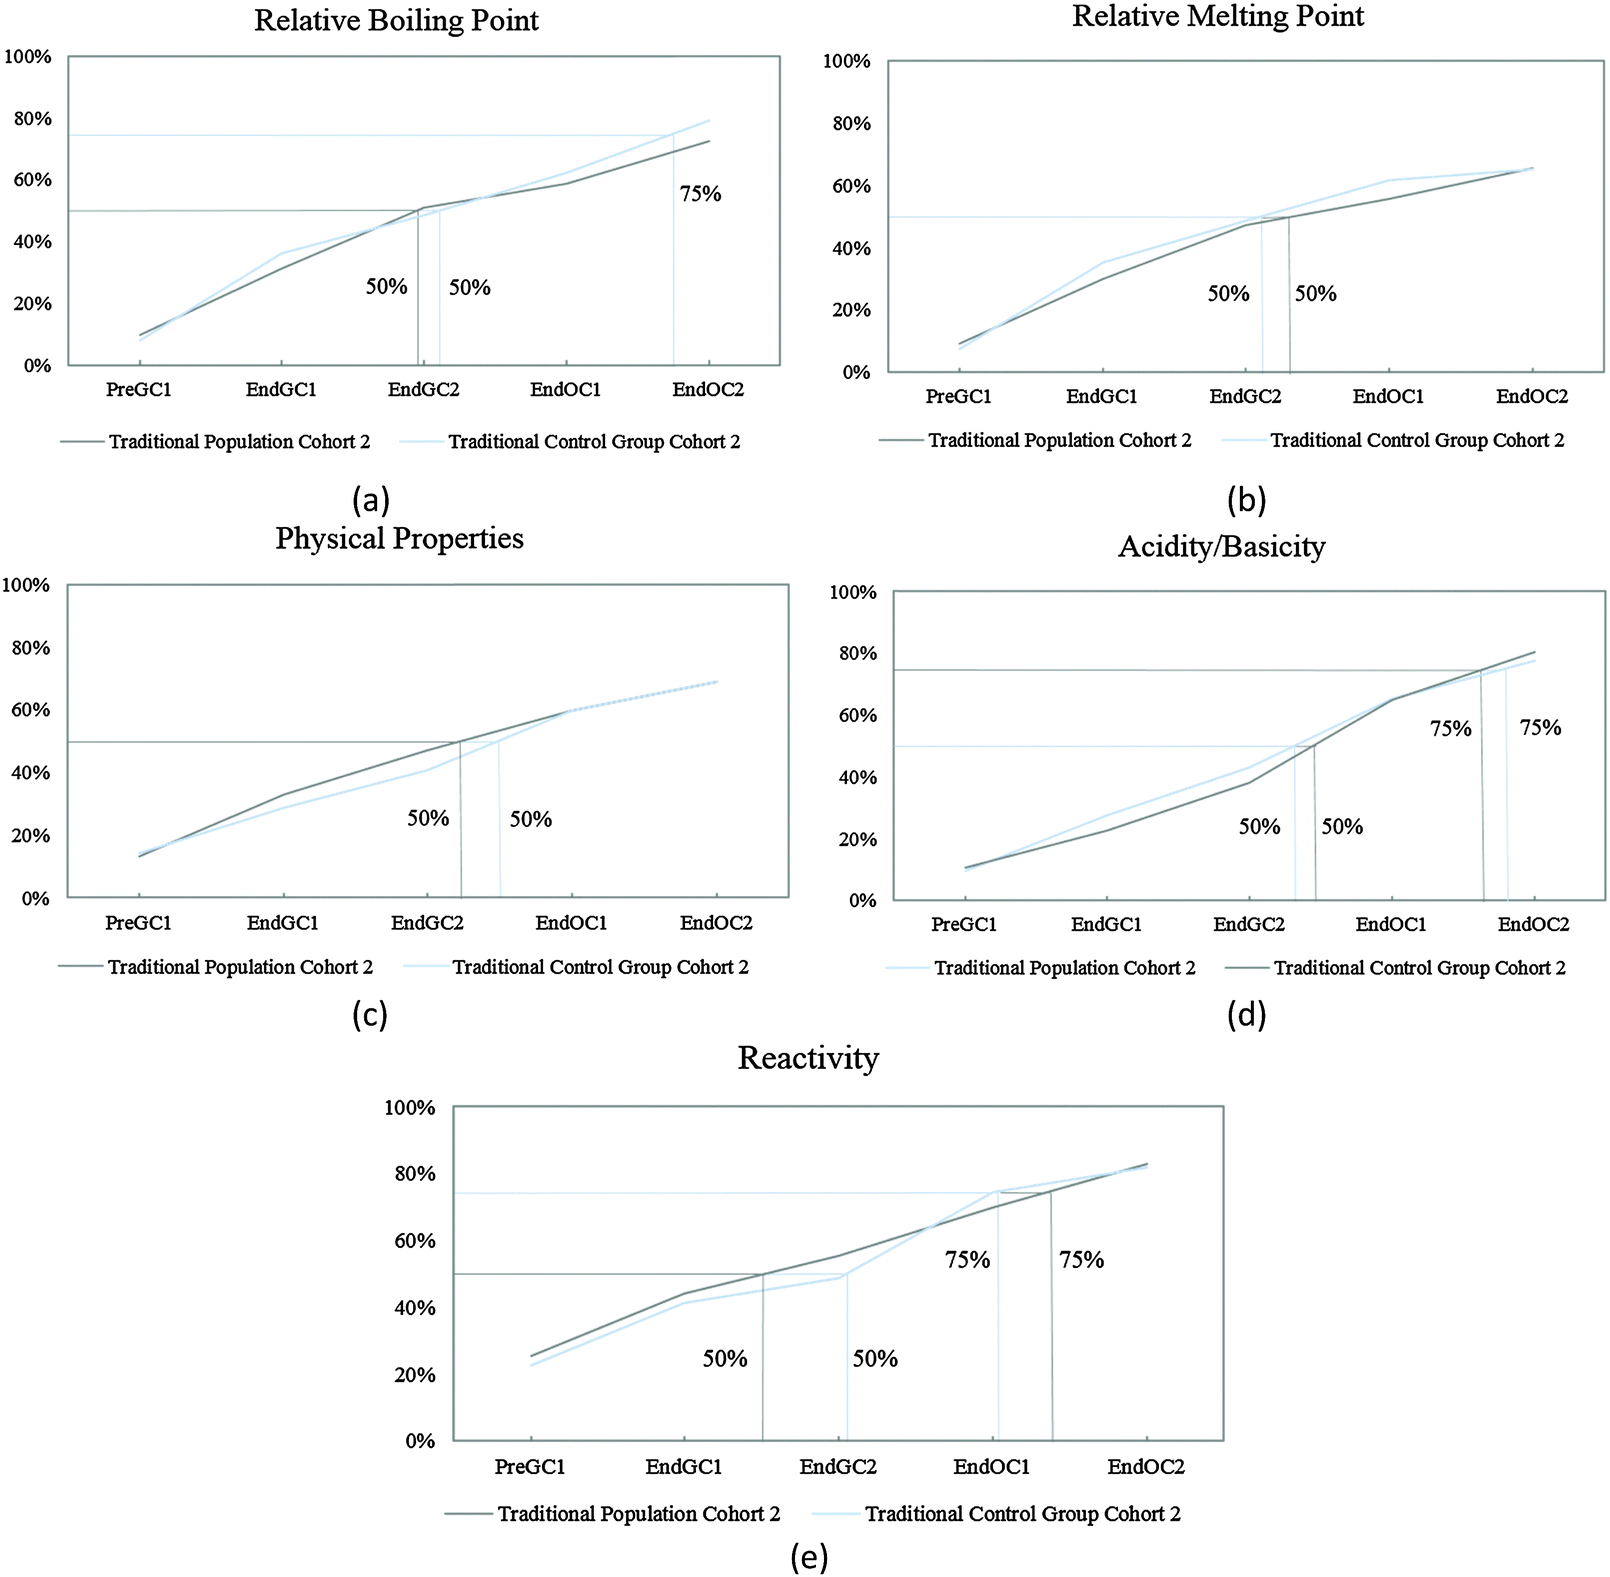 | ||
| Fig. 6 Competency curves for Cohort 2 students (population and control group) enrolled in a traditional curriculum. | ||
Appendix 3: competency curves for IILSI items for both curricula
 | ||
| Fig. 7 Competency curves for IILSI element(s) present comparing Cohorts 1 and 2 students enrolled in the CLUE curriculum with their matched cohort of students enrolled in the traditional curriculum. | ||
 | ||
| Fig. 8 Competency curves for IILSI type of bond(s) comparing Cohorts 1 and 2 students enrolled in the CLUE curriculum with their matched cohort of students enrolled in the traditional curriculum. | ||
 | ||
| Fig. 9 Competency curves for IILSI number of bonds between particular atoms comparing Cohorts 1 and 2 students enrolled in the CLUE curriculum with their matched cohort of students enrolled in the traditional curriculum. | ||
 | ||
| Fig. 10 Competency curves for IILSI number of valence electrons comparing Cohorts 1 and 2 students enrolled in the CLUE curriculum with their matched cohort of students enrolled in the traditional curriculum. | ||
 | ||
| Fig. 11 Competency curves for IILSI bond angle comparing Cohorts 1 and 2 students enrolled in the CLUE curriculum with their matched cohort of students enrolled in the traditional curriculum. | ||
 | ||
| Fig. 12 Competency curves for IILSI geometry/shape comparing Cohorts 1 and 2 students enrolled in the CLUE curriculum with their matched cohort of students enrolled in the traditional curriculum. | ||
 | ||
| Fig. 13 Competency curves for IILSI formal charges comparing Cohorts 1 and 2 students enrolled in the CLUE curriculum with their matched cohort of students enrolled in the traditional curriculum. | ||
 | ||
| Fig. 14 Competency curves for IILSI potential for resonance comparing Cohorts 1 and 2 students enrolled in the CLUE curriculum with their matched cohort of students enrolled in the traditional curriculum. | ||
 | ||
| Fig. 15 Competency curves for IILSI hybridization comparing Cohorts 1 and 2 students enrolled in the CLUE curriculum with their matched cohort of students enrolled in the traditional curriculum. | ||
 | ||
| Fig. 16 Competency curves for IILSI polarity comparing Cohorts 1 and 2 students enrolled in the CLUE curriculum with their matched cohort of students enrolled in the traditional curriculum. | ||
 | ||
| Fig. 17 Competency curves for IILSI intermolecular forces comparing Cohorts 1 and 2 students enrolled in the CLUE curriculum with their matched cohort of students enrolled in the traditional curriculum. | ||
Acknowledgements
This work was supported in part by NSF awards DUE 0816692 (1359818), DUE 1043707 (1420005), and DUE 1122472 (1341987). We also would like to acknowledge Michael W. Klymkowsky for his work in co-developing the CLUE curriculum.References
- Agresti A. and Finley B., (1979), Statistical Methods for the Social Sciences, San Francisco: Dellen Publishing Company.
- Allison P. D., (2010), Survival Analysis Using SAS: A Practical Guide, Cary, NC: SAS Institute.
- Bauer C. F., (2008), Attitude toward chemistry: a semantic differential instrument for assessing curriculum impacts, J. Chem. Educ., 85, 1440.
- Bowers A. J., (2010), Grades and graduation: a longitudinal risk perspective to identify student dropouts, J. Educ. Res., 103, 191–207.
- Brandriet A. R., Xu X., Bretz S. L. and Lewis J. E., (2011), Diagnosing changes in attitude in first-year college chemistry students with a shortened version of Bauer's semantic differential, Chem. Educ. Res. Pract., 12, 271–278.
- Bryfczynski S. P., (2012), BeSocratic: an intelligent tutoring system for the recognition, evaluation, and analysis of free-form student input, Doctoral dissertation, Clemson University.
- Cohen J., (1988), Statistical power analysis for the behavioral sciences, 2nd edn, Hillsdale, New Jersey: Lawrence Erlbaum Associates.
- Cooper M. M. and Klymkowsky M. W., (2013), Chemistry, life, the universe and everything: a new approach to general chemistry, and a model for curriculum reform, J. Chem. Educ., 90, 1116–1122.
- Cooper M. M. and Sandi-Urena S., (2009), Design and validation of an instrument to assess metacognitive skillfulness in chemistry problem solving, J. Chem. Educ., 86, 240–245.
- Cooper M. M., Grove N., Underwood S. M. and Klymkowsky M. W., (2010), Lost in Lewis structures: an investigation of student difficulties in developing representational competence, J. Chem. Educ., 87, 869–874.
- Cooper M. M., Underwood S. M., Hilley C. Z., (2012a), Development and validation of the implicit information from Lewis structures instrument (IILSI): do students connect structures with properties? Chem. Educ. Res. Pract., 13, 195–200.
- Cooper M. M., Underwood S. M., Hilley C. Z., Klymkowsky M. W., (2012b), Development and assessment of a molecular structure and properties learning progression, J. Chem. Educ., 89, 1351–1357.
- Cooper M. M., Corley L. M. and Underwood S. M., (2013), An investigation of college chemistry students' understanding of structure–property relationships, J. Res. Sci. Teach., 50, 699–721.
- Cooper M. M., Underwood S. M., Bryfczynski S. P. and Klymkowsky M. W., (2014), A short history of the use of technology to model and analyze student data for teaching and research, in Cole R. and Bunce D. (ed.), Tools of Chemistry Education Research, ACS Symposium Series, American Chemical Society, pp. 219–239.
- Cooper M. M., Williams L. C. and Underwood S. M., (2015), Student understanding of intermolecular forces: a multimodal study, J. Chem. Educ., 92, 1288–1298.
- Corcoran T., Mosher F. A. and Rogat A., (2009), Learning progressions in science: an evidence based approach to reform (No. RR-63), Consortium for Policy Research in Education, Teachers College – Columbia University.
- DeFever R. S., Bruce H. and Bhattacharyya G., (2015), Mental Rolodexing: Senior Chemistry Majors' Understanding of Chemical and Physical Properties, J. Chem. Educ., 92, 415–426.
- Hinkle D. E., Wiersma W. and Jurs S. G., (1988), Applied Statistics for the Behavioral Sciences, Boston: Houghton Mifflin.
- Ishitani T. T., (2006), Studying Attrition and Degree Completion Behavior among First-Generation College Students in the United States, J. Higher Educ., 77, 861–885.
- Kozma R. and Russell J., (1997), Multimedia and understanding: expert and novice responses to different representations of chemical phenomena, J. Res. Sci. Teach., 34, 949–968.
- Krajcik J. S., Sutherland L. M., Drago K. and Merritt J., (2012), The promise and value of learning progression research, in Bernholt S., Neumann K. and Nentwig P. (ed.), Making It Tangible: Learning Outcomes in Science Education, Münster: Waxmann, pp. 261–284.
- Mastering Chemistry, (2013), http://masteringchemistry.com/site/index.html, accessed 9.1.13.
- McMurry J. E. and Fay R. C., (2014), General chemistry: atoms first, 2nd edn, Upper Saddle River, NJ, Pearson Education, Inc.
- Miller R. G., (1981), Survival Analysis, New York, Wiley.
- Millis S. R., (2003), Statistical practices: the seven deadly sins, Child Neuropsychol., 9, 221–233.
- Murphy K., Holme T., Zenisky A., Caruthers H. and Knaus K., (2012), Building the ACS Exams Anchoring Concept Content Map for Undergraduate Chemistry, J. Chem. Educ., 89, 715–720.
- National Research Council, (2012), A framework for K-12 science education: practices, crosscutting concepts, and core ideas, Washington, DC: National Academies Press.
- Pintrich P. R., Smith D. A. F., Garcia T. and McKeachie W. J., (1991), A Manual for the Use of the Motivated Strategies for Learning Questionnaire (MSLQ), (No. NCRIPTAL-91-B-004), Ann Arbor, MI: National Center for Research to Improve Postsecondary Teaching and Learning.
- Raker J., Holme T. and Murphy K., (2013), The ACS Exams Institute Undergraduate Chemistry Anchoring Concepts Content Map II: Organic Chemistry, J. Chem. Educ., 90, 1443–1445.
- S.A.S. Institute, (2012), SAS/STAT 12. 1 User's Guide: Survey Data Analysis (Book Excerpt), SAS Institute.
- Sevian H. and Talanquer V., (2014), Rethinking chemistry: a learning progression on chemical thinking, Chem. Educ. Res. Pract., 15, 10–23.
- Shaffer J. P., (1995), Multiple hypothesis testing, Annu. Rev. Psychol., 46, 561–584.
- Shane J. W. and Bodner G. M., (2006), General chemistry students' understanding of structure–function relationships, Chem. Educ., 11, 130–137.
- Singer J. D. and Willett J. B., (1993), It's about time: using discrete-time survival analysis to study duration and the timing of events, J. Educ. Stat., 18, 155–195.
- Talanquer V., (2008), Students' predictions about the sensory properties of chemical compounds: additive versus emergent frameworks, Sci. Educ., 92, 96–114.
- Tobin K. G. and Capie W., (1981), The development and validation of a group test of logical thinking, Educ. Psychol. Meas., 41, 413–423.
- Treagust D. F., Chittleborough G. and Mamiala T. L., (2002), Students' understanding of the role of scientific models in learning science, Int. J. Sci. Educ., 24, 357–368.
- Underwood S. M., Reyes-Gastelum D. and Cooper M. M., (2015), Answering the questions of whether and when student learning occurs: using discrete-time survival analysis to investigate how college chemistry students' understanding of structure–property relationships evolves, Sci. Educ., 99, 1055–1072.
- Williams L. C., Underwood S. M., Klymkowsky M. W. and Cooper M. M., (2015), Are Noncovalent Interactions an Achilles Heel in Chemistry Education? A Comparison of Instructional Approaches, J. Chem. Educ., 92, 1979–1987.
- Zwick R. and Sklar J. C., (2005), Predicting college grades and degree completion using high school grades and SAT scores: the role of student ethnicity and first language, Am. Educ. Res. J., 42, 439–464.
| This journal is © The Royal Society of Chemistry 2016 |