The interplay between chemistry and heat/mass transfer during the fast pyrolysis of cellulose†
R. J. M.
Westerhof
*a,
S. R. G.
Oudenhoven
a,
P. S.
Marathe
a,
M.
Engelen
a,
M.
Garcia-Perez
b,
Z.
Wang
b and
S. R. A.
Kersten
*a
aSustainable Process Technology Group, Faculty of Science and Technology, University of Twente, Postbus 217, 7500AE Enschede, The Netherlands. E-mail: r.j.m.westerhof@utwente.nl; s.r.a.kersten@utwente.nl
bDepartment of Biological Systems Engineering, Washington State University, Pullman, WA 99164, USA
First published on 15th September 2016
Abstract
Biomass derived sugars are expected to play an important role as platform chemicals. Herein, we have shown that in the temperature range of 370 °C to 765 °C of the heat source a constant high sugar yield of ∼70% (C-basis) can be obtained from the fast pyrolysis of Avicel cellulose while producing hardly any gas (<1%) and solid residue (<1% above 450 °C). This opens the opportunity to combine the advantages of thermochemical processes, such as high conversion rates and products not being heavily diluted with water, with an increased value of the product slate. In this paper, firstly the screen-heater used to study the very early stages of cellulose pyrolysis is introduced and characterized. Secondly, yield data as a function of process and pyrolysis conditions are presented and interpreted, also using mathematical models, with respect to chemistry, heat transfer, mass transfer and their interplay. It has been shown that next to heat transfer and the residence time in the vapor phase also the escape rate of products from the reacting particle (mass transfer) is a key process determining the overall mass loss rate and/or the product distribution.
1. Introduction
The pyrolysis of biomass has been extensively studied for more than a hundred years. Already in 1920 Clément and Rivière1 published a book called “La cellulose” summarizing the results until then. More recently, Lédé2 presented a historical review covering results of cellulose pyrolysis till 2012. Mettler et al.,3 Mohan et al.,4 and Kersten and Garcia-Perez5 reviewed fast pyrolysis of biomass and identified knowledge gaps and challenges. From these reviews it can be concluded that although progress is still made in the detailed understanding, more work is needed to develop predictive models of the chemistry and transport processes (mass and energy) at the molecular, cell, particle and reactor levels.For decades, fast pyrolysis has been advocated to be a promising technology for the production of a bio-based energy carrier, called bio-oil, which can replace fossil fuels in the heating and transportation sector. Yet, slow market introduction of the technology and adverse properties of the bio-oil point out room for improvement. Optimization could be achieved via predictive reaction and transport models from which optimal process conditions, leading to the highest value of the product slate, can be obtained. With respect to the product slate it is the authors' view that it is worthwhile to explore the production of feeds for fermentation (sugars) and the chemical industry (e.g. sugars, aromatics/phenols, acetic acid, glycolaldehyde) instead of, or next to, bio-oil for energy applications.5,6
This paper aims at advancing the understanding of reactions and transport phenomena and their interplay by studying the relative effects of the reaction rate, the heating rate, the escape rate of volatile products from the pyrolyzing cellulose particles and the rate of the subsequent quenching of these products. To this end, a screen-heater reactor has been designed that combines a high heating rate of the cellulose sample with fast removal and quenching of reaction products. Hence, the objective of the screen-heater is to minimize the effects of so-called secondary reactions in an attempt to study the first stages of the pyrolysis process. The impact of these secondary reactions on the yield of products obtained in fluidized beds or equivalent industrial reactors is studied by comparing the product distribution obtained with this reactor with the product distribution of the screen-heater. Yields of lumped component classes (gas, solid residue, condensed product), anhydrosugars (DP1 to DP>5), and glycolaldehyde is determined as function of the final temperature (TFS) of the screens and a typical fast pyrolysis temperature in the fluidized bed. Interpretation of these data is supported by mathematical models.
Experimental studies also aiming at minimizing secondary reactions are, inter alia, those of Lédé et al.,7 Piskorz et al.8 and Gong et al.9 These studies report (very) low char yields, high yields of anhydrosugars, but also significant amounts of light oxygenates (e.g. glycolaldehyde) and permanent gases, particularly at higher temperature. The production of lights and gas in these studies may be due to the secondary reactions. In the results section these studies and other are discussed in more detail.
2. Material and methods
2.1. Materials
Avicel ph101 (Sigma-Aldrich particle size ∼50 μm, 60.5% crystallinity,10 ash content 0.005% by weight, AAEM 1 mg kg−1, degree of polymerization specified <350 average 220 (ref. 11)), levoglucosan (1,6-Anhydro-b-D-glucopyranose, Carbosynth, purity >98% by weight) and cellobiosan (1,6-Anhydro-b-D-cellobiose, Carbosynth, purity >95% by weight) were used as a feedstock for the pyrolysis experiments. The feedstocks were dried in a vacuum oven (Heraeus FVT420) at room temperature and 1 mbar for at least 24 hours. More details on the used chemicals and materials can be found in ESI† S1.2.2. Screen-heater
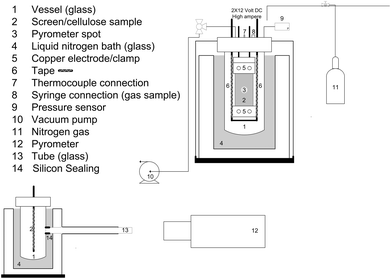
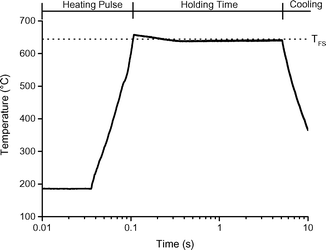
The screen-heater (see Fig. 1) and experimental procedure are described in detail in ESI† S2 and in Hoekstra et al.12 Here follows a short recap. The reactor consisted of a glass vessel (250 ml) in which the sample, ∼50 mg cellulose pressed between two (stainless steel 316) screens, was clamped between the two electrodes (#5). The cellulose thickness was measured to be 45 μm (ref. 12) (characteristic thickness ∼25 μm), for which Krumm et al. claimed the absence of mass and heat transfer limitations.51 The effect of the screen material was checked by a test with gold sputtered screens (see ESI† S6.2) and turned out to be not significant. The vessel could be operated at pressures between 5 mbar and 1 bar (absolute, pure N2). A liquid nitrogen bath (#4) was placed around the vessel to cool the wall of the vessel. A syringe to take gas samples (#8) and a pressure gauge to monitor the pressure increase during an experiment were present. A pyrometer (#12) was used to monitor the temperature. To prevent disturbance of the temperature measurement by the liquid nitrogen, a glass tube (#13) with a silicone sealing (#14) was placed in the liquid nitrogen bath. During the experiment an electrical current was passed through the screens, which served as electrical resistance heaters, to supply the heat required for heating the sample and maintaining it at a constant temperature for a specified time, called the holding time (see Fig. 2 for a typical temperature profile). The screens have a heating rate of approx. 5000 °C s−1. After the holding time the screens were cooled with a rate of approximately 60 °C s−1. Experiments at 1 s and 5 s holding time were performed. 5 s was selected to ensure complete conversion as of ∼450 °C.20,25During the experiment cellulose decomposes into vapors, aerosols and gases. The vapors condensed on the cold surface of the vessel and electrodes and were recovered together with the aerosols. Note, the condensed product is in principle a solid product and not a liquid at room temperature, therefore this fraction will be referred to as condensed product instead of the general pyrolysis or bio-oil. The material that remained between the screens after certain experiments is termed solid residue.
The mass of condensed product was determined by subtracting the initial weight of the vessel, tape and clamps from the weight of these components after the experiment. The vessel was then rinsed with approximately 6 mL (in batches of 2 ml) of solvent. The solvent was Milli-Q water for HPLC analysis or methanol for GC/MS analysis. The solution was filtered before analysis. Note, >90 wt% of the condensed products were collected on the vessel wall and thus only <10 wt% of these products was collected on the clamps and tape. A small amount of the product on the vessel was not soluble. These compounds turned out to be unconverted cellulose (<9 wt%) see ESI† S6.5. We expect that this cellulose is ejected from the sample due to the forces present on the screens in the heating trajectory (see bending of the screens in Fig. 5) and therefore referred to as unreacted-ejected cellulose. The solid residue was determined by weighting the screens before and after the experiment. For more detailed ESI† see S2.
2.3. Fluidized bed
Avicel cellulose particles of <50 μm were introduced semi-batch wise in the splash zone of a fluidized bed operated with sand of 212 μm to 300 μm. The feed rate was 200 g h−1. The fluidized bed was operated at low velocity (∼2Umf) as a result of which the cellulose particles did not back-mix into the bed, minimizing the cellulose–sand interaction. Therefore the setup can be characterized by a pyrolysis zone with a high heat transfer coefficient (the splash zone) followed by an empty residence time reactor (the hot zone till the condensing section). More details are given in ESI† S3. The vapor residence time in the hot zone of the setup (reactor + tubing) was ∼1.6 s. In this calculation the flowrates of nitrogen, produced vapors and gases were considered.2.4. Analysis
The ash content of the cellulose was determined by dry oxidation at 575 °C. The functional groups of cellulose, solid residue and produced anhydrosugars were analysed using FTIR.The condensable product was analyzed for acetic acid, glycolaldehyde and acetol (GC/MS) and sugar content (HPLC). The DP is referred to as the degree of polymerization of C6H10O5 units. The sugars DP1 (levoglucosan), DP1−2 (compounds identified between DP1 and DP2), DP2 (cellobiosan), DP3 (cellotriosan), DP4+5 (sum of DP4 (cellotetrasan) and DP5 (cellopentosan)) and DP>5 (DP higher than 5) were analyzed using HPLC (see ESI† S4). LC/MS analysis was used to identify the degree of polymerization of compounds referred to as DP>5 (see ESI† S4) and to obtain information on the composition of compounds termed DP1−2 (ESI† S6.4). Hydrolysis of the condensable product was done using the analysis method of NREL15 (ESI† S4). By hydrolysis the hydrolysable sugars in the condensable product were converted to glucose. The glucose yield in this work is expressed on cellulose basis. See for the calculations (equation 33 in ESI† S6.3) of the glucose yield. Table 1 shows an overview of the analysis methods applied.
| Composition/properties | Technique | Ref. |
|---|---|---|
| Cellulose | ||
| Ash content | Dry oxidation @ 575 °C | 13 |
| Ash composition | ICP | |
| Solid residue | ||
| Functional groups | FTIR | |
| Condensed products | ||
| Light oxygenates | GC/MS | 14 |
| Anhydrosugars | HPLC + LC/MS | |
| Hydrolysable sugars | Acid hydrolysis + HPLC | 15 |
| Functional groups | FTIR | |
| Gas | ||
| Non-condensable gasses | Micro-GC | |
2.5. Interpretation model
To support the analysis of the data an interpretation model is used. The model is schematically visualized in Fig. 3. Heat is transferred via the wires to the sample via direct contact with the wires. At elevated temperatures, chemical reactions will start to proceed in the solid sample. The temperature of the reacting sample can be lower than the temperature of the wires due to endothermic reactions and a finite heat transfer coefficient between sample and wires. Some decay products leave the solid matrix via sublimation. Other smaller products can form liquid regions inside the solid matrix. Such liquids have been observed in pyrolysing biomass.16 In the liquid pools reactions can continue and products can evaporate from it. If the sample would heat truly isothermally the whole sample will change from solid to liquid simultaneously. However, due to slightly non uniform spatial heating we expect liquid pools (see 3.1.1.).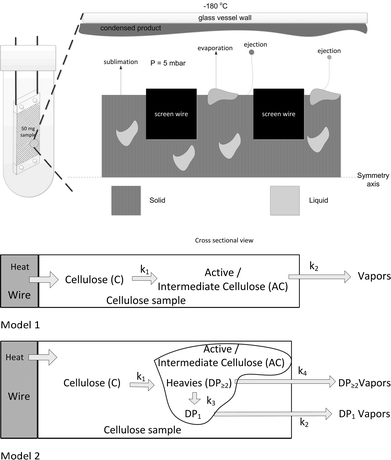 | ||
| Fig. 3 Conceptual representation of the mass and heat transport processes and interpretation models 1 & 2. There are no spatial temperature gradients in the sample. | ||
Evaporation of smaller products (e.g. DP1) may be turbulent as the vapor pressure can be much higher than the prevailing pressure in the vessel. The work of Dauenhauer and co-workers17 has shown that it is also possible that aerosols are ejected from reacting cellulose samples. Summarizing, products can escape from the pyrolysing particle via sublimation, evaporation and aerosol ejection. Hereafter, all these processes are referred to as mass transfer.
Mathematical models are used to interpret the experimental data at the level of the observed trends in product yields as a function of final temperature of the screens. To describe the weight loss and temperature of the cellulose sample a modified version of the model as described by Lédé and co-workers18 has been used including the reaction rate parameters as given by Shafizadeh.19 In our model, the sample has a spatially uniform temperature and the state of the intermediate/active cellulose is not defined (can be liquid and/or solid). Hereafter this model is called model 1 (see Fig. 3).
To predict the trend of the product distribution as function of the temperature, model 1 has been extended by: i) an intermediate/active cellulose phase that consists of heavies (DP≥2) and DP1, ii) a reaction of heavies to lights that takes place on the sample; and iii) a lower escape rates of heavies compared to lights. Hereafter this model is called model 2. Fig. 3 shows the models schematically and in ESI† S5 the details are given including the kinetic constants.
3. Results and discussion
3.1. Characterization of the equipment
In the screen-heater we performed experiments at 5 mbar and 1 bar. The results of these experiments were compared with results obtained in a 200 g h−1 fluidized bed operated at 1 bar. In Table 2, the main characteristics of these experiments are listed. Temperature is important as it sets the rate of the pyrolysis reactions and the vapor pressure of the products. The heating rate determines the time it takes to heat the cellulose from its initial temperature to its end temperature (typically the temperature of the heat source/surroundings/pyrolysis reactor). The ratio of the heating rate over the reaction rate, the Py′ number, indicates whether the reactions take place after the cellulose is heated to its final temperature (Py′ > 10 & Bi < 1 = kinetically controlled pyrolysis20) or already in the heating trajectory.20 A lower hot vapor residence time (higher quenching rate) is expected to result in less secondary reactions of products outside the reacting cellulose particle. The residence time of products on the reacting cellulose, characterized here by the evaporation time of individual products, is indicative for the extent to which these products can further react while still being on the pyrolyzing cellulose particle. A low residence time (high escape rate) results in less reactions of initial decay products while being on the particle.| Screen-heater | Screen-heater | Fluidized bed | |
|---|---|---|---|
| a Reproducibility of fluidized bed experiments has been shown in ref. 30. b Determined in the condensed product by HPLC analyses. c Determined after hydrolysis of the condensed product. d Condensed product from SH doesn't include water (lost during dismanteling setup) whereas the condensed product from FB includes water. n.a. not analyzed. | |||
| Pressure (mbar) | 5 | 1000 | 1000 |
| Heating rate (°C s−1) | 5000 | 5000 | 5000 |
| Hot vapor residence time (s) | 0.02 | ∼0.02 | 1.6 |
| DP1 evaporation time (s) | 0.03 | <0.3 | <0.3 |
| DP3 evaporation time (s) | 0.4 | 75 | 75 |
| No of experiments | 5 | 2 | 1a |
| Yields (kg kg−1 cellulose) | |||
| Gas | <1 | 2 | 12 |
| Solid residue | <1 | <1 | 1 |
| Condensed product | 96 | 83 | 85 |
| Produced water | n.a. | n.a. | 10 |
| Condensed organicsd | n.a. | n.a. | 75 |
| DP1b | 19% | 33% | 40% |
| DP1−2b | 17% | 16% | 19% |
| DP2b | 23% | 9% | 5% |
| DP3b | 18% | 4% | 3% |
| DP4+5b | 16% | 2% | <1% |
| DP>5b | 4% | <1% | <1% |
| Totalb | 97% | 64% | 68% |
| Total sugars (Cglucose/Ccelllose)c | 69% | 50% | 50% |
| Glycolaldehyde | 2 | 2 | 6 |
Under the standard conditions of 5 mbar the set-point of the screens was varied between 331–765 °C. In this temperature range, the time to reach full conversion of cellulose is reported to decrease from minutes to less than a second9,21–23 and an increase of gaseous products at the expense of liquid and solid products is typically observed.21,24 At 1 bar, experiments were performed at ∼535 °C in both the screen-heater and fluidized bed.
The heating rate of the screens was measured to be ∼5000 °C s−1 (with cellulose between the screens). Also in the fluidized bed the initial (first part of the trajectory) heating rate of these 50 μm particles was estimated to be very high (∼5000 °C s−1, see ESI† S3). High heating rates were selected to approach kinetically controlled pyrolysis (as defined by ref. 20) as much as possible. The conditions under which this was actually achieved in the screen-heater will be discussed later. The employed heating rates are high in comparison with industrially relevant particles of several millimeters in size. For such particles heating rates are limited to 50–500 °C s−1.25,26
 | ||
| Fig. 4 Screen shots extracted from a high speed camera movie of levoglucosan pyrolysis/evaporation. Pressure 5 mbar, TFS = 391 °C. The arrow show the condensed product on the glass vessel wall. | ||
Also at 1 bar and cooling of the vessel wall with liquid nitrogen the escaped products cool very rapidly due to their direct contact with the cold nitrogen gas inside the vessel. A thermocouple positioned at a distance of 0.015 m from the screen showed that the temperature was below 80 °C when pyrolysis of cellulose took place at 535 °C and 1 bar. Rapid cooling of the escaped products at 1 bar was confirmed by analysis of the movie frames, see Fig. 5. Immediate after the first levoglucosan disappeared the first aerosols appeared in the glass vessel showing that the levoglucosan vapors had cooled down (see frame 3 and up fig. 5, white clouds pointed at by the arrow). Also here, similar observations were done for cellulose (see ESI† S2.6).
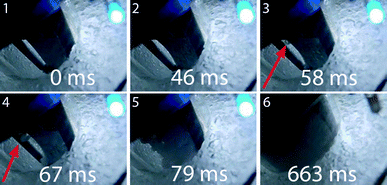 | ||
| Fig. 5 Screen shots extracted from a high speed camera movie of levoglucosan pyrolysis/evaporation. Pressure 1 bar, TFS = 488 °C. The arrow show the condensed product in the glass vessel. | ||
In the fluidized bed, operated at 1 bar, the hot vapor residence time was calculated to be 1.6 seconds (∼80 times more than in the screen-heater) based on the known gas phase volume of the reactor and the volumetric flow rate, which should result in significant cracking of the vapors according to previously reported data.21,27,28
The evaporation time of DP3 (estimated vapor pressure of 3 mbar at 550 °C) was estimated using a model (see ESI† S5.1) describing the evaporation/sublimation of the pure compound (sheet of material of 25 μm). In this model, the evaporation flux is described by diffusion (convection is excluded) with the vapor pressure at the prevailing temperature being present at the surface. This model predicts (see Table 2) that at 1 bar the evaporation time of DP3 is 75 s as compared to 0.4 s at 5 mbar. We are aware that these are rough estimates, though the predicted difference in evaporation time will of the correct order of magnitude. Therefore, it can be concluded that at 5 mbar DP3 can evaporate during pyrolysis of cellulose (which takes ca. 121 ms at TFS = 610 °C, see Fig. 6), while at 1 bar this will be hardly the case. High DP products can also leave the sample via ejected aerosols as shown by Dauenhauwer.17 Also by this mechanism the escape rate will be higher at lower pressure as a result of vigorously boiling smaller molecules entraining the aerosols and/or a lower counter pressure supporting aerosol ejection.
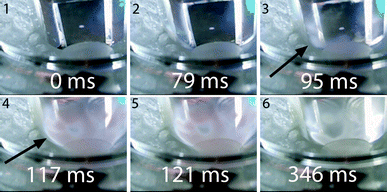 | ||
| Fig. 6 Screen shots extracted from a high speed camera movie of cellulose pyrolysis. Pressure 5 mbar, TFS = 610 °C. The arrow show the condensed product on the glass vessel wall. | ||
Summarizing: i) by comparing results obtained in the screen-heater at 5 mbar and 1 bar the effect of the escape rate of larger sugars from the reacting sample is studied (quenching of escaped products is very fast for both), ii) comparison of the screen-heater at 1 bar with the fluidized bed at 1 bar shows the influence of the hot vapor residence time (escape rate from the sample is comparable). In all cases heat transfer is fast.
3.2. Mass balance closure and reproducibility
The closure of the mass balance of the 37 reported cellulose screen-heater experiments at the level of gas, condensed product and solid residue was in the range of 0.87 kg kg−1 to 1.01 kg kg−1 with a median of 0.95 kg kg−1. Reproducibility was checked by taking into account 5 measurements in the range of 520 °C to 540 °C (a single constant temperature was not possible due to control issues, see 3.1.1.). The standard deviation in the yields of condensed product, gas and solid residue were 0.03 kg kg−1, 0.005 kg kg−1 and 0.002 kg kg−1, respectively. The standard deviation in the yields of DP1 to DP>5 was 0.02 kg kg−1 (average value of the standard deviations of the individual DPs). Taking into account the small amount of sample and the tedious recovery and analysis procedure these numbers are considered quite satisfactory. The fact that 4 different experimenters produced results that did not significantly differ further supports the soundness of the developed apparatus and methods. More details can be found in ESI† S2.3.3. Yields and product composition at 535 °C
Table 2 gives the mass balance and the composition of the condensed product obtained at a final screen temperature (TFS) of 535 °C. At this temperature the conversion was complete in the holding time, so no effects of the relatively slow cooling time are present. Also data obtained in the fluidized bed are listed in Table 2.The total sugar yields (both sum of DP and after hydrolysis) at 1 bar in the screen-heater and fluidized bed were equal (see Table 2 and next paragraph), while in the fluidized bed considerably more gas and GA was produced. It has been observed that levoglucosan is stable in the vapor phase28 even at an extended hot vapor residence time of 12 s in the absence of minerals. This could imply that gases and other light products are formed from predominantly non-(hydrolysable) sugar compounds. Further research is required to determine from which actual compounds the produced gases originate from.
The presence of such large sugars (DP>5) was previously observed by several researchers but only using solvent extraction of the solid residue after cooling to ambient temperature. In this work, they were actually collected as condensed product after their escape from the pyrolyzing particle. Only very small amounts of deeper dehydrated products (e.g. 5 HMF and levoglucosenone) were presented in the condensed product. Interestingly, the lumped compounds between DP1 and DP2 analyzed by HPLC and identified by LC/MS turned out to be isomers of cellobiosan. These isomers were also observed by Boon and co-workers.39
Typically, the sum of the compounds detected by HPLC accounted for more than 90% by weight of the total condensed product for tests at 5 mbar in the screen-heater (see Table 2 and ESI† Table S8 in S6.7).
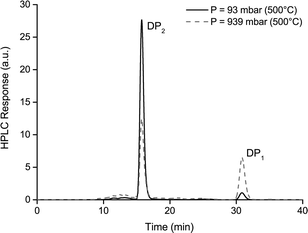
DP1, DP2 and DP3 were found in similar quantities when pyrolyzing cellulose in the screen-heater at 5 mbar, viz. all their yields were around 20% by weight (see Table 2). In addition, a significant amount of DP4 & DP5 and DP>5 were found. When operating the screen-heater at 1 bar DP1 became the dominating product while much less larger sugars were found. The yield of sugars and their distribution obtained in the fluidized bed and in the screen-heater operated at 1 bar were remarkably similar: DP1 was the dominant product and DP≥4 was hardly present. Because of the large difference in hot vapor residence time between these experiments (screen-heater and fluidized bed at 1 bar), hot vapor residence time is excluded as an important factor affecting the DP distribution. The main difference between the experiment at 5 mbar and the experiments at 1 bar is the escape rate of larger sugars from the pyrolyzing sample. We found it is impossible to explain the observed effect of pressure in the screen-heater on the product distribution solely by the rate of chemical reactions, because solid and liquid phase reactions are not effected by pressure. Reactions in the vapor phase are unlikely due to the fast quenching for both 5 mbar and 1 bar. The higher DP1 yields and corresponding lower DP≥2 yields at higher pressure can be explained by a combination of mass transfer and chemistry at particle level. It is our hypothesis that at lower pressure, the escape rate of larger sugars is higher (see Table 2 for calculated values of DP3) and as a result they are found in the condensed product while at higher pressure these larger sugars have lower escape rates upon which they further de-polymerize on the particle resulting in higher yields of DP1 in the condensed product. Tests with levoglucosan (DP1) and cellobiosan (DP2, see Fig. 7) as feed were performed at 5 mbar to investigate the existence of re-polymerization (see ESI† S6.6). In these tests, products of higher DP than the starting material were negligible. Hence, it is concluded that, in our screen-heater under the standard conditions, DP2 to DP11 sugars are produced by de-polymerization reactions only. At vacuum the pyrolysis product of cellobiosan is mostly cellobiosan whereas at 1 bar the product contains both cellobiosan and a considerable amount of levoglucosan, see Fig. 7.
The aforementioned studies comparing the composition of the condensed product with that of molecules extracted from partly converted particles (after quenching) also showed that mass transfer influenced the composition of the condensed product. Lédé and co-workers7 and Wu and co-workers,9 for instances, have found that the decomposition fragments extracted from partly converted particles have, on average, larger DP than the recovered condensed product indicating that these larger molecules have difficulty leaving the particle and crack further on the particle. These are all strong indications that mass transfer is playing an important role next to chemistry. We will show in the next paragraph a similar effect, caused by the final temperature of the screens that we could predict by a simple model including chemical reactions and mass transfer.
3.4. Effect of TFS on product yield and composition at P = 5 mbar
 | ||
| Fig. 8 A) Residue and B) condensed product yields as function of TFS and different holding time. The data of 4 experimenters are included. The pressure was 5 mbar. | ||
FTIR analysis and visual inspection showed that the residue obtained below 400 °C is unconverted cellulose and not char (see Fig. S24 in ESI† S6.6). This is in agreement with reported kinetic data19 that indicate that, below 400 °C, char forming reactions are not significant at reaction times of 1 s to 5 s. Between 400 °C and 450 °C not enough solid residue was recovered for analysis. For conditions of 450 °C and higher, the yield of solid residue was very low (<1% by weight) in both the fluidized bed and screen-heater (see Table 2 and Fig. 8A). The low yield of solid residue is in agreement with earlier published data on cellulose pyrolysis.7,31 In conclusion, the conversion of cellulose based on mass loss is higher than 99% by weight above 450 °C and 1 s of holding time.
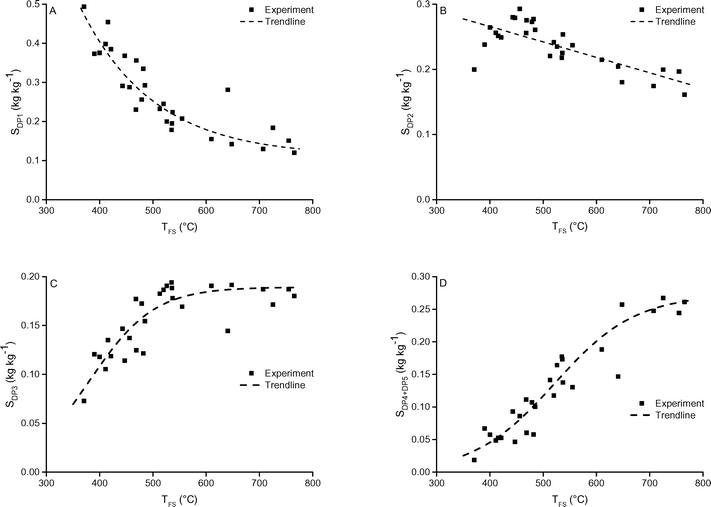 | ||
| Fig. 9 A) DP1, B) DP2, C) DP3 and D) DP4+5 selectivity as function of TFS. The pressure was 5 mbar. Includes 1 and 5 seconds holding time. | ||
 | ||
| Fig. 10 The A) DP1−2 and B) DP>5 selectivity as function of TFS. The pressure was 5 mbar. Includes 1 and 5 seconds holding time. | ||
The total yield of sugars, expressed as the recovery of glucose after hydrolysing the condensed product, remained constant in the range of 420 to 765 °C, see Fig. 11. To the best of our knowledge, we are the first to report a constant yield of hydrolysable sugar as function of the temperature of the heat source, in such a broad range. The constant total sugar yield as function of temperature indicates that the newly developed screen-heater also minimizes the secondary reactions of sugars to non-sugar decay products.
Radlein et al. also reported a strong effect of temperature on the DP1 yield: in their measurements in an atmospheric fluidized bed the yield decreased monotonically from 38 wt% at 400 °C to 15 wt% at 600 °C.35 They reported a strong decrease of the yield of total sugars from ∼60 wt% at 400 °C to 18 wt% at 600 °C.35 Gong et al. reported decreasing yields (measured in an atmospheric screen-heater) of DP1, DP2 and DP3 in the range of 400 °C to 500 °C and constant yields thereafter from 500 °C to 700 °C.9 Also in their case the yield of total sugars decreased significantly in the range of 400 °C to 700 °C (from ∼60 wt% to 35 wt%).9 Shafizadeh et al. reported for the slow(er) pyrolysis of cellulose under vacuum a constant oil, levoglucosan and reducing sugar yield between 375 °C and 500 °C.43
As stated before the decrease in DP1 yield at increased temperature is unexpected when considering solely chemistry. The higher DP1 yield at lower temperature is explained by the longer time available for cracking of higher DP's on the reacting particle (in the solid or liquid phase) due to their lower escape rate from the sample. At higher temperature, DP3 and larger sugars have a higher escape rate from the sample and hence less time to crack leading to their increased presence in the condensed product.
In an attempt to support this hypothesis, model 2 was developed. When including the cracking of oligomers on the reacting cellulose and giving the oligomers a lower escape rate than levoglucosan in the model (model 2), the measured trend of decreasing DP1 and increasing DP≥2 selectivity as function of increasing temperature is predicted (see Fig. 12) by this model. Note that, only the trend is predicted correctly. Quantitative agreement would need a model that includes independently measured or disentangled values for the rate constants of the chemical reactions on the particle and escape rates (velocity) of products from the sample.
The observations imply that (earlier reported) pyrolysis kinetics, especially those based on the mass loss of cellulose or biomass particles, include both chemistry and mass transfer rates. For instance, at lower temperature only low DPs can evaporate as a result of which more bonds have to be broken of the original polymers as compared to higher temperatures at which also decay products of larger DP can escape. Hence, the definition of Pyle and Zaror of kinetically controlled pyrolysis, which is based on only the ratio the reaction rate and heat transfer rate,20 needs to be reconsidered.
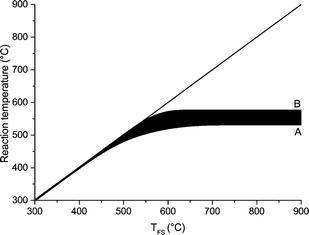
Upward of 550–600 °C the measured DP1, DP3, DP4+5 selectivity seem to be unaffected by the final screen temperature (see Fig. 10). Analysis of the fits show that these measured DPs are better described by an equation leading to a plateau value at increased temperature as compared to a monotonic linear increasing or decreasing function (see ESI† S6.2). Model II also predicts that the DP yields/selectivity's above a final screen temperature of ca. 550 °C become constant, see Fig. 12. This is because the actual reaction temperature becomes constant above this final screen temperature, as also argued by Piskorz et al.8 and Lédé.48–50Fig. 13 shows the average reaction temperature (defined as the average temperature of the sample between 10% and 90% conversion) versus the final temperature of the screens for several cases. Two extreme cases are simulated: A) the screens heat with 5000 °C s−1 and the heat transfer coefficient (screen to sample is just 1000 W m−2 K−1); and B) the sample is heated with 10![[thin space (1/6-em)]](https://www.rsc.org/images/entities/char_2009.gif) 000 °C s−1 (infinite heat transfer coefficient). The parity line represents kinetically controlled pyrolysis which was defined by Pyle & Zaror as pyrolysis at isothermal conditions.20 The model predicts that the average reaction temperature is lower than the final temperature of the screens. For case A this happens at a lower TFS in combination with a lower asymptotic reaction temperature as compared to case B. For both extreme cases, above TFS = 550 °C, heat transfer cannot keep up with the reaction rate and consequently the conversion is complete within the heating trajectory. This was also observed experimentally by analysis of the pictures/movies taken during conversion. The blue LED in Fig. 5, which was connected to the electrodes, lights up when current is passing through the screen (to heat the screen). The LED in this experiment (cellulose, 5 mbar TFS = 610 °C) was continuously lighted during the first 121 ms, meaning that the experiment was still in the initial heating pulse. Note that all cellulose has reacted away before 121 ms. This show that the reaction was completed before the screen reached the final screen temperature.
000 °C s−1 (infinite heat transfer coefficient). The parity line represents kinetically controlled pyrolysis which was defined by Pyle & Zaror as pyrolysis at isothermal conditions.20 The model predicts that the average reaction temperature is lower than the final temperature of the screens. For case A this happens at a lower TFS in combination with a lower asymptotic reaction temperature as compared to case B. For both extreme cases, above TFS = 550 °C, heat transfer cannot keep up with the reaction rate and consequently the conversion is complete within the heating trajectory. This was also observed experimentally by analysis of the pictures/movies taken during conversion. The blue LED in Fig. 5, which was connected to the electrodes, lights up when current is passing through the screen (to heat the screen). The LED in this experiment (cellulose, 5 mbar TFS = 610 °C) was continuously lighted during the first 121 ms, meaning that the experiment was still in the initial heating pulse. Note that all cellulose has reacted away before 121 ms. This show that the reaction was completed before the screen reached the final screen temperature.
4. Conclusions
To the best of our knowledge, we are the first to observe experimentally that it is possible to convert cellulose in the broad temperature range of 370 °C to 765 °C of the heat source into hydrolysable sugars with a high and constant yield of 70% on carbon basis (conservative estimate) while producing only a very limited amount of light oxygenates and gas. Below 450 °C solid residue was found, though this turned out to be unconverted cellulose, not char. The results indicate that depolymerisation to anhydrosugars (DP1–DP11) by mostly random chain scission is a true primary reaction. The production of levoglucosan is induced by lower evaporation rates (mass transfer limitation) at 1 bar compared to 5 mbar which results in pronounced times of oligomers to react on the particle. Even at 1 bar or low temperature (350 °C) significant amounts of DP≥2 were found highlighting that random chain scission is always present. Gas formation is not a primary reaction and char formation can be, as was already known, avoided. It has been found that light oxygenated compounds and gases are formed predominantly in the vapour phase, likely from non-(hydrolysable) sugar molecules. Model predictions have shown that the actual pyrolysis temperature cannot exceed ca. 550 °C, which explains the invariant product distributions at higher temperatures of the heat source.Evidence is accumulating that both the distribution of the polymerization degree of the produced sugars and the mass loss rate of cellulose is determined by the interplay of chemistry, heat and unequivocally mass transfer at cell wall level. This complexity leaves models aiming at quantitative prediction of the product distribution (bio-oil composition and yield) very challenging, if not impossible. However, the heating rate of particles, the rate at which decay products escape from the particle and the quenching rate of these escaped products can be steered, making it possible to produce target products (e.g. fermentable sugar or oligo-sugars) in significant amounts from cellulose. In this way, the advantages of thermochemical processes in comparison to biotech concepts, such as high conversion rates & products not being heavily diluted with water, are combined with an increased value of the product slate. Translating the results obtained to real-world reactors and for the benefit of lignocellulosic biomass is subject of further research.
Acknowledgements
The authors would like to thank Jeroen de Graaf and Michiel van der Werff for their contribution to a part of the experimental work and to acknowledge the technical staff of the SPT group (Benno Knaken, Karst van Bree and Johan Agterhorst) for their excellent technical support.References
- L. Clément and C. Rivière, La Cellulose - et les éthers cellulosiques, Ch. Beranger, Paris et Liège, 1920 Search PubMed.
- J. Lédé, J. Anal. Appl. Pyrolysis, 2012, 94, 17–32 CrossRef.
- M. S. Mettler, D. G. Vlachos and P. J. Dauenhauer, Energy Environ. Sci., 2012, 5, 7797–7809 CAS.
- D. Mohan, C. U. Pittman and P. H. Steele, Energy Fuels, 2006, 20, 848–889 CrossRef CAS.
- S. Kersten and M. Garcia-Perez, Curr. Opin. Biotechnol., 2013, 24, 414–420 CrossRef CAS PubMed.
- S. R. G. Oudenhoven, A. G. J. van der Ham, H. van den Berg, R. J. M. Westerhof and S. R. A. Kersten, Biomass Bioenergy, 2016 DOI:10.1016/j.biombioe.2016.07.003.
- J. Lédé, F. Blanchard and O. Boutin, Fuel, 2002, 81, 1269–1279 CrossRef.
- J. Piskorz, P. Majerski, D. Radlein, A. Vladars-Usas and D. S. Scott, J. Anal. Appl. Pyrolysis, 2000, 56, 145–166 CrossRef CAS.
- X. Gong, Y. Yu, X. Gao, Y. Qiao, M. Xu and H. Wu, Energy Fuels, 2014, 28, 5204–5211 CrossRef CAS.
- Z. Wang, A. G. McDonald, R. J. M. Westerhof, S. R. A. Kersten, C. M. Cuba-Torres, S. Ha, B. Pecha and M. Garcia-Perez, J. Anal. Appl. Pyrolysis, 2013, 100, 56–66 CrossRef CAS.
- J. Rojas, A. Lopez, S. Guisao and C. Ortiz, J. Adv. Pharm. Technol. Res., 2011, 2, 144–150 CrossRef CAS PubMed.
- E. Hoekstra, W. P. M. van Swaaij, S. R. A. Kersten and K. J. A. Hogendoorn, Chem. Eng. J., 2012, 191, 45–58 CrossRef CAS.
- A. Sluiter, B. Hames, R. Ruiz, C. Scarlata, J. Sluiter and D. Templeton, Laboratory Analytical Procedure NREL/TP-510-42622, 2008 Search PubMed.
- R. J. M. Westerhof, D. W. F. Brilman, M. Garcia-Perez, Z. Wang, S. R. G. Oudenhoven, W. P. M. van Swaaij and S. R. A. Kersten, Energy Fuels, 2011, 25, 1817–1829 CrossRef CAS.
- A. Sluiter, B. Hames, R. Ruiz, C. Scarlata, J. Sluiter and D. Templeton, Laboratory Analytical Procedure NREL/TP-510-42623, 2008 Search PubMed.
- T. J. Haas, M. R. Nimlos and B. S. Donohoe, Energy Fuels, 2009, 23, 3810–3817 CrossRef CAS.
- A. R. Teixeira, K. G. Mooney, J. S. Kruger, C. L. Williams, W. J. Suszynski, L. D. Schmidt, D. P. Schmidt and P. J. Dauenhauer, Energy Environ. Sci., 2011, 4, 4306–4321 CAS.
- O. Boutin, M. Ferrer and J. Lédé, Chem. Eng. Sci., 2002, 57, 15–25 CrossRef CAS.
- A. G. W. Bradbury, Y. Sakai and F. Shafizadeh, J. Appl. Polym. Sci., 1979, 23, 3271–3280 CrossRef CAS.
- D. L. Pyle and C. A. Zaror, Chem. Eng. Sci., 1984, 39, 147–158 CrossRef CAS.
- D. S. Scott, J. Piskorz, M. A. Bergougnou, R. Graham and R. P. Overend, Ind. Eng. Chem. Res., 1988, 27, 8–15 CrossRef CAS.
- M. J. Antal, Jr. and G. Varhegyi, Ind. Eng. Chem. Res., 1995, 34, 703–717 CrossRef.
- A. K. Burnham, X. Zhou and L. J. Broadbelt, Energy Fuels, 2015, 29, 2906–2918 CrossRef CAS.
- J. Piskorz, D. Radlein and D. S. Scott, J. Anal. Appl. Pyrolysis, 1986, 9, 121–137 CrossRef CAS.
- S. R. A. Kersten, X. Wang, W. Prins and W. P. M. van Swaaij, Ind. Eng. Chem. Res., 2005, 44, 8773–8785 CrossRef CAS.
- X. Wang, S. R. A. Kersten, W. Prins and W. P. M. van Swaaij, Ind. Eng. Chem. Res., 2005, 44, 8786–8795 CrossRef CAS.
- R. G. Graham, M. A. Bergougnou and B. A. Freel, Biomass Bioenergy, 1994, 7, 33–47 CrossRef CAS.
- E. Hoekstra, R. J. M. Westerhof, W. Brilman, W. P. M. Van Swaaij, S. R. A. Kersten, K. J. A. Hogendoorn and M. Windt, AIChE J., 2012, 58, 2830–2842 CrossRef CAS.
- V. Oja and E. M. Suuberg, J. Chem. Eng. Data, 1998, 44, 26–29 CrossRef.
- S. R. G. Oudenhoven, C. Lievens, R. J. M. Westerhof and S. R. A. Kersten, Biomass Bioenergy, 2016, 89, 78–90 CrossRef CAS.
- J. Piskorz, D. S. A. G. Radlein, D. S. Scott and S. Czernik, J. Anal. Appl. Pyrolysis, 1989, 16, 127–142 CrossRef CAS.
- O. Boutin, M. Ferrer and J. Lédé, J. Anal. Appl. Pyrolysis, 1998, 47, 13–31 CrossRef CAS.
- J. P. Diebold, Biomass Bioenergy, 1994, 7, 75–85 CrossRef CAS.
- K. J. Kilzer and A. Broido, Pyrodynamics, 1965, 2, 151–163 Search PubMed.
- D. Radlein, J. Piskorz and D. S. Scott, in 6th International Conference on Biomass for Energy, Industry and Environment, ed. G. Grassi, A. Collina and H. Zibetta, Elsevier, Athens, Greece, 1991, pp. 643–649 Search PubMed.
- P. R. Patwardhan, J. A. Satrio, R. C. Brown and B. H. Shanks, Bioresour. Technol., 2010, 101, 4646–4655 CrossRef CAS PubMed.
- G. N. Richards, J. Anal. Appl. Pyrolysis, 1987, 10, 251–255 CrossRef CAS.
- R. Radlein, J. Piskorz and P. Majerski, Canada Pat., CA2165858, 1996 Search PubMed.
- J. A. Lomax, J. M. Commandeur, P. W. Arisz and J. J. Boon, J. Anal. Appl. Pyrolysis, 1991, 19, 65–79 CrossRef CAS.
- A. D. Pouwels, G. B. Eijkel, P. W. Arisz and J. J. Boon, J. Anal. Appl. Pyrolysis, 1989, 15, 71–84 CrossRef.
- D. Radlein, J. Piskorz and D. S. Scott, J. Anal. Appl. Pyrolysis, 1991, 19, 41–63 CrossRef CAS.
- O. P. Golova, Russ. Chem. Rev., 1975, 44, 687 CrossRef.
- F. Shafizadeh, R. H. Furneaux, T. G. Cochran, J. P. Scholl and Y. Sakai, J. Appl. Polym. Sci., 1979, 23, 3525–3539 CrossRef CAS.
- G. J. Kwon, D. Y. Kim, S. Kimura and S. Kuga, J. Anal. Appl. Pyrolysis, 2007, 80, 1–5 CrossRef CAS.
- M. Grønli, M. J. Antal and G. Várhegyi, Ind. Eng. Chem. Res., 1999, 38, 2238–2244 CrossRef.
- Y.-C. Lin, J. Cho, G. A. Tompsett, P. R. Westmoreland and G. W. Huber, J. Phys. Chem. C, 2009, 113, 20097–20107 CAS.
- H. B. Mayes and L. J. Broadbelt, J. Phys. Chem. A, 2012, 116, 7098–7106 CrossRef CAS PubMed.
- J. Lédé, Biomass Bioenergy, 1994, 7, 49–60 CrossRef.
- J. Lédé, J. P. Diebold, C. V. C. Peacocke and J. Piskorz, in Fast Pyrolysis of Biomass: A Handbook, ed. A. V. Bridgwater and C. V. C. Peacocke, CPL press, Newbury, 1999, vol. 1, pp. 51–65 Search PubMed.
- J. Lédé, Energies, 2010, 3, 886–898 CrossRef.
- C. Krumm, J. Pfaendtner and P. J. Dauenhauer, Chem. Mater., 2016, 28, 3108–3114 CrossRef CAS.
Footnote |
| † Electronic supplementary information (ESI) available. See DOI: 10.1039/c6re00100a |
| This journal is © The Royal Society of Chemistry 2016 |

