Environmental and economic assessment of glycerol oxidation to dihydroxyacetone over technical iron zeolite catalysts†
Received
2nd September 2015
, Accepted 3rd December 2015
First published on 21st December 2015
Abstract
The gas-phase oxidation of glycerol over MFI-type iron zeolite catalysts comprises an attractive technology to prepare dihydroxyacetone with a high productivity, in contrast with the currently practiced biocatalytic system. Herein, we address two crucial aspects in view of a prospective industrial application, i.e., the development of the technical iron zeolite-based catalysts and the environmental and economic assessment of the process by life cycle analysis. Regarding the first task, we show that iron silicalite with the desired structural, acidic and catalytic properties can be prepared by hydrothermal synthesis at the kg-scale and using reagents meeting industrial safety, ecological and cost criteria. The design of suitable mm-sized bodies encompassed the use of shaping methods which minimise the introduction of additional acidity as well as iron clustering and migration from the zeolite to the binder phase. In this respect, silica outperforms kaolin as the binder, pelletisation and polyether-assisted extrusion are superior to water-based extrusion and the calcination and steam activation of the as-crystallised zeolite are preferably done after the forming step. The optimal technical catalyst displays equivalent activity, selectivity and stability to lab-scale pure iron silicalite powder in a 72 h test. From a life cycle perspective, all environmental indicators are drastically improved and the operating cost is halved using a chemocatalytic zeolite-based process for the preparation of high-purity dihydroxyacetone compared to the conventional enzymatic route. This is justified by the high atom economy of the transformation which reduces waste and by the minimisation of the energy input via heat integration and the use of less energy-intensive separation units to purify the substantially more concentrated outlet stream. Since the purity demand for the dihydroxyacetone feedstock to produce lactic acid is lower than that required in the cosmetic and polymer industries, a potential glycerol oxidation process for the former application has an even greater advantage in terms of greenness and cost.
Introduction
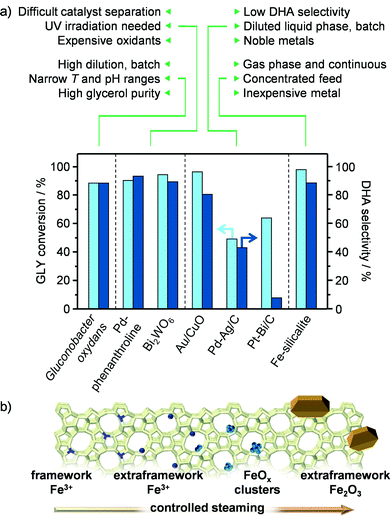
Among the various added-value chemicals that could be obtained by valorising crude glycerol (GLY) streams originating from the production of biodiesel, dihydroxyacetone (DHA) is particularly attractive. This triose is widely applied as a tanning agent in the cosmetic industry and comprises a suitable monomer for the manufacture of specialty plastics.1 Moreover, it can serve as a substrate for the preparation of an increasingly demanded commodity chemical, lactic acid (LA).2 We have recently reported on iron-containing MFI zeolites prepared by hydrothermal synthesis followed by steaming under mild conditions as novel catalysts for the gas-phase oxidation of GLY to DHA.3 These heterogeneous materials outperform supported palladium, gold and platinum in terms of activity, selectivity and stability, thus standing amongst the state-of-the-art chemocatalytic systems for this reaction (Fig. 1a).4 Still, a prospective complementation or replacement of the currently practiced low-productive technology based on the enzyme Gluconobacter oxydans5 will strongly depend on the successful scale up of the iron zeolite and on the economic attractiveness and ecological footprint of the overall process.6
 |
| | Fig. 1 (a) State-of-the-art catalysts for the oxidation of GLY to DHA and (b) iron species formed under a progressively harsher steam treatment of isomorphously substituted iron silicalite. | |
In spite of the potentially vast field of application of iron zeolites, including benzene-to-phenol reactions,7 Fenton-type oxidations8 and alkane dehydrogenation,9 only technologies for NOx decomposition have been commercialised to date.10 The catalyst used therein is prepared in large scale by solid-state ion exchange.11 Since this method generates a large fraction of iron oxide particles,12 which have been proven unselective for the preparation of DHA,3 the first step toward a technical material should encompass the scale-up of a hydrothermal synthesis procedure for an isomorphously substituted iron zeolite, which can be activated by iron displacement at extraframework positions via controlled steam treatment (Fig. 1b).13 Here attention should be paid to the utilisation of environmentally-friendly and safe precursors to the material. Thereafter, the solid has to be engineered in a form that can ease handling at the industrial site, packing of the reactor's bed and minimise pressure drops during continuous operation, while retaining the performance of the powder. The preparation of shaped zeolite catalysts has commonly been neglected by academia. Indeed, their development has been limited to the industrial environment and mostly disclosed in the patent literature.14 Specifically to iron zeolites, only techniques for the preparation of monoliths have been described, where the active iron phase was loaded onto the aluminosilicate by impregnation.15 Based on the strong dependence of side-reactions in GLY oxidation on the acidity and nature of iron species, the nature of the binder, the type of shaping method and the order of steps involved in the preparation will be the key parameters for the design of technical iron silicalite catalysts retaining the high atom economy. In particular, the use of binders, additives and/or conditions that introduce Brønsted and/or Lewis acidity or favour iron redistribution and clustering should be avoided.16 Metal ion–binder interactions have been shown to induce the migration of alkali and transition metals from MFI zeolites onto clay-type binders. Accordingly, a silica binder, which is hardly acidic and has been found to negligibly alter the metal distribution in the same zeolites upon shaping, could be more suitable.16,17 Additionally, the processing of the zeolite in its non-steamed form could limit active site modification, due to the higher stability of the metal present in the zeolite framework (Fig. 1b).
The performance of the catalytic material has great effects on the design of a GLY to DHA process and on its sustainability and economic attractiveness. In fact, the purity requirement of the GLY feedstock, the reaction conditions and the composition of the reactor's outlet stream will define the number and type of up- and downstream unit operations as well as the nature and amount of chemical auxiliaries and waste and the energy input. As recently reported,18 the conventional process requires a 3-step mild purification of crude GLY (i.e., up to 98.5 wt%), which is diluted with large amounts of water and converted at moderate temperature into a DHA-containing stream that is further purified through a series of evaporation, extractive distillation and crystallisation processes. Accordingly, while the reaction has a low energy demand, the isolation of the reactant and the product is associated with the largest ecological and economic penalties. Following an equivalent GLY purification, the chemocatalytic process will convert the triol at high temperature in the gas phase generating an aqueous stream containing 70–80 wt% DHA and gaseous CO2.3 In this case, while the reaction is expected to necessitate a higher energy input for heating, the units can be integrated to recover the heat. Additionally, the material and energy requirements of DHA separation shall be substantially alleviated, mainly because the significantly lower amounts of water enable alternative less demanding separation strategies.
Herein, we scaled up for the first time the hydrothermal synthesis of iron silicalite from the millilitre to the litre scale showing the effect on the properties of the final material of modifications applied to the synthesis procedure to meet the economic and technical parameters and comply with the ecological and safety restrictions of industrial practice. Thereafter, we identified a suitable protocol to attain functional iron zeolite bodies investigating different binders and shaping methods and unravelling their impact on the iron speciation and thus on the catalyst performance. Based on the productivity and selectivity data of the gas-phase oxidation of GLY over these solids, we modified the partial batch biocatalytic process flowsheet recently published for the conversion of crude GLY into DHA18 into a fully continuous chemocatalytic one and replaced the butanol-assisted crystallisation of DHA in the downstream purification part with a multi-effect evaporative crystallisation which does not require an additional medium. Finally, we assessed by life cycle analysis the economic and environmental footprint of this process and compared the results with those for the corresponding biocatalytic route.
Experimental
Catalysts
Pilot preparation of iron silicalite.
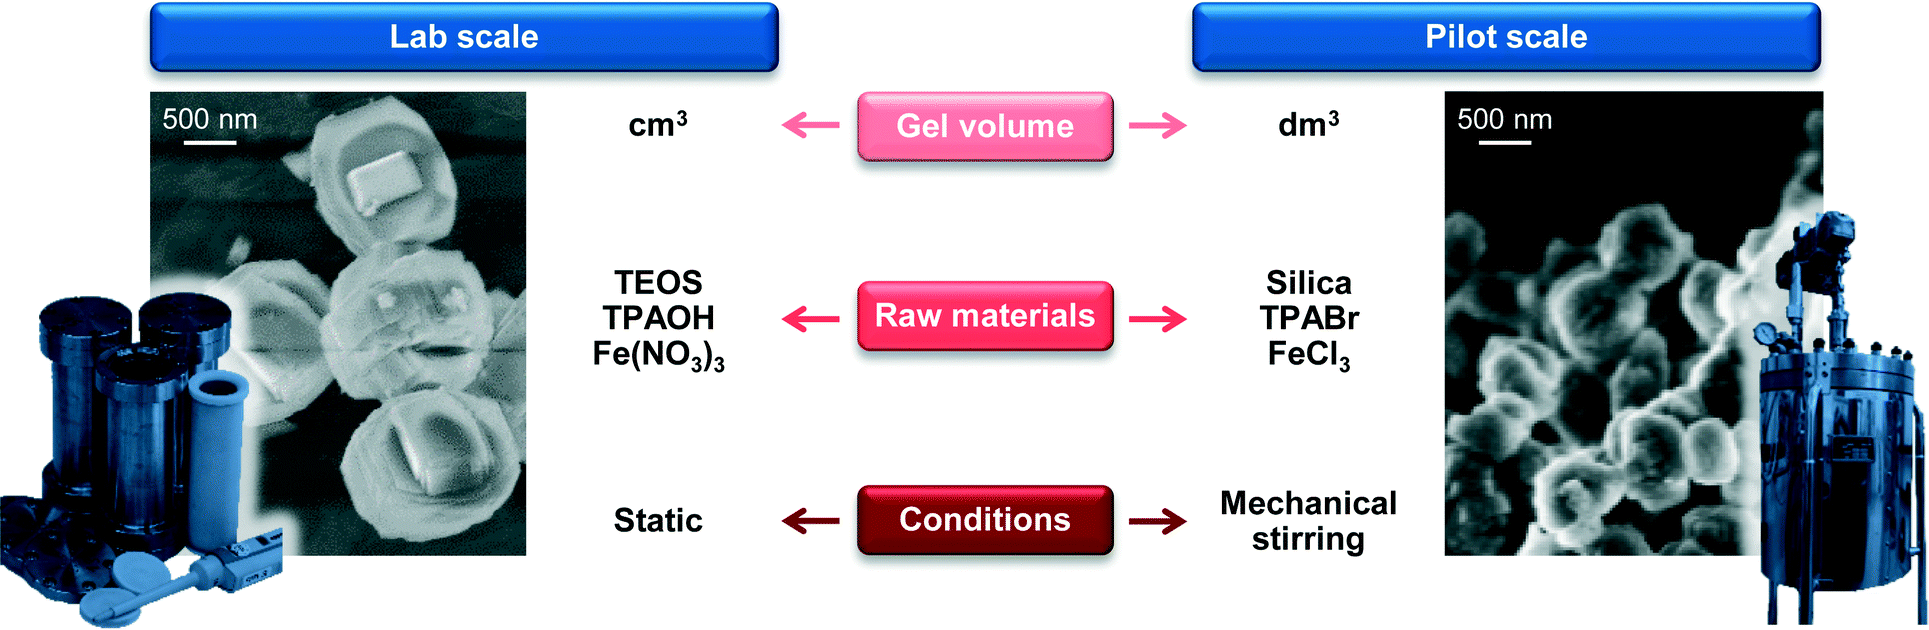
An iron-containing, aluminium-free MFI zeolite was produced by hydrothermal synthesis. The synthesis gel was prepared following a procedure described elsewhere,19 replacing tetraethyl orthosilicate by fumed silica (Sipernat), tetrapropylammonium hydroxide by tetrapropylammonium bromide (TPABr, Laporte Performance Chemicals B.V., >99%) and Fe(NO3)3·9H2O by FeCl3·6H2O (Sigma-Aldrich, 99%). Silica (111.4 g) was dispersed into an aqueous solution of NaOH (650 cm3, 2 m) and TPABr (44.7 g) for 2 h at 298 K under stirring. The dispersion was slowly added to a solution of FeCl3·6H2O (650 cm3, 0.029 m) while stirring. The resulting gel, of composition 300 SiO2/1 Fe2O3/30 TPABr/30 Na2O/3750 H2O, was placed into a 2 dm3 stainless steel autoclave (Juchheim) equipped with an oil jacket, an overhead stirrer and a sampling valve and heated at 448 K for 3 days under agitation (300 rpm). Five samples were taken every hour after the crystallisation temperature was reached. Finally, the solid was filtered, washed with deionised water (300 cm3 per gram of zeolite) and dried at 338 K for 16 h. This sample was denoted as FeS. Part of this material was calcined in static air at 823 K (5 K min−1) for 5 h (FeS-c). Thereafter, 0.5 g aliquots of the calcined material (0.2–0.4 mm sieve fraction) were activated by steaming in a 30 vol% H2O/N2 atmosphere (100 cm3 min−1) at 773–1173 K. An ‘sx’ suffix was added to the name of these samples, where x indicates the steaming temperature (e.g., FeS-cs873). In addition, a sample was prepared under static conditions in a 50 cm3 autoclave using a total gel volume of 30 cm3.
Technical catalysts.
Shaped iron zeolite-based catalysts were prepared by extrusion and pelletisation using kaolin (Sigma-Aldrich) or a 3![[thin space (1/6-em)]](https://www.rsc.org/images/entities/char_2009.gif) :2 mixture on weight basis of freeze-dried colloidal silica (Sigma-Aldrich, 40 wt% SiO2/H2O, Ludox AS-40) and fumed silica (Sipernat 120) as the binder. A sample denoted as FeS-cs-si-c was obtained by homogenising FeS-cs873 (3.00 g) and the binder (3.00 g) in the presence of ca. 7 g of water using a mechanical stirrer and extruding the obtained paste with a Mini-Screw Extruder (Caleva, 2 mm diameter). A second sample (FeS-cs-kao-c) was prepared following the same procedure using FeS-cs873 (3.00 g) and kaolin (3.00 g). These two extruded materials were hardened by heating at 823 K for 5 h (5 K min−1) in static air. Two additional catalysts were prepared by extrusion of a paste attained by mixing the non-calcined FeS zeolite (3.00 g) and the silica binder (3.00 g) with water (ca. 7 g) or poly(ethyleneglycol)–poly(propyleneglycol)–poly(ethyleneglycol) (Pluronic P123, ca. 10 g). A further sample was prepared by pelletisation (60 s, 3 × 10⁷ Pa) of a physical mixture of the FeS zeolite (3.00 g) and the silica binder (3.00 g). The three latter solids were first dried at 338 K for 16 h and then activated by calcination (823 K, 5 h) in a tubular furnace under air flow (100 cm3 min−1) and steaming at 873 K in a 30 vol% H2O/N2 atmosphere (100 cm3 min−1). They were denoted as FeS-si-cs, FeS-sip-cs and FeS-si-P-cs, in that order.
:2 mixture on weight basis of freeze-dried colloidal silica (Sigma-Aldrich, 40 wt% SiO2/H2O, Ludox AS-40) and fumed silica (Sipernat 120) as the binder. A sample denoted as FeS-cs-si-c was obtained by homogenising FeS-cs873 (3.00 g) and the binder (3.00 g) in the presence of ca. 7 g of water using a mechanical stirrer and extruding the obtained paste with a Mini-Screw Extruder (Caleva, 2 mm diameter). A second sample (FeS-cs-kao-c) was prepared following the same procedure using FeS-cs873 (3.00 g) and kaolin (3.00 g). These two extruded materials were hardened by heating at 823 K for 5 h (5 K min−1) in static air. Two additional catalysts were prepared by extrusion of a paste attained by mixing the non-calcined FeS zeolite (3.00 g) and the silica binder (3.00 g) with water (ca. 7 g) or poly(ethyleneglycol)–poly(propyleneglycol)–poly(ethyleneglycol) (Pluronic P123, ca. 10 g). A further sample was prepared by pelletisation (60 s, 3 × 10⁷ Pa) of a physical mixture of the FeS zeolite (3.00 g) and the silica binder (3.00 g). The three latter solids were first dried at 338 K for 16 h and then activated by calcination (823 K, 5 h) in a tubular furnace under air flow (100 cm3 min−1) and steaming at 873 K in a 30 vol% H2O/N2 atmosphere (100 cm3 min−1). They were denoted as FeS-si-cs, FeS-sip-cs and FeS-si-P-cs, in that order.
Characterisation
The Si and Fe contents in the samples were determined by inductively coupled plasma optical emission spectroscopy (ICP-OES) using a Horiba Ultra 2 instrument equipped with a photomultiplier tube detector. Powder X-ray diffraction (XRD) was performed using a PANalytical X'Pert PRO-MPD diffractometer with Ni-filtered Cu Kα radiation (λ = 0.1541 nm), acquiring data in the 5–70° 2θ range with a step size of 0.05° and a counting time of 8 s per step. Ar sorption at 77 K was conducted using a Micromeritics TriFlex analyser. Prior to the measurements, the samples were degassed at 573 K under vacuum for 3 h. Mercury intrusion porosimetry (MIP) was carried out using a Micromeritics Autopore IV 9510 instrument (contact angle = 140°, pressure equilibration time = 10 s). The side crush strength of the extrudates was measured using a Dr. Schleuniger Pharmatron Tablet Tester 8 M. Scanning electron microscopy (SEM) was undertaken using a Zeiss Gemini 1530 FEG microscope operated at 2 kV on Pt-coated samples (2 nm). Focused ion beam scanning electron microscopy (FIB-SEM) was performed using a Zeiss NVision 40 instrument equipped with an energy selective backscattered electron detector operated at 2 kV. Sample preparation comprised embedding of the particles in a resin (HM-20 low viscosity-epoxy, Gurit) and edge trimming by a microtome (Ultracut). Cross-sections of the embedded granules were cut by FIB and immediately imaged by SEM. Energy-dispersive X-ray (EDX) spectroscopic mapping was conducted using an FEI Quanta 200FEG microscope equipped with a silicon drift EDX detector (Ametek EDAX Apollo X). Samples were obtained by microtome trimming of resin-embedded zeolite granules, followed by FIB-polishing at a shallow incidence angle and finally coating by carbon deposition (ca. 10 nm thick layer). The SEM was operated at 5 kV, spot 5 (nominal beam current of 6 nA with an 8 nm diameter) and the EDX spectrometer using a count rate of 4000 cps, a 512 × 400 pixel map matrix, a pixel size of 32 nm, drift correction, a mapping time of ca. 10 h and hyperspectral data acquisition. The data is reported in net intensities and concentrations based on the ZAF (atomic number, absorption, fluorescence) method using a 3 × 3 pixel averaging mask. UV-vis spectroscopy was carried out in diffuse reflectance mode using an Ocean Optics Maya2000-Pro spectrometer. Spectra were collected in the 200–600 nm range, with an integration time of 150 ms and accumulating 32 scans. Prior to the analyses, the samples were degassed at 313 K under vacuum for 16 h. Diffuse reflectance infrared spectroscopy of adsorbed NO (NO-DRIFTS) was performed using a Bruker Vertex 70 spectrometer equipped with a liquid-N2-cooled mercury cadmium telluride (MCT) detector and a diffuse reflectance cell (Harrick). The samples were loaded into the cell, degassed at 573 K (5 K min−1) under He (20 cm3 min−1) for 4 h and cooled to 373 K. Then, a NO/He mixture (5.02 vol%, PanGas) was admitted and spectra were recorded in the 2300–1700 cm−1 range by accumulation of 64 scans with a resolution of 4 cm−1. Fourier transform infrared spectroscopy of adsorbed pyridine was carried out using a Bruker IFS66 spectrometer equipped with an MCT detector. Zeolite wafers (ca. 1 cm2, 20 mg) were degassed at 693 K under vacuum for 4 h, cooled to room temperature and exposed to pyridine vapours (Sigma-Aldrich, >99%). Thereafter, they were evacuated at room temperature (15 min) and at 373 K (30 min). Spectra were recorded in the 4000–1300 cm−1 range by accumulation of 632 scans with a resolution of 4 cm−1. The concentration of Brønsted- and Lewis-acid sites was determined by integration of the peaks at 1545 and 1455 cm−1 using 1.67 and 2.22 cm μmol−1 as the extinction coefficients, respectively. To evaluate the occurrence of iron migration from the zeolite to the binder, 200 mg of the zeolite and 100 mg of silica were placed at the top and bottom, respectively, of a quartz column (6 mm internal diameter), separated by quartz wool. 5 cm3 of water was percolated over the two materials five times. Then, the silica was recovered, dried at 338 K for 16 h and analysed by ICP-OES.
Catalytic evaluation
The gas-phase oxidation of GLY was studied at ambient pressure using a continuous-flow fixed-bed reactor setup, comprising (i) a syringe pump for the admission of GLY (Sigma-Aldrich, >99%),(ii) mass flow controllers for feeding N2 (PanGas, 99.99%) and O2 (PanGas, 99.9%), (iii) a tubular quartz reactor (12 mm internal diameter) heated in a furnace, (iv) a condenser immersed in an ice bath and (v) a gas bag for gas sampling. 0.20 g of catalyst (based on the zeolite) was loaded into the reactor. Extrudates were loaded as such, while a 0.2–0.4 mm sieved fraction was used in the case of catalysts in the form of powder or pellets. The volume of the bed was kept constant by addition of quartz particles (0.2–0.4 mm sieve fraction). The free space above the catalyst bed was filled with glass beads in order to facilitate the evaporation of GLY. The system was heated at the reaction temperature (623 K) under N2 flow (200 cm3 min−1). Thereafter, a 20 vol% O2/N2 gas mixture (400 cm3 min−1) was admitted along with GLY (0.048 cm3 min−1). The gas hourly space velocity (GHSV) was calculated as 24000 h−1. Liquid samples were periodically collected from the condenser, diluted by addition of known amounts of water and analysed by high-performance liquid chromatography (HPLC) using a Merck LaChrome system equipped with a HPX-87H column kept at 308 K and the refraction index and UV-vis detectors. A 0.005 M H2SO4 aqueous solution flowing at 0.600 cm3 min−1 was used as the eluent. Calibration curves were measured in the 0.1–10 wt% range using dihydroxyacetone (Merck), pyruvic acid (ABCR, 98%), pyruvaldehyde (Acros Organics, 40%), GLY (Sigma-Aldrich, 99%), glyceraldehyde (Sigma-Aldrich, >90%), acetic acid (Acros Organics, >99.7%), hydroxyacetone (Alfa Aesar, 95%), acrylic acid (Acros Organics, 99.5%), and acrolein (Fluka, >95%). CO and CO2 in the gas samples were analysed by gas chromatography using a HP5890 unit equipped with a gas-sampling valve, a Restek-Shin Carbon ST80/100 column and a thermal conductivity detector. He was used as the carrier gas. The concentrations of the carbon oxides were determined from the absolute peak areas using calibration curves. The conversion of GLY (XGLY) and selectivity to the product i (Si) were calculated as:
| XGLY = 1 − (nGLY,out/nGLY,in) |
| Si = ni,out/(nGLY,in − nGLY,out) |
where n refers to the moles of GLY or compound i and in/out to the reactor inlet/outlet. The carbon balance was calculated as the ratio between the moles of carbon in the liquid and gaseous products and the moles of carbon fed. The experimental error, determined by three repetitions of selected runs, was within 8%. No GLY conversion was observed in the blank tests, i.e., tests conducted with only quartz particles and the glass beads loaded into the reactor.
Process modelling
Two process models were considered for the production of DHA by bio- and chemocatalytic oxidation of GLY, as described hereafter. The simulation software Aspen Plus V8.6 was used for this purpose. Crude GLY was employed in both cases as the substrate, consisting of a mixture of GLY (75.8 wt%), matter organic non GLY (MONG, 9.6 wt%), water (6.0 wt%), ash (5.3 wt%) and methanol (3.3 wt%).20 In the case of the biocatalytic process, a reactor operated in batch mode was used, while in the chemocatalytic process a continuous reactor was applied. The upstream and downstream purification parts were performed in both cases in steady-state continuous mode. The waste streams were treated in conventional industrial waste water treatment plants or incineration units depending on their composition.21
Biocatalytic oxidation of GLY to DHA.
The process based on biocatalysis (BIO) was modelled as previously described.18 Briefly, it comprises: (i) purification of crude GLY (from 75.8 to 98.5 wt%) by removal of ash, methanol and MONG, (ii) fermentation of a 10 wt% GLY aqueous solution, (iii) concentration of the reaction mixture through a series of evaporation, heterogeneous azeotropic distillation using 1-butanol as the extractive medium and crystallisation of DHA from the 1-butanol solution, (iv) recovery of butanol from the crystallisation mother liquor and (v) filtering, washing and drying of the DHA crystals.
Chemocatalytic oxidation of GLY to DHA.
The complete chemocatalytic process flowsheet (CHEMO, Fig. 2) is introduced in this study and includes (i) purification of crude GLY (from 75.8 to 98.5 wt%) by removal of ash, methanol and MONG, (ii) GLY oxidation over the technical iron zeolite catalyst prepared by pelletisation in a continuous gas-phase plug-flow reactor, (iii) separation of the DHA/water-containing stream from the rest of the reaction gases (i.e., mainly by-product CO2, excess O2 and N2) by condensation under ambient conditions, (iv) five-effect evaporative crystallisation of DHA ending under vacuum (simply noted as crystallisation in Fig. 2) and recovery (97%) of pure DHA crystals and (v) washing and drying of the DHA crystals. The stream generated in step (iii) can be directly employed as feedstock for LA production.
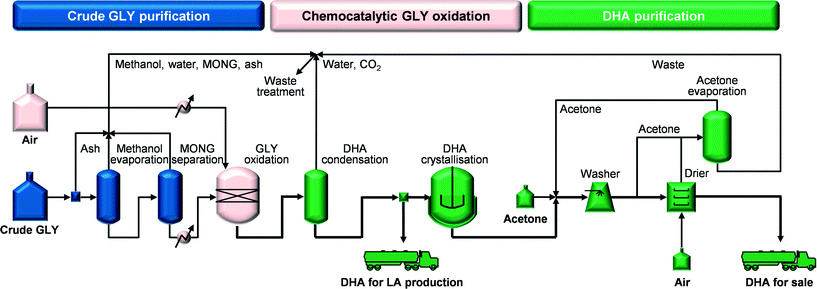 |
| | Fig. 2 Flowsheet for the chemocatalytic process for DHA production from crude GLY. | |
Heat integration was performed for the reaction part and the downstream purification part recovering heat for ca. 50% of the requirements. Specifically, in the reaction part, providing most of the heat integration potential, the heat of the reaction gases was recycled and in the downstream part, heat was recovered in the five-effect evaporation that utilises a cascade of reducing pressures and from the hot air exiting the dryer. Table 1 compiles the inventory data for the chemocatalytic process used in the life cycle environmental and economic assessment. A detailed description of this process model is provided in the ESI.†
Table 1 LCI data for the chemocatalytic production of DHA from crude GLY
| Materials and energy |
Production of pure DHA |
Production of DHA for LA |
Units |
| Crude GLY |
1.86 |
1.81 |
kg kgDHA−1 |
| Process water |
0.83 |
— |
kg kgDHA−1 |
| Catalyst |
0.002 |
0.002 |
kg kgDHA−1 |
| Air |
10.91 |
8.92 |
m3STP kgDHA−1 |
| Acetone |
0.04 |
— |
kg kgDHA−1 |
| Direct CO2 emission |
0.45 |
0.44 |
kg kgDHA−1 |
| Heat |
2.73 |
0.38 |
MJ kgDHA−1 |
| Cooling water |
294 |
238 |
kg kgDHA−1 |
| Natural gas |
1.43 |
1.39 |
MJ kgDHA−1 |
| Electricity |
1.26 |
0.96 |
MJ kgDHA−1 |
| Waste |
1.67 |
0.44 |
kg kgDHA−1 |
Environmental and economic assessment
Following the LCA methodology, the goal and scope of the environmental assessment was the comparison of the bio- and chemocatalytic processes for the production of DHA from crude GLY obtained as by-product of the biodiesel production. The functional unit for the assessment was 1 kg of utilisable DHA. This definition of the functional unit allows to compare processes where DHA is produced either as a final chemical product or in a form (e.g., the DHA/water mixture) that can be directly used for LA production. In this context, the assessment can be characterised as cradle-to-gate LCA, since obviously the use phase and end-of-life stages of DHA were not considered. For the allocation of environmental impacts to crude GLY as a co-product of the biodiesel production, we followed the approach and assumptions proposed by Weidema et al.22 Thus, crude GLY was considered as a partially utilised co-product from a consequential LCA perspective. Therefore, the respective LCA metrics calculated in this study are valid as long as the amount of GLY employed in DHA production is not restricted by the biodiesel production. For the fate of the currently not utilised glycerol, two alternative scenarios were considered: treatment in a biological waste water treatment unit or in a waste-to-energy industrial incineration unit. The displaced GLY-relevant LCA impacts for these two scenarios were calculated according to the same models used for the waste treatment of the process effluents.21Table 2 summarises the codes associated with the various scenarios for the bio- and chemocatalytic processes considered.
Table 2 Overview of the process assessment scenarios for DHA production
| Model description |
Acronym |
| Biocatalytic production of pure DHA from crude GLY destined to the incineration plant |
BIO-1A |
| Biocatalytic production of DHA for LA production from crude GLY destined to the incineration plant |
BIO-1B |
| Biocatalytic production of pure DHA from crude GLY destined to the waste water treatment plant |
BIO-2A |
| Biocatalytic production of DHA for LA production from crude GLY destined to the waste water treatment plant |
BIO-2B |
| Chemocatalytic production of pure DHA from crude GLY destined to the incineration plant |
CHEMO-1A |
| Chemocatalytic production of DHA for LA production from crude GLY destined to the incineration plant |
CHEMO-1B |
| Chemocatalytic production of pure DHA from crude GLY destined to the waste water treatment plant |
CHEMO-2A |
| Chemocatalytic production of DHA for LA production from crude GLY destined to the waste water treatment plant |
CHEMO-2B |
Based on this, three LCA metrics were calculated, namely the non-renewable cumulative energy demand (CED), the global warming potential (GWP-100a) and the eco-indicator 99 (EI99). These metrics have been reported to cover different aspects of the environmental impact23 and were also applied in previous studies.18 As done earlier, the impact of the separation of MONG on the LCA assessment was not considered neither in the environmental nor in the economic assessments because of the lack of process related data. Operating costs were calculated as the basis for an economic assessment neglecting investment costs, which lie outside of the scope of the current work. Nevertheless, all processes were modelled to attain the same productivity. Special attention was paid to ensure that the background data for the environmental and economic assessment were the same or were derived from compatible sources compared to our previous work.18 For the catalyst preparation and end-of-life treatment, it was assumed that the same costs and environmental impacts as those for the general category of zeolites are applicable. With respect to the catalyst performance, the catalytic data after 72 h on stream were used since these are the most representative in view of a technical application. For the direct CO2 emissions of the chemocatalytic process, a CO2 tax of 20 USD tCO2−1 was considered.24 The prices of the raw materials, auxiliaries and energy carriers used in the process were assumed to include the respective CO2 tax. The air feed required by the chemocatalytic process was considered to be slightly compressed (2 bar), which determined its monetary and environmental costs. Natural-gas fired furnaces were applied for covering heating loads at higher temperatures (e.g., for the gas-phase GLY oxidation reactor). All other heating loads were covered by low or medium pressure steam, while river water was sufficient for fulfilling the process cooling needs. All background data for the environmental and economic assessment are provided in the ESI.†
Results and discussion
Preparation of the technical iron silicalite-based catalysts for GLY oxidation
Scale up of the hydrothermal synthesis.
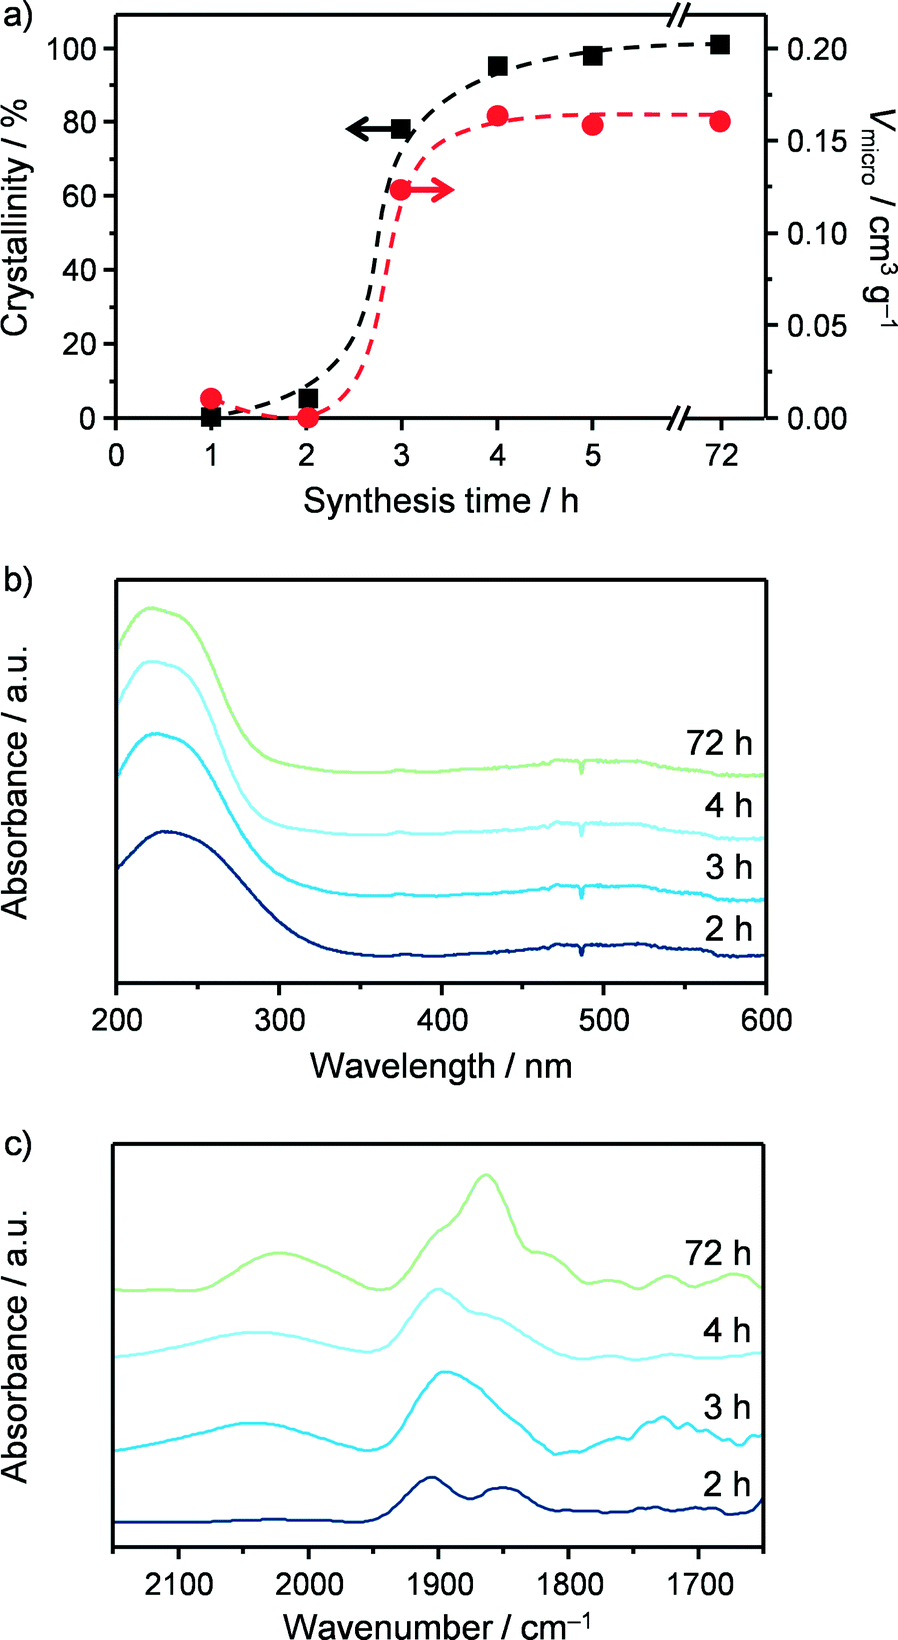
As a first step in the development of a technical catalyst, we assessed the scalability of the hydrothermal synthesis of the iron-containing MFI zeolite (Si/Fe = 150) applied in our previous study to GLY oxidation.3 This was done in collaboration with Zeochem AG, which allowed us to use their pilot infrastructure and supported us in the identification of the best compromise between environmental impact and safety based on the current regulations on these matters. A batch of zeolite was prepared using a 2 dm3 stirred reactor instead of a 30 cm3 autoclave under static conditions and industrially more suitable zeolite precursors than those reported by Ribera et al. (Fig. 3)19 for the preparation of the gel. In particular, precipitated silica was chosen instead of tetraethyl orthosilicate (TEOS) as the silicon source since a solid is easier and safer to handle than a liquid and its non-flammable nature is associated with lower hazards. Furthermore, silica provides a better atom economy than TEOS since all of the atoms present in the source are integrated in the zeolite and, last but not the least, its price is about one order of magnitude lower (ca. 1 vs. 10 USD kg−1). Although a hydroxide is a better precursor than any other salt in terms of green chemistry, TPABr was selected instead of TPAOH as the structure-directing agent in view of the lower safety hazard associated with solid substances. Finally, we opted for iron chloride instead of iron nitrate as the iron source in order to comply with the strict regulations concerning the presence of nitrates in waste waters. Samples of the gel were periodically taken during the first 5 h of the crystallisation of the material, which was interrupted after 72 h. Elemental analysis showed that the Si/Fe ratio was close to the nominal value for all of the solids (Table 3). XRD and Ar sorption, applied after calcination of the samples, indicated that the materials retrieved within the first 2 h of the crystallisation were amorphous (Fig. 4a). In contrast, the typical reflections of the MFI structure were observed in the diffractogram for the solid collected after 3 h and the adsorption isotherm evidences the presence of microporosity. This implies an induction time of about 2 h prior to a fast crystallisation for 1 h, in agreement with previous reports.25 The material obtained after 3 days exhibited equivalent textural properties to the samples collected at 3–5 h, indicating that the iron silicalite formed is stable for prolonged times under the synthesis conditions. The properties of the iron sites in the catalysts were studied by UV-vis spectroscopy (Fig. 4b) and by DRIFT spectroscopy of adsorbed NO (Fig. 4c). In the case of the amorphous samples collected at 1 and 2 h, a single broad band was observed in the UV-vis spectra, suggesting the presence of iron cations at isolated sites of different nature in the siliceous matrix.26 In the NO-DRIFT spectra, two main contributions at 1860 and 1900 cm−1 indicate mono- and dinitrosyl species on divalent Fe2+ sites.27 In line with the insensitivity of bigger iron oxide particles in Fe/S and Fe2O3/ZSM-5 to NO, this evidence supports the presence of isolated iron atoms or small FeOx clusters in these materials.3,28 All of the zeolitic samples obtained at crystallisation times longer than 3 h showed a main contribution in the UV-vis spectra centred at 250 nm, associated with the isolated iron sites with a tetrahedral geometry.26 The NO-DRIFT spectra evidenced three main bands at 1750, 1900 and 2050 cm−1 for the solid withdrawn at the onset of the crystallisation (3 h). These were attributed to Fe2+(NO) and Fe2+(NO)2 species present at highly accessible framework sites (i.e., α-sites) and to NO+ adsorbed at cationic sites, respectively.29 Upon increasing the synthesis time, the samples produced an additional band centred at 1850 cm−1 which progressively increased in intensity. This feature is assigned to Fe2+ mononitrosyl located at less accessible positions (e.g., β-sites). Although the attribution of most of these bands remains a matter of debate, NO-DRIFTS clearly indicated that iron partially redistributed to distinct extraframework positions during the course of the crystallisation but maintained its isolated nature. The scaled-up calcined iron silicalite exhibited Lewis- and, in lower amount, Brønsted-acid sites. The latter were fully depleted upon steaming at 873 K and both type of sites disappeared after the same treatment at 1173 K (Table 3). The SEM micrographs (Fig. 3) gave indication of an average particle size of about 400 nm. While all of the other properties are equivalent to those of the zeolite obtained under static conditions at a 30 cm3 scale and described in our previous publication,3 this value is 3 times smaller. Since a small scale synthesis with the reagents used upon scale up also led to big crystals, the different dimensions of the crystals are a likely consequence of the stirring in the larger vessel. The scaled up powder was tested in the aerobic oxidation of GLY at 623 K after calcination (FeS-c) and yielded 65% DHA (Table 4). After steaming at 873 K, the catalyst (FeS-cs873) was characterised by isolated iron ions and small clusters and by reduced Brønsted acidity and exhibited a greatly improved DHA selectivity (85%) and a substantially stable behaviour during 24 h on stream (Fig. 5). More pronounced iron extraction and clustering (FeS-cs1173) occurred upon steaming at 1173 K depleting the selectivity of iron sites in oxidation (41% DHA selectivity) and fostering the formation of dehydration products. These results further demonstrate that the new preparation, adapted to meet industrial requirements, yielded analogous catalysts to those previously obtained at the smaller scale.3
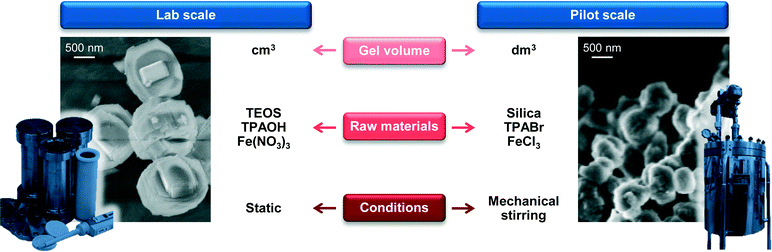 |
| | Fig. 3 Parameters to be considered in the scale-up of the hydrothermal synthesis of iron silicalite and SEM micrographs of the materials obtained at the lab and pilot scales. | |
Table 3 Characterisation data of the iron-containing catalysts
| Catalyst |
Fea(wt%) |
V
micro
(cm3 gzeolite−1) |
V
meso
(cm3 g−1) |
V
macro
(cm3 g−1) |
S
BET
(m2 g−1) |
Side crush strength (N) |
C
Brønsted
(μmol g−1) |
C
Lewis
(μmol g−1) |
|
ICP-OES.
t-Plot method, relative to the zeolite.
V
meso = Vpore − Vmicro.
Volume of Hg intruded into pores >50 nm in diameter.
BET method.
FTIR spectroscopy of adsorbed pyridine.
|
| FeS-c |
0.69 |
0.16 |
0.09 |
— |
400 |
— |
12 |
45 |
| FeS-cs873 |
0.72 |
0.14 |
0.10 |
— |
418 |
— |
0 |
50 |
| FeS-cs1173 |
0.66 |
0.13 |
0.12 |
— |
391 |
— |
0 |
5 |
| FeS-cs-kao-c |
1.07 |
0.14 |
0.04 |
0.20 |
198 |
41 |
12 |
38 |
| FeS-cs-si-c |
0.36 |
0.11 |
0.06 |
0.09 |
164 |
90 |
0 |
44 |
| FeS-si-cs |
0.37 |
0.11 |
0.06 |
0.09 |
161 |
85 |
0 |
38 |
| FeS-sip-cs |
0.32 |
0.12 |
0.05 |
0.39 |
177 |
25 |
0 |
18 |
| FeS-si-P-cs |
0.35 |
0.13 |
0.09 |
0.15 |
225 |
— |
0 |
15 |
 |
| | Fig. 4 (a) Crystallinity and micropore volume, (b) UV-vis spectra and (c) DRIFT spectra of adsorbed NO of FeS samples collected at increasing synthesis time. | |
Table 4 Steady-state performance of the FeS-based catalysts in the gas-phase oxidation of GLYa
| Catalyst |
C
GLY (%) |
S
DHA (%) |
S
PAl (%) |
S
PAc (%) |
S
other (%) |
S
CO2 (%) |
C-balance (%) |
|
GLY: glycerol, DHA: dihydroxyacetone, PAl: pyruvaldehyde, PAc: pyruvic acid, ‘other’ includes acetol, acetaldehyde, acetic acid, acrolein and acrylic acid. T = 623 K, O2/GLY = 5.6, GHSV = 24000 h−1 and t = 1.5 h.
|
| FeS-c |
100 |
65 |
2 |
1 |
1 |
23 |
92 |
| FeS-cs873 |
92 |
85 |
1 |
0 |
1 |
13 |
99 |
| FeS-cs1173 |
71 |
41 |
33 |
11 |
3 |
14 |
103 |
| FeS-cs-kao-c |
64 |
27 |
40 |
19 |
4 |
12 |
102 |
| FeS-cs-si-c |
88 |
62 |
25 |
11 |
5 |
9 |
111 |
| FeS-si-cs |
90 |
75 |
15 |
4 |
2 |
11 |
106 |
| FeS-sip-cs |
99 |
84 |
3 |
1 |
2 |
10 |
100 |
| FeS-si-P-cs |
99 |
85 |
1 |
0 |
0 |
11 |
98 |
 |
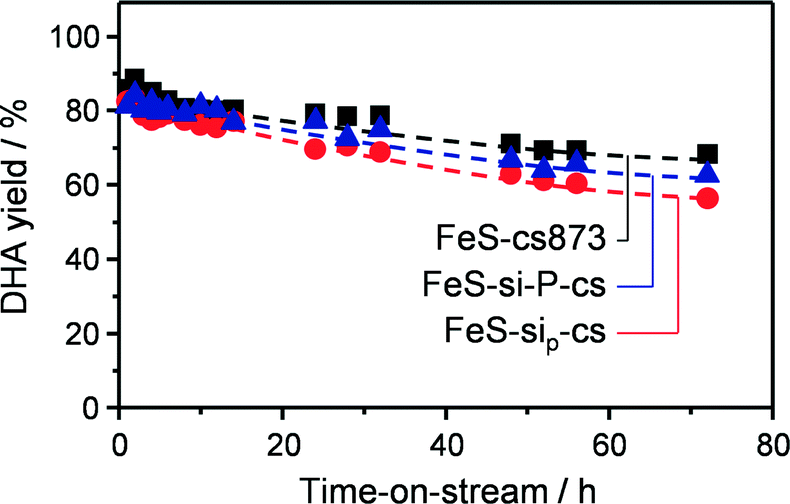
| | Fig. 5 Evolution of the DHA yield over iron zeolites in powder and technical forms as a function of the time on stream. T = 623 K, O2/GLY = 5.3 and GHSV = 24000 h−1. | |
Formulation of the technical catalysts.
The technical iron zeolite catalysts were initially prepared by extrusion of a paste comprising FeS-cs873 and kaolin or silica in the presence of water. These binders were chosen in order to contrast the effect of an inherently acidic and a neutral material, generating the samples denoted as FeS-cs-kao-c and FeS-cs-si-c, respectively. Both materials were mechanically stable, with a side crush strength of 41 and 90 N in that order (Table 3). Ar sorption showed that the accessibility to the microporous network of the zeolite was fully maintained when kaolin was used, while it became slightly hindered with silica. The macroporosity determined by MIP was lower in the case of the silica-bound material, due to the small particle size of the binder. With respect to the acidic properties, the FeS-cs-kao-c extrudates exhibited a higher and lower concentration of Brønsted- (12 μmol g−1) and Lewis-acid sites (38 μmol g−1), respectively, than the zeolite powder steamed at the same temperature (Table 3). The former finding is attributed to the contribution of the silicoaluminate clay30 and the latter to the dilution of the zeolite, which comprises only half of the mass of the technical material. In the case of the extrudates prepared using silica as the binder, no Brønsted acidity was detected, but they featured an equivalent concentration of Lewis-acid sites (44 μmol g−1) with respect to the zeolite powder. Since the silica used has no acidic character, Lewis acidity developed upon shaping to some extent. The UV-vis spectra (Fig. 6a) of the two materials show a broad contribution in the visible region in addition to the band at 250 nm, indicative of the presence of iron oxide particles besides the isolated iron sites. In the NO-DRIFT spectra (Fig. 6b), peaks at 1850 and 1900 cm−1 were observed for both technical solids and are consistent with those evidenced in the analysis of FeS-cs873,3 uncovering the presence of isolated iron species mostly located in the zeolite matrix. For FeS-cs-kao-c, a further absorption due to NO+ adsorbed on cationic sites was visualised at ca. 2100 cm−1, which is in line with the Brønsted-acidic properties of this catalyst. While no conclusion can be drawn on the nature of the iron sites for FeS-cs-kao-c due to the rather large amounts of iron impurities present in the clay (ca. 5000 ppm), the spectroscopic data indicate strong redistribution and clustering of iron in FeS-cs-si-c, which might explain the increased Lewis acidity as well. This was confirmed by an experiment in which water was percolated through a zeolite bed followed by a silica bed indicating that 15% of the iron leached and was trapped by the binder. Additionally, TEM-EDX (Fig. 7a) visualised the presence of iron not only on the zeolite but also on the binder in high amounts. Mobile iron species might preferably comprise the Fe3+ atoms already present at extraframework positions. Still, it cannot be excluded that framework iron cations are also extracted, especially if the process is facilitated by incorporation of silicon atoms provided by the binder at the grain boundaries between the two phases, similarly to what was observed for aluminium in the shaping of ZSM-5 with SiO2 or TiO2.31 Upon catalytic testing, FeS-cs-kao-c showed high activity in dehydration side-reactions (40% selectivity to pyruvaldehyde and 19% to pyruvic acid), while the DHA selectivity was limited to only 27%. These results can be explained by the Lewis and Brønsted acidity of kaolin, which can catalyse the formation of acetol from GLY, which can in turn be dehydrogenated to pyruvaldehyde and oxidised to pyruvic acid,32 as well as the dehydration of DHA to pyruvaldehyde.33 Moreover, the presence of iron oxide particles in FeS-cs-kao-c lowers the selective oxidation character of the catalyst, thereby favouring the dehydration pathways.3 The silica-containing catalyst was significantly more selective towards DHA although displaying inferior performance compared to the sole zeolite (62 vs. 85%), likely due to the formation of less effective iron sites upon the redistribution of the metal.
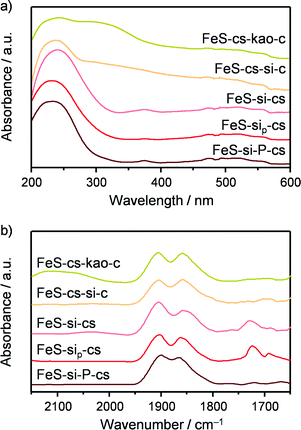 |
| | Fig. 6 (a) UV-vis spectra and (b) DRIFT spectra of adsorbed NO of the FeS-based technical catalysts. | |
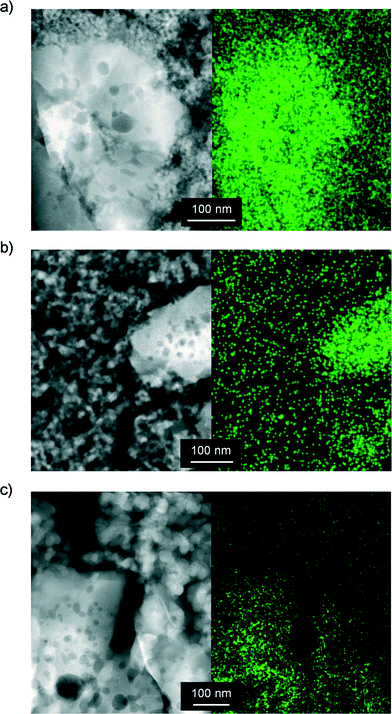 |
| | Fig. 7 TEM micrographs (left) and the corresponding iron mapping by EDXS (right) of (a) FeS-cs-si-c, (b) FeS-si-cs and (c) FeS-sip-cs. | |
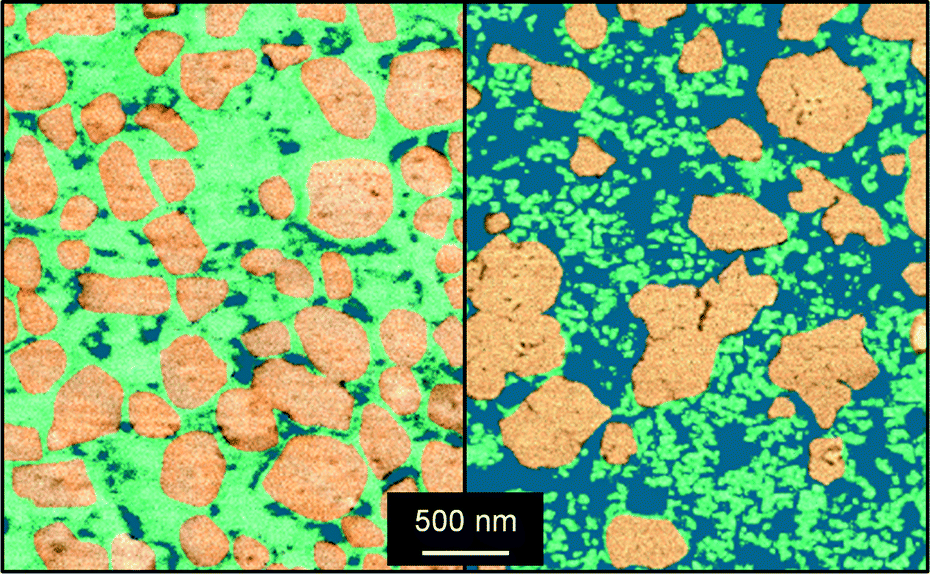
In order to minimise the migration of iron species in the preparation of the better silica-containing catalyst, we conceived to delay the calcination and activation of the zeolite until after the forming procedure. Indeed, iron majorly present at framework positions is expected to be more stable upon shaping than the extraframework iron species. Furthermore, the presence of the template in the micropores can inhibit its diffusion out of the zeolite crystal in the water medium. Thus, the as-crystallised iron silicalite was extruded in the presence of the silica and then subjected to the treatments aimed at removing the template and generating the suitable extraframework iron sites. This sample (FeS-si-cs) exhibited analogous mechanical and porous properties with respect to FeS-cs-si-c but with a slightly lower Lewis acidity. Iron comprised the isolated ions at different positions or small clusters, as suggested by spectroscopic investigation (Fig. 6). Thus, its dispersion was preserved to a greater extent in this case. Nevertheless, a percolation study with this material indicated that 6% of iron was displaced to the silica and TEM-EDX (Fig. 7b) still detected the presence of iron on the silica particles, although in a lower amount compared to the FeS-cs-si-c catalyst. In line with the lower degree of redistribution and clustering compared to FeS-cs-si-c, the DHA selectivity of this material was higher (75%).
Since this strategy was only partially successful, we thought to completely avoid the use of water in the extrusion procedure and replace it by a polyether. The material produced (FeS-sip-cs) featured a higher macropore volume in comparison with FeS-si-cs, which is the likely reason of its poorer mechanical stability (Table 3). Large macropores were also observed between the zeolite particles in the FIB-SEM images of the former sample (Fig. 8). Nevertheless, accessibility to the micropores was lower than in the case of the zeolite powder, due to the partial blocking by the small binder particles, but higher compared with the other materials shaped in the presence of water. The sample exhibited decreased Lewis acidity, while the iron distribution resembled that of FeS-si-cs. No iron could be detected by TEM-EDX on the binder particles (Fig. 7c). Upon catalytic testing, this material led to a DHA yield comparable to that of the powder (Table 4). Furthermore, its selectivity decreased only slightly during the 72 h test. These results demonstrate the possibility of preparing the material in technical form retaining its performance.
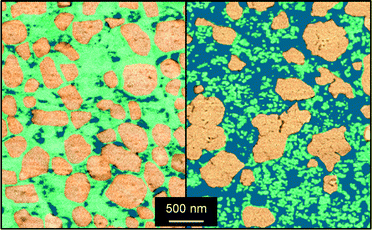 |
| | Fig. 8 FIB-SEM micrographs of FeS-si-cs (left) and FeS-sip-cs (right). | |
Pelletisation was explored as an alternative and possibly more industrially relevant shaping method. In fact, it does not require the use of water nor that of a polymer, which has to be removed by calcination, therefore leading to a simpler, greener and cheaper preparation. In this case, the micropore accessibility of the zeolite was preserved (Table 3) and the resulting material displayed mild acidic properties, compared to those of the steamed zeolite powder. Iron sites of isolated nature were evidenced by the spectroscopic techniques (Fig. 6). These features led to a powder-like DHA selectivity (85%) and a low activity towards dehydration reactions. Also this material was stable for 72 h on stream with a minor decrease in DHA selectivity. The growing formation of pyruvaldehyde with time on stream suggests that moderate iron clustering might occur under the reaction conditions. This was confirmed by the higher intensity of the broad band centred at 350 nm in the UV-vis spectrum of the used catalyst (Fig. S1†).
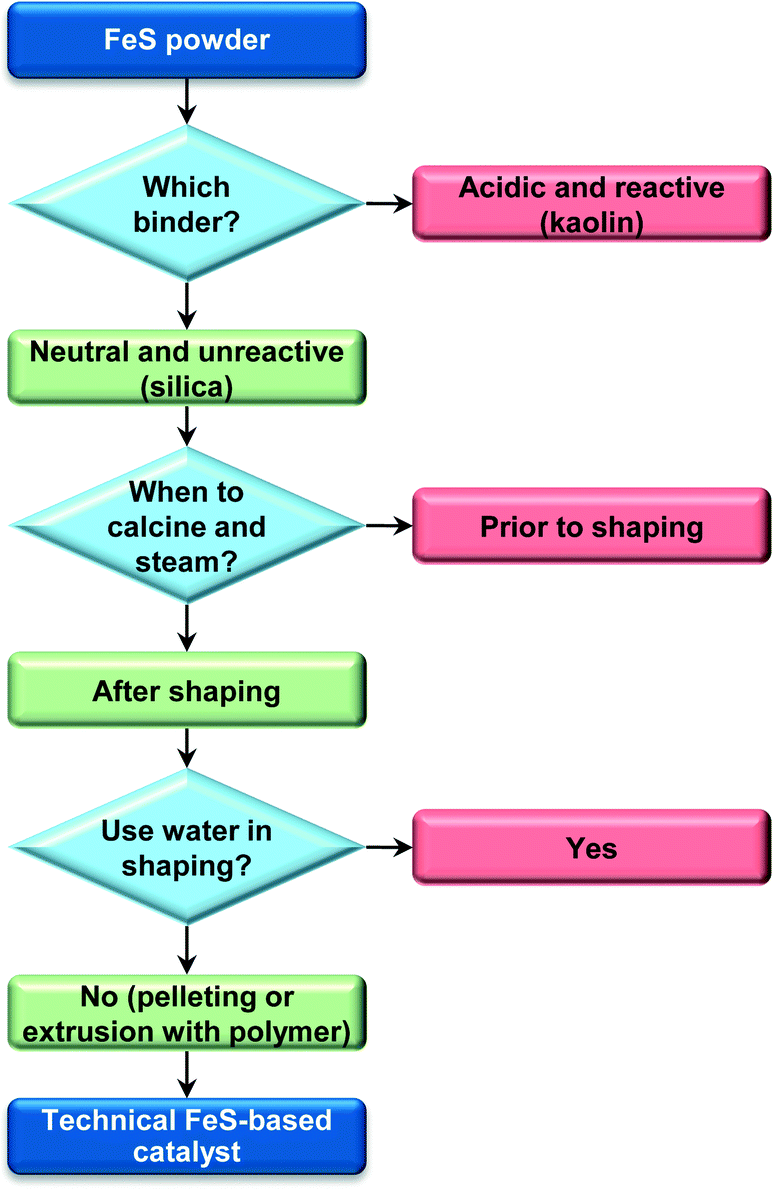
Scheme 1 summarises the critical aspects that guided the design of these technical catalysts based on iron zeolites. In view of its performance and environmentally- and industrially-friendly preparation, the pelletised material was selected to serve as the basis of the chemocatalytic process hereon assessed by LCA. In this respect, two distinct scenarios were considered both for the bio- and the chemocatalytic cases, i.e., differing on the degree of purity of the DHA gathered at the end of the process. Specifically, besides the high-grade DHA that can be used in the cosmetic and polymer industries, a DHA feed of lower purity was also targeted, since the DHA-rich aqueous condensate obtained at the outlet of the gas-phase reactor proved to be a suitable feed, after a 15-fold dilution with methanol, for the production of methyl lactate (ML) by isomerisation–esterification over tin-containing MFI zeolites. As shown in Fig. S2,† the temporal evolution of the ML yield in a continuous experiment in a fixed-bed reactor resembles that previously reported for the conversion of a pure DHA methanolic solution,34 indicating the negligible impact of the water and impurities remaining in the system. This result is not surprising in view of the fact that pyruvaldehyde comprises an alternative substrate for ML formation and LA generated by water can be easily esterified under the reaction conditions with the excess methanol.
 |
| | Scheme 1 Steps in the preparation of the technical FeS-based catalysts. | |
Process assessment
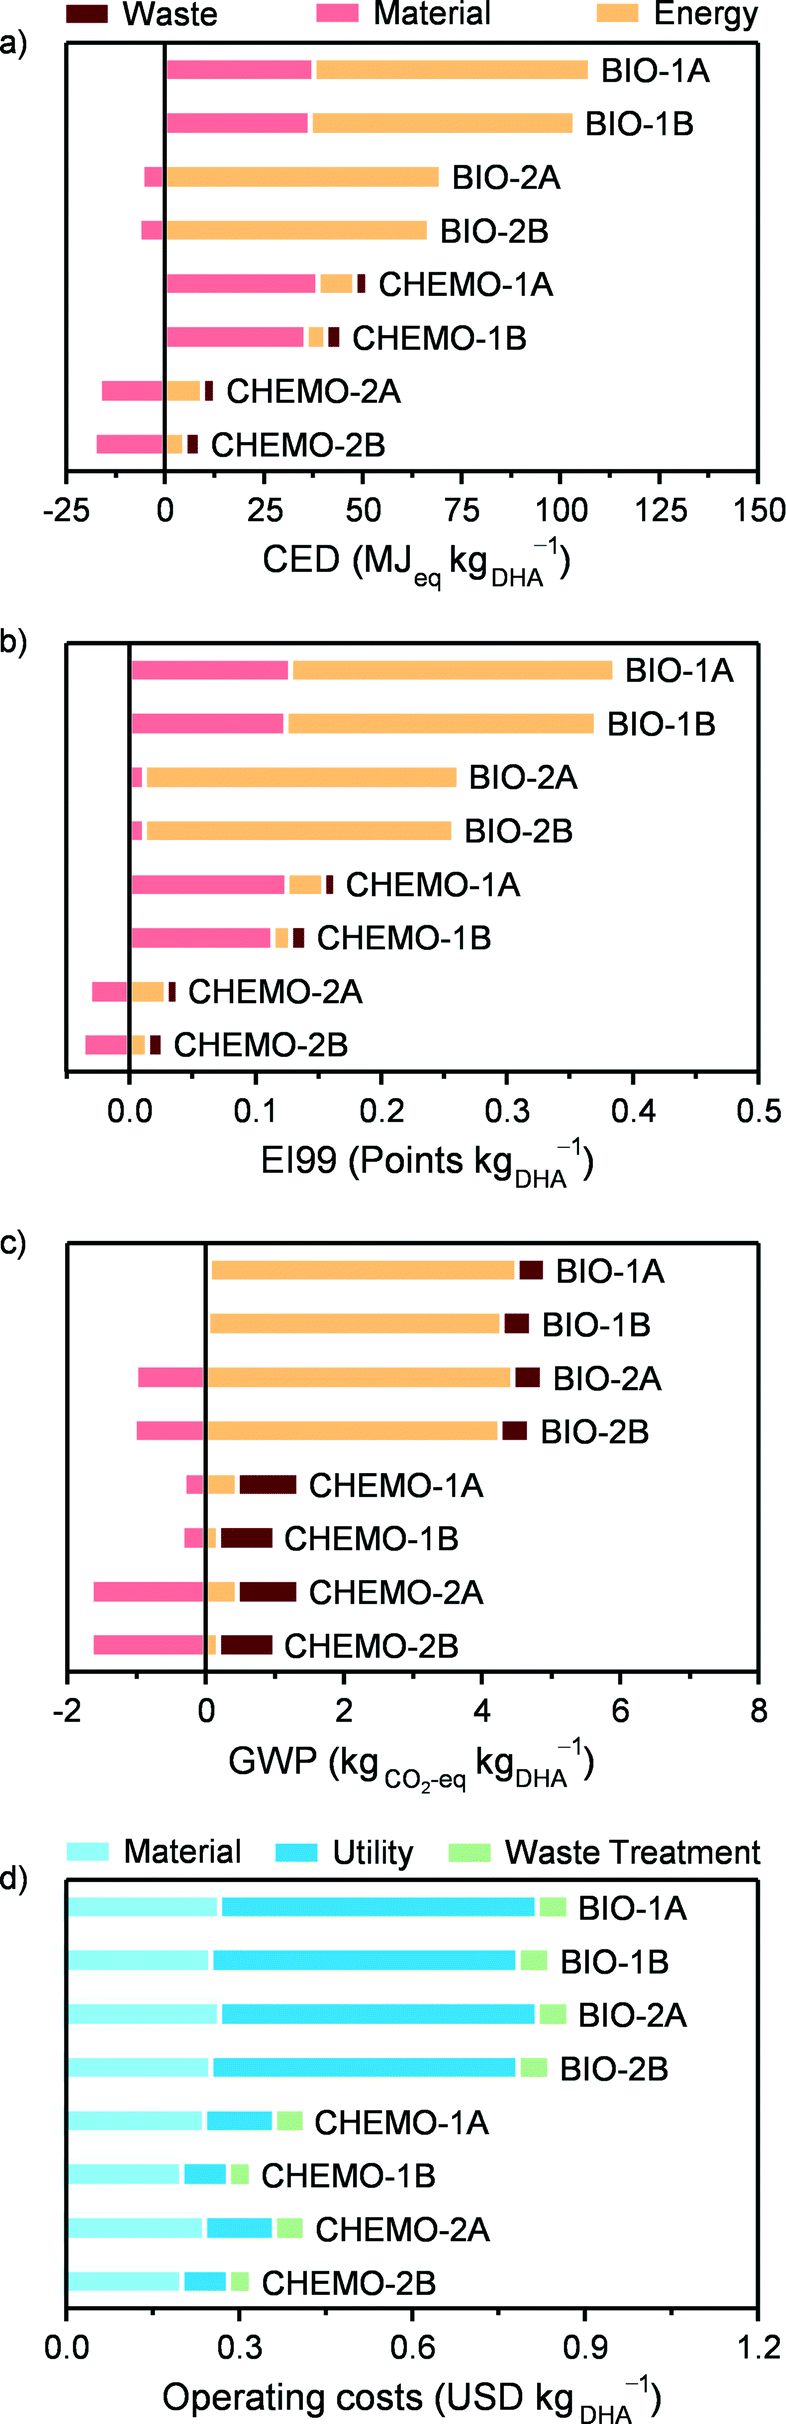
Since one of the main drivers for a biobased production of chemicals is to decrease the dependence on non-renewable fossil resources, the non-renewable CED comprises a suitable LCA metric to compare the process options for the production of 1 kg of utilisable DHA, as presented in Fig. 9a. In this context, the environmental impact of the chemocatalytic scenarios is in all cases significantly lower compared to that of the biocatalytic ones. In particular, if the alternative fate of glycerol is the treatment in waste water treatment plants, the environmental impact of the chemocatalytic cases (CHEMO-2A and CHEMO-2B) attains even negative CED values (i.e., −3.8 and −8.8 MJeq kgDHA−1, respectively). This indicates that using GLY to produce pure DHA or a DHA stream to be employed in the production of LA has a smaller impact than treating crude glycerol as a conventional waste (approximately 10 MJeq kgGLY−1). The respective gate-to-gate CED impacts are 14.7 and 9.2 MJeq kgDHA−1 for the pure DHA and the DHA for LA products. As expected, if at least the energy content of the crude glycerol stream is valorised in waste-to-energy incineration plants (CHEMO-1A and CHEMO-1B), positive CED values are found (51.4 and 44.7 MJeq kgDHA−1, respectively), which are, however, still lower than any of the biocatalytic process assessment scenarios.
 |
| | Fig. 9 Cradle-to-gate LCA according to (a) the non-renewable CED metric, (b) the EI99 index, (c) the GWP and (d) operating costs for various process layout scenarios. | |
Looking at the categories contributing to the environmental impact, it is clear that the main difference lies in the energy consumption of the processes. This is large and mainly due to the downstream separation part in the biocatalytic process and comparatively very small and associated with the reaction for the chemocatalytic route. The reason why the separation of DHA in the latter case is less demanding is the much higher concentration of the DHA stream at the reactor outlet, which, in spite of the high solubility of DHA in water, still enables its recovery by an evaporative crystallisation.
In the chemocatalytic process, heat integration reduced the thermal energy consumption by ca. 50% compared to the situation where all thermal energy loads are provided by external energy utilities. The largest fraction of heat is recovered in the reaction section of the flowsheet, in particular from the hot gas stream exiting the reactor. However, heat integration is not the main factor responsible for the lower energy consumption of the chemocatalytic process, which lies in the range of 0.38 to 2.73 MJ kgDHA−1 (Table 1) or of 0.6 to 4.3 MJeq kgDHA−1 in terms of the CED, and, even if doubled (i.e., in the not heat integrated case), remains considerably smaller than for the biocatalytic process. The enzymatic route does not present the same heat integration potential due to the generally lower temperatures of the process. Therefore, the difference between the bio- and the chemocatalytic technologies would not be substantially altered even if heat integration was applied to the former.
Similar trends were observed for the EI99 and GWP metrics (Fig. 9b and c). A qualitative difference in the categories determining the overall GWP values is that the waste is also significant for the overall impact of the chemocatalytic process due to its direct CO2 emissions. Still, in all the cases, the chemocatalytic technology is environmentally more favourable. Finally, it should be noted that the additional impact for producing pure DHA as a final product compared to DHA for LA production is in all the cases minor.
Fig. 9d presents the operating costs for the biocatalytic and chemocatalytic processes, which are in the range of 0.8–0.9 and 0.3–0.4 USD kgDHA−1, respectively. The halved costs associated with the alternative scenarios are a direct consequence of their significantly lower consumption of energy utilities. If DHA is used for LA production, these savings provide a higher profitability margin, and, therefore, more chances to compete with the conventional industrial LA production from glucose. Based on process modelling and the literature data, the operating costs of the latter process have been estimated at 1.8 USD kgLA−1.10 This gives a margin of approximately 0.9 USD kgLA−1 starting from DHA produced via the biocatalytic route, considering a mass yield of LA to DHA of 90%. The chemocatalytic route increases it to 1.4 USD kgDHA−1, providing an even more promising alternative for LA production. This margin can be important, for example, in the case of increasing glycerol prices. Additionally, one has to consider the different technology readiness levels between the industrial LA production and the processes presented here, as well as that the investment costs have not been included. In this respect, the fact that the chemocatalytic DHA production process operates in continuous mode provides a clear advantage compared to the process alternatives operating in batch mode. The environmental and economic assessment results also indicate directions for further improvement for the biocatalytic process, for instance, by developing less intensive separation strategies for the downstream part and efficient integration with processes providing excess heat in a biorefinery concept.
Conclusions
In this study, we assessed by life cycle analysis the ecological impact and operating costs associated with the production of dihydroxyacetone from crude glycerol according to a chemocatalytic process based on iron zeolites. In order to obtain practically relevant results, we firstly verified that the catalyst could be scaled up. Performing the synthesis at the litre scale using safer, more environmentally-friendly and cheaper precursors than those reported in lab recipes led to a powder displaying the same properties as the material obtained at the millilitre scale. Subsequently, shaped zeolite bodies were prepared by extrusion. Using inert binders, avoiding water in the processing and conducting the zeolite activation after forming enabled to minimise the agglomeration of iron and the increase of acidity, thus providing technical bodies exhibiting equivalent performance and atom economy to the pure zeolite powder. A comparable result was achieved using pelletisation of a silica–zeolite dry mixture as an alternative greener shaping method. A crude glycerol-to-dihydroxyacetone process based on these optimised mm-sized catalysts was modelled following strategies to further maximise its sustainability such as heat integration and the selection of less energy-demanding separation methods. Its assessment by life cycle analysis uncovered a significantly lower environmental footprint (e.g., −60 to 70% CO2 emissions and −45 to 50% energy consumption) for the production of both pure dihydroxyacetone and dihydroxyacetone suitable as feed for the preparation of lactic acid in comparison with the conventional technology based on enzymes. These aspects, along with the halved operating costs, highlight the strong potential of iron zeolite-mediated glycerol oxidation for an industrial implementation.
Acknowledgements
This work was funded by the Swiss National Science Foundation (Project No. 200020–159760). Zeochem AG and the Scientific Center for Optical and Electron Microscopy (ScopeM) at ETH Zurich are thanked for access to their facilities and Dr. S. Mitchell and S. Thirumalai for conducting the microscopic analyses.
References
- A. N. Zelikin, P. N. Zawaneh and D. Putnam, Biomacromolecules, 2006, 7, 3239 CrossRef CAS PubMed
 .
.
- M. Dusselier, P. Van Wouwe, A. Dewaele, E. Makshina and B. F. Sels, Energy Environ. Sci., 2013, 6, 1415 CAS .
- G. M. Lari, C. Mondelli and J. Pérez-Ramírez, ACS Catal., 2015, 5, 1453 CrossRef CAS .
-
(a) S. Carrettin, P. McMorn, P. Johnston, K. Griffin and G. J. Hutchings, Chem. Commun., 2002, 696 RSC ;
(b) A. Villa, C. Campione and L. Prati, Catal. Lett., 2007, 115, 133 CrossRef CAS ;
(c) H. Kimura, K. Tsuto, T. Wakisaka, Y. Kazumi and Y. Inaya, Appl. Catal., A, 1993, 96, 217 CrossRef CAS ;
(d) R. Garcia, M. Besson and P. Gallezot, Appl. Catal., A, 1995, 127, 165 CrossRef CAS ;
(e) S. Hirasawa, Y. Nakagawa and K. Tomishige, Catal. Sci. Technol., 2012, 2, 1150 RSC .
- D. Hekmat, R. Bauer and J. Fricke, Bioprocess Biosyst. Eng., 2003, 26, 109 CrossRef CAS PubMed .
- A. Azapagic, Chem. Eng. J., 1999, 74, 1 CrossRef .
- G. I. Panov, G. A. Sheveleva, A. S. Kharitonov, V. N. Romannikov and L. A. Vostrikova, Appl. Catal., A, 1992, 82, 31 CrossRef CAS .
-
(a) G. Centi, S. Perathoner, T. Torre and M. G. Verduna, Catal. Today, 2000, 55, 61 CrossRef CAS ;
(b) S. Navalon, M. Alvaro and H. Garcia, Appl. Catal., B, 2010, 99, 1 CrossRef CAS .
- R. Bulánek, B. Wichterlová, K. Novoveská and V. Kreibich, Appl. Catal., A, 2004, 264, 13 CrossRef .
-
(a) J. Pérez-Ramírez, F. Kapteijn, G. Mul and J. A. Moulijn, Chem. Commun., 2001, 693 RSC ;
(b)
M. Schwefer, R. Siefert and M. Groves, US Pat. 20080241034, 2008 Search PubMed ;
(c)
R. Maurer, M. Schwefer and T. Turek, EU Pat. 1261547, 2002 Search PubMed .
-
S. Hurgobin, A. Tissler, A. Raghunandan, A. Jambor, R. Rakoczy and R. Althoff, US Pat. 9018120, 2015 Search PubMed .
- M. Iwasaki, K. Yamazaki, K. Banno and H. Shinjoh, J. Catal., 2008, 260, 205 CrossRef CAS .
- J. Pérez-Ramírez, F. Kapteijn, J. C. Groen, A. Doménech, G. Mul and J. A. Moulijn, J. Catal., 2003, 214, 33 CrossRef .
- S. Mitchell, N.-L. Michels and J. Pérez-Ramírez, Chem. Soc. Rev., 2013, 42, 6094 RSC .
-
(a)
S. H. Swaroop and R. R. Wurisika, EU Pat. 0756891, 1997 Search PubMed ;
(b)
K. Ohno, M. Kunieda and T. Ido, EU Pat. 2123614, 2009 Search PubMed .
- N.-L. Michels, S. Mitchell and J. Pérez-Ramírez, ACS Catal., 2014, 4, 2409 CrossRef CAS .
-
(a) A. Uguina, J. L. Sotelo and D. P. Serrano, Appl. Catal., 1991, 76, 183 CrossRef ;
(b) K. Honda, X. Chen and Z.-G. Zhang, Appl. Catal., A, 2008, 351, 122 CrossRef CAS .
- M. Morales, P. Y. Dapsens, I. Giovinazzo, J. Witte, C. Mondelli, S. Papadokonstantakis, K. Hungerbühler and J. Pérez-Ramírez, Energy Environ. Sci., 2015, 8, 558 CAS .
- A. Ribera, I. W. C. E. Arends, S. de Vries, J. Pérez-Ramírez and R. A. Sheldon, J. Catal., 2000, 195, 287 CrossRef CAS .
- C. F. Hansen, A. Hernandez, B. P. Mullan, K. Moore, M. Trezona-Murray, R. H. King and J. R. Pluske, Anim. Prod. Sci., 2009, 49, 154 CrossRef CAS .
- C. Rerat, S. Papadokonstantakis and K. Hungerbühler, J. Air Waste Manage. Assoc., 2013, 63, 349 CAS .
- B. Weidema, J. Ind. Ecol., 2001, 4, 11 CrossRef .
- G. Wernet, S. Conradt, H. P. Isenring, C. Jimenez-Gonzalez and K. Hungerbühler, Int. J. Life Cycle Assess., 2010, 15, 294 CrossRef CAS .
-
http://www.carbontax.org/where-carbon-is-taxed/, retrieved July 2015 .
- J. A. Melero, G. Calleja, F. Martínez, R. Molina and K. Lázár, Microporous Mesoporous Mater., 2004, 74, 11 CrossRef CAS .
- Y. Yafet and C. Kittel, Phys. Rev., 1952, 87, 290 CrossRef CAS .
- K. Segawa, Y. Chen, J. E. Kubsh, W. N. Delgass, J. A. Dumesic and W. K. Hall, J. Catal., 1982, 76, 112 CrossRef CAS .
- H. J. Cho, C.-C. Chang and W. Fan, Green Chem., 2014, 16, 3428 RSC .
-
(a) G. Mul, J. Pérez-Ramírez, F. Kapteijn and J. A. Moulijn, Catal. Lett., 2002, 80, 129 CrossRef CAS ;
(b) K. Krishna, G. B. F. Seijger, C. M. van den Bleek, M. Makkee, G. Mul and H. P. A. Calis, Catal. Lett., 2003, 86, 121 CrossRef CAS ;
(c) H.-Y. Chen, El.-M. El-Malki, X. Wang, R. A. van Santen and W. M. H. Sachtler, J. Mol. Catal. A: Chem., 2000, 162, 159 CrossRef CAS .
- D. H. Solomon, J. D. Swift and A. J. Murphy, J. Macromol. Sci., Chem., 1971, 5, 587 CrossRef .
- P. Gelin and T. Des Courières, Appl. Catal., 1991, 72, 179 CrossRef CAS .
- F. de Clippel, M. Dusselier, R. Van Rompaey, P. Vanelderen, J. Dijkmans, E. Makshina, L. Giebeler, S. Oswald, G. V. Baron, J. F. M. Denayer, P. P. Pescarmona, P. A. Jacobs and B. F. Sels, J. Am. Chem. Soc., 2012, 134, 10089 CrossRef CAS PubMed .
- B. Katryniok, S. Paul and F. Dumeignil, ACS Catal., 2013, 3, 1819 CrossRef CAS .
-
(a) J. Dijkmans, D. Gabriels, M. Dusselier, F. de Clippel, P. Vanelderen, K. Houthoofd, A. Malfliet, Y. Pontikes and B. F. Sels, Green Chem., 2013, 15, 2777 RSC ;
(b) P. Wolf, C. Hammond, S. Conrad and I. Hermans, Dalton Trans., 2014, 43, 4514 RSC ;
(c) C. M. Osmundsen, M. S. Holm, S. Dahl and E. Taarning, Proc. R. Soc. A, 2012, 468, 2000 CrossRef CAS ;
(d) P. P. Pescarmona, K. P. F. Janssen, C. Delaet, C. Stroobants, K. Houthoofd, A. Philippaerts, C. De Jonghe, J. S. Paul, P. A. Jacobs and B. F. Sels, Green Chem., 2010, 12, 1083 RSC .
Footnote |
| † Electronic supplementary information (ESI) available: UV-vis spectrum of the spent technical catalyst, process information for modelling the chemocatalytic DHA production from GLY and background data for the environmental and economic assessment. See DOI: 10.1039/c5re00090d |
|
| This journal is © The Royal Society of Chemistry 2016 |
Click here to see how this site uses Cookies. View our privacy policy here.