Pitfalls and benefits of in situ and operando diffuse reflectance FT-IR spectroscopy (DRIFTS) applied to catalytic reactions
F. C.
Meunier
Institut de Recherches sur la Catalyse et l'Environnement de Lyon (IRCELYON), Université Lyon 1, CNRS 2, Av. Albert Einstein F-69626 Villeurbanne, France. E-mail: fcm@ircelyon.univ-lyon1.fr; Fax: +33 4 72 44 53 65
First published on 8th December 2015
Abstract
This paper discusses procedures and conditions that need to be fulfilled to be able to carry out appropriate in situ and operando diffuse reflectance FT-IR (DRIFTS) analyses. Spectrum handling and precise control of experimental parameters have a significant importance, even when only qualitative information is sought. In many cases, quantitative data can be obtained, such as surface species concentrations and heats of adsorption. Transient kinetics can help characterize spectator species and potential reaction intermediates. Direct information on the state of the catalyst surface can also be obtained, for instance regarding the alloying state of multimetallic catalysts.
1 Outline
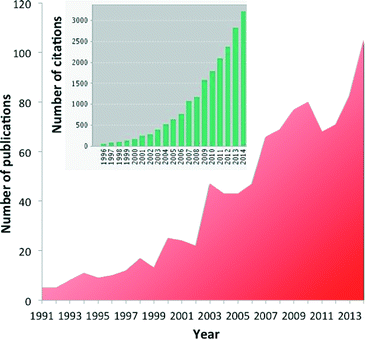
Diffuse reflectance FT-IR spectroscopy (DRIFTS) is an ever more popular tool to investigate heterogeneous catalysts and reactions in the in situ or operando mode.1–9 More than 100 papers are now yearly published relating to DRIFTS and in situ or operando techniques, and more than 3000 citations refer to those papers (Fig. 1).This interest is due to the availability of a number of affordable commercial cells,10 the possibility of building custom-made devices11–13 and the relative ease with which experiments are carried out and the possibility of coupling this technique with other spectroscopies such as X-ray spectroscopy14–17 and X-ray diffraction.18,19 Powdered catalysts can be directly used, reducing the chance of external transport limitations as compared to transmission IR.20
The DRIFTS technique can bring valuable information in terms of the nature and concentration of the species present at the surface of the catalysts and also, in some circumstances, the state of the surface on which these adsorbates are located. Ideally, quantitative analyses based on the steady-state reactivity of adsorbates should be carried out to attempt to match the surface species decomposition rate to that of the formation of the reaction products.6,7
There are yet a number of pitfalls that should be avoided if accurate and representative data are to be collected, and this review highlights a number of crucial points, from spectrum handling to reaction cell design, using examples mostly from the work of the author. Note that the fundamental of DRIFTS are detailed elsewhere21–24 and are not dealt with here. Successful applications in the determination of the role of surface species (e.g. spectators or potential reaction intermediates), the strength of bonding between the surface and the adsorbate and the state of the surface (e.g. alloy or segregated phases) will be briefly presented.
2. DRIFTS spectrum collection: reference spectrum and optical path length
A reference (single beam “background”) spectrum preferably of a non-absorbing matrix (e.g. KBr, MgO) needs to be collected to be able to subsequently obtain a corrected spectrum of the solid under investigation. Using a suitable reference spectrum is crucial to obtain a non-distorted baseline and enable quantitative analyses. If only the spectrum of adsorbed species are of interest without any need to quantify the optical pathway, then the spectrum of the calcined or reduced catalyst can be used.A fine powder of SiC is also commonly used, as the SiC crystals act as minute mirrors simulating a diffuse reflectance spectrum, although in the present case the photons are in fact specularly reflected and not diffused. SiC is often oxidized at its surface, resulting in some silica bands being observable in this single beam spectrum. Reference materials should be dried and decarbonated as much as possible to limit overlapping with bands related to the solid under investigation.
The absorptivity of the solid under investigation and its packing in the sample holder will influence the effective path length of the photon in the sample. The presence of absorption bands due to the solid can actually be used at an advantage to normalize the optical path length. For instance, silica-based materials (such zeolites, amorphous silica supports) exhibit backbone vibration overtones in the 1800–2000 cm−1 region that can be used for this purpose.25 It is important to use the same particle size and packing mode, especially if no such “normalizing” band is available (for instance, when using alumina).
Extra care has to be taken when using SiO2-based catalysts because of the presence of backbone vibration overtones in the 2100–1800 cm−1 region. The intensity of these bands is very sensitive to changes in temperatures and hydration state of the solids and can lead to important baseline distortion, as shown elsewhere.25
It should also be kept in mind that the effective path length can markedly differ before and after reduction of a supported metal catalyst, especially when the metal loading is high, making the sample absorptivity much greater after reduction. Inversely, the optical path length could be increased significantly upon reoxidation of the metal phase. Therefore, it is not straightforward to compare the band intensity of the adsorbates between two sets of reaction conditions if those imply a significant change in sample absorptivity through metal phase reduction or oxidation. A potential solution to overcome these changing path lengths is to use a vibration band of the solid or that of an inert solid for normalization purposes.
3. DRIFTS spectrum handling: units
It is surprising that the nature of the DRIFT intensity transform to be used to represent the surface concentration of adsorbates seems rather unclear. A brief survey of the numerous papers dealing with DRIFT studies of adsorbates published (particularly in heterogeneous catalysis journals) reveals that the Kubelka–Munk (K–M) function was used in about half of the papers, while the pseudo-absorbance (= log![[thin space (1/6-em)]](https://www.rsc.org/images/entities/char_2009.gif) 1/R, where R is the sample reflectance, called thereafter “absorbance” for the sake of simplicity) function was used in the other half. The basis of the choice of function was usually not discussed.
1/R, where R is the sample reflectance, called thereafter “absorbance” for the sake of simplicity) function was used in the other half. The basis of the choice of function was usually not discussed.
The absorbance units are actually those that vary most linearly with respect to surface coverages for common catalytic systems, that is when the sorbate band intensity is low, and should be preferably used for quantitative analyses, as discussed elsewhere.26,27 The use of Kubelka–Munk units (normally used to quantify a solute in a matrix, not adsorbates26,28) also leads to marked difficulties in terms of baseline distortions due to temperature changes or sample surface modification.
The elegant work by Bianchi and co-workers27 on the determination of the heat of adsorption of CO on metals by an IR adsorption equilibrium method (see Section 6) enabled a direct comparison between DRIFTS and transmission IR data (Fig. 2).
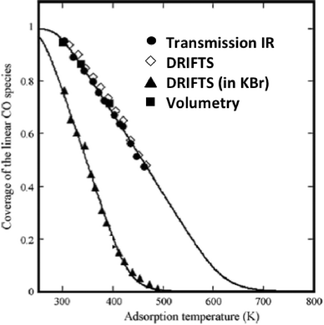 | ||
| Fig. 2 Surface coverage of linearly adsorbed CO over alumina-supported Cu(I) sites. The adsorption isobars were collected at various temperatures under 0.8 kPa of CO. (Reprinted from ref. 27: J. Couble, P. Gravejat, F. Gaillard and D. Bianchi, Appl. Catal. A: Gen., 2009, 371, 99–107, Copyright © 2009, with permission from Elsevier). | ||
The equilibrium coverage of CO adsorbed on Cu+ sites was measured at various temperatures. The adsorption isobars appeared identical for the DRIFTS (undiluted sample powder) and transmission (self-supported wafer) data when all were reported as absorbance.
These isobars were also identical to isobars measured via a volumetric (non-IR-based) method. These data confirm the adequacy of the absorbance units for the DRIFTS data and, in general, the validity of IR-based methods to study adsorbate concentrations (as long as band intensities are low, that is less than ca. 1 unit of absorbance).
Interestingly, the DRIFTS data collected for a sample diluted in KBr gave significantly different results as compared to all the other techniques. The authors proposed that the KBr induced a chemical change in the catalyst structure, leading to less strongly bound CO.27 This is a general observation that KBr, also sometimes used to prepare wafer for transmission IR, can modify the catalyst structure and its use should therefore be avoided.
4. Subtraction of gas-phase spectra
In common commercial DRIFTS cells, the optical path length in the gas-phase comprised in the dead-volume between the IR windows and the sample can be of several centimeters, while that truly in the sample is lower than a few millimeters (Fig. 3).25 The sample path lengths in the case of transmission IR using wafers are typically lower than 50 microns, leading to lower signal cut-off. The gas-phase path length can be of even several tens of centimeters in the case of specially designed instruments combining DRIFTS and X-ray diffraction.18 Some custom-made cells include a double-chamber to facilitate gas-phase correction.11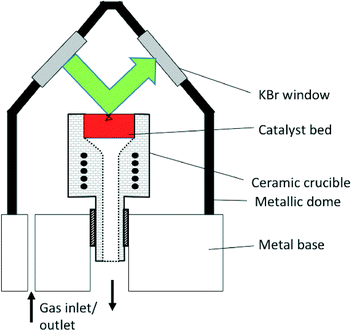 | ||
| Fig. 3 Schematic representation of the Spectra-Tech® DRIFTS cell. The green arrow represents the path of the beam within the dead-volume above the sample bed, ca. 34 mm. The black line in the sample bed represents a potential path of the IR beam by transmission through and reflection by the sample particles, typically ca. 1 mm (for interpretation of the references to color in this legend, the reader is referred to the web version of the article) (reprinted from ref. 25: A. Paredes-Nunez, I. Jbir, D. Bianchi and F. C. Meunier, Appl. Catal. A: Gen., 2015, 495, 17–22, Copyright © 2015, Elsevier). | ||
The signal of the gas-phase species ought to be subtracted from the DRIFTS spectrum of the surface species, especially when gas-phase vibrations overlap with those of the adsorbed species. Gas-phase spectra vary depending on the temperature, primarily due to their rotovibrational nature and different occupations of the rotational states with temperature. Despite being well known, the rotovibrational spectra of gas-phase water and methanol have even been mistaken for those of adsorbates.29,30
The variable temperature used for the analysis and the strong temperature gradients existing in most DRIFTS cells (see next section31) make it highly preferable to collect gas-phase spectra under the very same conditions as those used for the surface analysis, preferably over a non-adsorbing and a non-absorbing matrix exhibiting a similar path length. It is then possible to obtain total removal of the gas-phase signal, without any baseline distortion.25
5. Temperature control
The important temperature gradients existing in commercial DRIFTS cells were highlighted by Li et al.31 The most striking observation was that the temperature of the very surface of the sample bed, probed by using an optical pyrometer and therefore corresponding to the depth pertaining to the DRIFTS analysis, was significantly lower than that measured by using a sample bed thermocouple (Fig. 4). The temperature of the surface in a Harrick® cell was shown to be ca. 100 °C cooler than the bed temperature when the latter was set at 460 °C.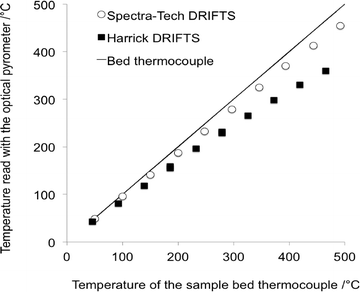 | ||
| Fig. 4 Temperature at the surface of the DRIFTS bed sample measured using an optical pyrometer as a function of the temperature of the thermocouple located in the sample bed (adapted from ref. 31: H. Li, M. Rivallan, F. Thibault-Starzyk, A. Travert and F. C. Meunier, Phys. Chem. Chem. Phys., 2013, 15, 7321–7327. Copyright © 2013, Royal Society of Chemistry). | ||
Such temperature offsets can have important consequences. The observed kinetics could correspond to a distribution of temperatures, from the hotter bed bottom to the cooler bed surface. The DRIFTS cell temperature can actually be calibrated against reaction rates measured in a well-controlled reactor.31
Our experience of DRIFTS cell indicates that temperature offsets are easily manageable below 300 °C and that reaction rates identical to those measured in a traditional reactor can be obtained, as shown for the water-gas shift reaction32 and more recently for CO hydrogenation over cobalt.33
The whole body of the cell should yet preferably be thermalized at high temperature (e.g. 80 °C) rather than at room temperature, to favor gas pre-heating and limit heat losses. The high thermal conductivity of He and H2 is also known to favor heat losses between the sample bed and the cell walls and make the temperature control more difficult, especially if high pressures are used. An oxide could have only been partly or not reduced at all at the cooler bed surface, which is the zone probed by the DRIFTS beam, while the rest of the bed could have been fully reduced. Therefore, a misfit could exist between the DRIFTS spectra (corresponding to an oxidized state of the sample) and the catalytic data monitored at the exit of the bed, which would correspond to that of the bulk of the bed present in a more reduced state.
6. Heat of adsorption determination: AEIR method
Bianchi and co-workers have developed the adsorption equilibrium IR (AEIR) method for transmission IR to derive heats of adsorption at zero and full coverage using a generalized Temkin model.34–36 These authors have typically used CO as a probe molecule, but the method was recently extended to the use of NH337 and also to DRIFTS.27 The method is rather simple, consisting in measuring the surface coverage of the species associated with an IR band over a range of temperatures (Fig. 2) and fitting merely two parameters (i.e. the heats of adsorption at zero and full coverage).The main advantage of this technique is that it is specific to a given IR band and therefore can discriminate between different species if those exhibit different IR signals, such as different Au sites occurring during particle reconstruction38 or bridged and linear CO(ads) simultaneously present on Ni surfaces.39 This is in contrast to most other techniques (calorimetry, gravimetry, volumetry) that cannot discriminate sites and usually provide average heat values.
The use of the IR based method implies that the molar absorption coefficient does not vary significantly with coverage, which appeared to be the case for the data reported in Fig. 2 in view of the agreement between the IR and volumetric data. The occurrence of dipole–dipole interactions and intensity transfer should also be considered, as this could modify the relative intensity of bands associated with different neighboring sites.40,41
The method was recently used to investigate Pt and Pt–Sn phases.42 Pt–Sn exhibits improved activity, selectivity and/or resistance to deactivation over the analogous Pt catalysts in hydrogenation43 and dehydrogenation44 reactions and oxidation of ethanol, methanol45 and carbon monoxide.46,47
CO was used as a probe molecule since it strongly adsorbs on Pt but not on Sn.42 CO adsorption was studied in the presence of H2 and attention was drawn to the fact that methanation was negligible. The position of the band of CO(ads) indicated that different types of Pt sites were present. The bands shifting from 2061 up to 2077 cm−1 with increasing coverage at lower temperatures were typical of Pt phases (Fig. 5, top), while those shifting from 2045 up to 2054 cm−1 were associated with Pt in a Pt–Sn phase (Fig. 5, bottom). These data emphasize the advantage of the technique that directly determines the nature of the sites present.
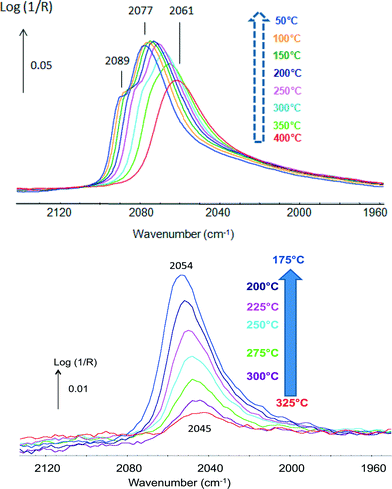 | ||
| Fig. 5 In situ DRIFTS spectra under 2% CO in H2 of (top) Pt/Al2O3 and (bottom) Pt–Sn/Al2O3 (adapted from ref. 42: A. Moscu, Y. Schuurman, L. Veyre, C. Thieuleux and F. Meunier, Chem. Commun., 2014, 50, 8590–8592. Copyright © 2014, Royal Society of Chemistry). | ||
The data reported in Fig. 5 also clearly show that CO bonding was much weaker in the case of the Pt–Sn material. CO coverage at 300 °C over the Pt–Sn was about 13%, while that over the Pt was ca. 88%. The ΔadsH of CO at zero coverage was found to be 180 kJ mol−1 in the case of the plain Pt sample and only 85 kJ mol−1 in the case of the alloy.42 This makes the Pt–CO bonding in the Pt–Sn alloy as weak as that of CO adsorbed on Cu0 (ref. 48) and rationalizes the superior resistance to CO-poisoning of Pt–Sn surfaces.
7. Feed contamination
The data reported in the previous sections reemphasized that coverage of an adsorbate in adsorption/desorption equilibrium with a surface should decrease with increasing temperature. This is due to the fact that adsorption enthalpies are essentially always negative and therefore van't Hoff equation states that adsorption equilibrium constants decrease with increasing temperatures.49Surprisingly, the opposite behavior was reported on a EuroPt-1 sample (i.e. ca. 6.3 wt% Pt/SiO2 (ref. 50)) exposed to CO.51 The spectra reported in Figure 1.a in ref. 51 corresponding to pre-reduced EuroPt-1 exposed to a stream of 4% CO/He show that the signal of CO(ads) increased about 10-fold when raising the temperature from −30 °C up to 300 °C. Such behavior is totally unexpected for this system. In fact, we recently investigated the very same EuroPt-1 catalyst under similar conditions both by transmission IR and DRIFTS and found that the CO surface coverage decreased with increasing temperatures.52
A restructuring of the H2-pre-reduced EuroPt-1 sample was observed under CO when the temperature was increased from room temperature up to 300 °C.52 However, this accounted for less than a 2-fold increase in the band area. This restructuring appeared to redisperse the platinum from an initial value of about 60% to ca. 90% and further cycling of the temperature under CO leads to reproducible adsorption isobars.52
No temperature cycling was performed in the case of the work reported in ref. 51; therefore, the reproducibility of the data and the reversibility of the adsorption cannot be assessed. The authors proposed the formation of multicarbonyls on Pt corner sites (the so-called “multiple corners” in ref. 51) in order to explain the increase in signal at higher temperatures. Pt–(CO)n,n>1 complexes can be observed under peculiar conditions (prepared by laser vaporization,53 isolated in solid argon54) but are usually not considered when dealing with supported Pt catalysts, contrary to the case of Rh or Ni. The fact that these Pt–(CO)n,n>1 species would be preferentially formed at higher temperatures would contradict thermodynamics, which favor CO molecules in the gas-phase (highest entropy) over condensed Pt-multicarbonyls at higher temperatures.
It should also be emphasized that complex decomposition of complex bands of CO(ads) adsorbed on metals as attempted in ref. 51 can be meaningless due to strong dipole coupling and should only be attempted if the species dipoles are decoupled (i.e. not neighboring or exhibiting a large wavenumber difference).33,55
The CO(ads) that we observed at 300 °C over the EuroPt-1 sample exhibited only one main band at ca. 2060 cm−1 at full coverage after reconstruction,52 contrary to the case of the spectra reported in ref. 51 that displayed two bands at ca. 2065 and 2040 cm−1, the latter being very broad. We could actually reproduce a similar signal to those reported in ref. 51 when 1% H2O was added to the feed, which resulted in the formation of a larger additional band at ca. 2045 cm−1.52 The presence of adsorbed water also resulted in a band at ca. 1628 cm−1 (water bending mode),52 which cannot be verified in the case of the data reported in ref. 51 because this spectral region was not shown.
To our opinion, the unexpected increase in the signal of CO(ads) observed over the reduced EUROPt-1 catalysts (Fig. 1.a in ref. 51) was actually due to a combination of, to the minor part, surface reconstruction of the Pt particles when exposed to CO and, to the major part, a contamination with H2O or O2, which resulted in the blocking or reoxidation of most of the Pt sites at −30 °C, possibly with the formation of a surface ice layer. CO could adsorb on the Pt atoms only after the temperature was raised and the adsorbed water/oxygen was removed. Therefore, the proposed band decomposition and related discussion and conclusions in (ref. 51) are not supported by the data reported in there.
8. Surface species reactivity: spectators and potential reaction intermediates
The ultimate goal of in situ and operando DRIFTS studies is to determine the nature of the main reaction intermediates. This requires ideally to determine the specific rate of decomposition of the surface intermediates under steady-state conditions as well as the nature of the product formed, the latter being not obvious if several decomposition molecules can be formed (this includes the intermediate desorbing back in the form of the reactant).Steady-state conditions should be preferred because the catalyst structure/composition and the reactivity of adsorbates may vary depending on the experimental conditions.56–58 Steady-state isotopic techniques provide a useful means of determining the role of surface intermediates, although the effect of reactant and product readsorption should be carefully considered.59–63 In fact, a mere comparison of time constant of exchange is not sufficient to ascertain that a surface species is the main intermediate and such examples are found in the literature.64 On the contrary, a time constant of exchange of surface intermediate longer than that of the product is sufficient to prove that it is a “spectator” species.65
A recent example dealing with the hydrogenation of CO over cobalt-based catalysts exemplifies the typical conclusions that can be achieved using non-isotopic transient methods.66 The main reaction products were methane and propene, but some methanol was also observed (Fig. 6). The reaction was operating under differential conditions, so that the bed could be considered as homogeneous.
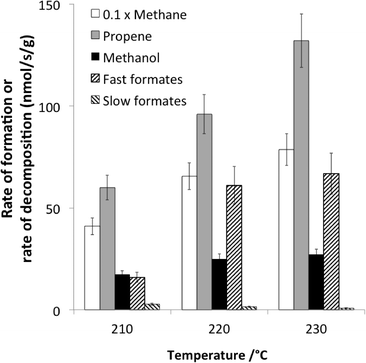 | ||
| Fig. 6 Comparison at 210, 220 and 230 °C of the rates of formation (at steady state under 30% CO + 60% H2) of methane, propene and methanol and the rates of decomposition (following CO removal from the feed) of fast and slow formates (adapted from ref. 66: D. Lorito, A. Paredes-Nunez, C. Mirodatos, Y. Schuurman and F. C. Meunier, Catal. Today, 2016, 259, 192–196, Copyright © 2015, Elsevier). | ||
Formate species were present and shown to exhibit a two-fold reactivity, associated with the so-called “slow” and fast” formates. The specific rate of formate decomposition could be calculated from transient experiments and calibration curves. The slow formate decomposition rate was far lower than the rate of formation of the products and was therefore considered as a mere spectator species. In contrast, the fast formate decomposition rate was equal or higher than the rate of methanol formation and could therefore be considered as a potential reaction intermediate in methanol formation.
However, the rates of methane and propene formations were in turn markedly higher than that of fast formate decomposition, and therefore, other surface intermediates are accountable for these hydrocarbons. These finding are summarized in Fig. 7.
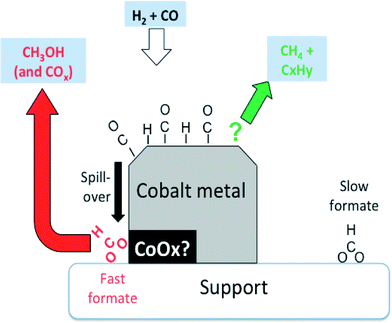 | ||
| Fig. 7 Suggested involvement of formates observed by IR over Co-Siralox® during CO hydrogenation. Slow formates are essentially inert spectators, while the fast formates are potentially wholly responsible for the formation of methanol. Methane and propene (and other hydrocarbons) are formed via other surface intermediates (adapted from ref. 66: D. Lorito, A. Paredes-Nunez, C. Mirodatos, Y. Schuurman and F. C. Meunier, Catal. Today, 2016, 259, 192–196, Copyright © 2015, Elsevier). | ||
It should be stressed that the large dead volume of DRIFTS cells may lead to distorted conversion data, especially when highly reactive molecules or high temperatures are used, because of homogeneous gas-phase reactions. These effects can be alleviated by using high flow rates. Since the cell dead volumes are typically of the order of milliliters, a sampling time resolution of about one second can be achieved at a flow rate of 60 mL min−1.
9. Nature of adsorption sites and alloy segregation
The IR spectrum of adsorbates (the most common probes being CO and NO) can indicate the nature of the site onto which the former is adsorbed.2,67–73 The presence of a metal or a carbide phase in the case of cobalt can also be discriminated.74,75 The DRIFTS analysis of the complex CO(ads) band formed in the presence of CO2 during toluene hydrogenation has enabled the determination of the nature of deactivating sites (i.e. low coordination Rh atoms at the interface with the alumina support) and led to the design of a CO2-resistant catalyst.76The Pt–Sn/alumina catalysts discussed in Section 6 were used in the preferential oxidation of CO in the presence of excess H2 (PROX) reaction.77 The Pt–Sn alloy in a well-reduced state at 225 °C displayed a typical CO(ads) band at ca. 2050 cm−1 (Fig. 5, bottom) that was observed just before contacting the catalyst with O2 (Fig. 8). However, the spectrum dramatically changed as soon as O2 was introduced (Fig. 8) and was then similar to that of plain platinum at the same temperature (Fig. 5, top). These observations were explained by the rapid reoxidation of Sn in the presence of O2 and the decomposition of the alloy to form a Pt phase well-dispersed inside a SnOx matrix.77
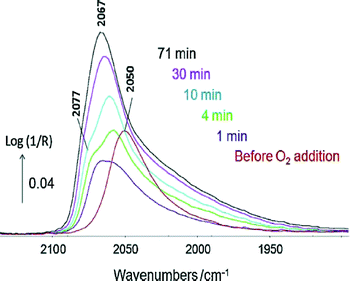 | ||
| Fig. 8 In situ DRIFTS spectra recorded at 225 °C at various times under 1% CO + 2% O2 + 80% H2 in Ar over PtSn/Al2O3 pre-reduced at 400 °C. The red spectrum was collected just before the addition of O2 (adapted from ref. 77: A. Moscu, Y. Schuurman, L. Veyre, C. Thieuleux and F. C. Meunier, Catal. Today, 2015, in press, Copyright © 2015, Elsevier). | ||
These observations crucially show that under reaction conditions under which O2 is present the Pt–Sn alloy does not exist, due to the high oxophilicity of tin. These observations are similar to those proposed by Somorjai and co-workers in the case of CO oxidation over similar catalysts.46 The catalytic properties of the solid obtained were found to be due to the synergy between Pt and SnOx phases, with a mechanism different from that occurring on the plain Pt.77
A caution with regard to the use of CO must yet be made. CO alone can rather easily lead to the surface segregation of alloys, when one of the metal components exhibits a much higher affinity for this probe molecule. This was observed, for instance, in the case of Pt–Co (ref. 78) and Au–Pd (ref. 79) alloys. CO was also shown to dissociate on metallic silver at room temperature and led to silver oxidation and deposition of carbon.80
10. Conclusions
The present review lists a set of procedures and conditions that need to be fulfilled to be able to carry out appropriate analysis of diffuse reflectance FT-IR (DRIFTS) spectra. Reference spectrum selection, spectral transformation to be used, gas-phase and temperature corrections have a significant importance even when only qualitative information is sought. Quantitative information in terms of surface concentration and heat of adsorption can be obtained in many cases. The information obtained can be used to discard or retain some surface species as possible reaction intermediates. Direct information into the oxidation or alloying state of the catalyst surface can be obtained, particularly when CO is used as a reactant since this compound is also a well-known molecular probe.References
- N. E. Tsakoumis, A. P. E. York, D. Chen and M. Rønning, Catal. Sci. Technol., 2015, 5, 4859–4883 CAS.
- F. Zeara, Chem. Soc. Rev., 2014, 43, 7624–7663 RSC.
- D. Ferri, M. A. Newton, M. Di Michiel, G. L. Chiarello, S. Yoon, Y. Lu and J. Andrieux, Angew. Chem., Int. Ed., 2014, 53, 8890–8894 CrossRef CAS PubMed.
- C. E. Stere, W. Adress, R. Burch, S. Chansai, A. Goguet, W. G. Graham and C. Hardacre, ACS Catal., 2015, 5, 956–964 CrossRef CAS.
- R. Kydd, D. Ferri, P. Hug, J. Scott, W. Y. Teoh and R. Amal, J. Catal., 2011, 277, 64–71 CrossRef CAS.
- F. C. Meunier, Chem. Soc. Rev., 2010, 39, 4602–4614 RSC.
- F. C. Meunier, Catal. Today, 2010, 155, 164–171 CrossRef CAS.
- C. M. Kalamaras, D. D. Dionysiou and A. M. Efstathiou, ACS Catal., 2012, 2, 2729–2742 CrossRef CAS.
- F. C. Meunier, D. Verboekend, J.-P. Gilson, J. C. Groen and J. Pérez-Ramírez, Microporous Mesoporous Mater., 2012, 148, 115–121 CrossRef CAS.
- M. Milosevic and S. L. Berets, Appl. Spectrosc. Rev., 2002, 37, 347–364 CrossRef CAS.
- A. Drochner, M. Fehlings, K. Krauss and H. Vogel, Chem. Eng. Technol., 2000, 23, 213–322 CrossRef.
- V. Dal Santo, L. C. Dossi, A. Fusi, R. Psaro, C. Mondelli and S. Recchia, Talanta, 2005, 66, 674–682 CrossRef CAS PubMed.
- M. M. Schubert, T. P. Haring, G. Brath, H. A. Gastiger and R. J. Behm, Appl. Spectrosc., 2001, 55, 1537–1543 CrossRef CAS.
- M. A. Newton, Top. Catal., 2009, 52, 1410–1424 CrossRef CAS.
- M. A. Newton, M. D. Michiel, A. Kubacka and M. Fernández-García, J. Am. Chem. Soc., 2010, 132, 4540–4541 CrossRef CAS PubMed.
- N. S. Marinkovic, Q. Wang and A. I. Frenkel, J. Synchrotron Radiat., 2011, 18, 447–455 CrossRef CAS PubMed.
- G. L. Chiarello, M. Nachtegaal, V. Marchionni, L. Quaroni and D. Ferri, Rev. Sci. Instrum., 2014, 85, 074102 CrossRef PubMed.
- J. Scalbert, I. Clémençon, C. Legens, F. Diehl, D. Decottignies and S. Maury, Oil Gas Sci. Technol., 2015, 70, 419–428 CrossRef.
- J. Scalbert, I. Clémençon, P. Lecour, L. Braconnier, F. Diehl and C. Legens, Catal. Sci. Technol., 2015, 5, 4193 CAS.
- S. B. Rasmussen, S. Perez-Ferreras, M. A. Bañares, P. Bazin and P. M. Daturi, ACS Catal., 2013, 143, 31–42 Search PubMed.
- M. P. Fuller and P. R. Griffiths, Anal. Chem., 1978, 50, 1906–1910 CrossRef CAS.
- K. W. van Every and P. R. Griffiths, Appl. Spectrosc., 1991, 45, 347–359 CrossRef CAS.
- J. M. Olinger and P. R. Griffiths, Anal. Chem., 1988, 60, 2427–2435 CrossRef CAS.
- I. M. Hamadeh and P. R. Griffiths, Appl. Spectrosc., 1987, 41, 682–688 CrossRef CAS.
- A. Paredes-Nunez, I. Jbir, D. Bianchi and F. C. Meunier, Appl. Catal., A, 2015, 495, 17–22 CrossRef CAS.
- J. Sirita, S. Phanichphant and F. C. Meunier, Anal. Chem., 2007, 79, 3912–3918 CrossRef CAS PubMed.
- J. Couble, P. Gravejat, F. Gaillard and D. Bianchi, Appl. Catal., A, 2009, 371, 99–107 CrossRef CAS.
- V. A. Matyshak and O. V. Krylov, Catal. Today, 1995, 25, 1–87 CrossRef CAS.
- F. C. Meunier, Korean J. Chem. Eng., 2011, 28, 1495–1495 CrossRef CAS.
- F. C. Meunier, RSC Adv., 2015 Search PubMed , in press.
- H. Li, M. Rivallan, F. Thibault-Starzyk, A. Travert and F. C. Meunier, Phys. Chem. Chem. Phys., 2013, 15, 7321–7327 RSC.
- F. C. Meunier, D. Reid, A. Goguet, S. Shekhtman, C. Hardacre, R. Burch, W. Deng and M. Flytzani-Stephanopoulos, J. Catal., 2007, 247, 277–287 CrossRef CAS.
- A. Paredes-Nunez, D. Lorito, Y. Schuurman, N. Guilhaume and F. C. Meunier, J. Catal., 2015, 329, 229–236 CrossRef CAS.
- A. Bourane, O. Dulaurent and D. Bianchi, J. Catal., 2000, 195, 406–411 CrossRef CAS.
- O. Dulaurent and D. Bianchi, Appl. Catal., A, 2000, 196, 271–280 CrossRef CAS.
- T. Chafik, O. Dulaurent, J. L. Gass and D. Bianchi, J. Catal., 1998, 179, 503–514 CrossRef CAS.
- F. Giraud, C. Geantet, N. Guilhaume, S. Gros, L. Porcheron, M. Kanniche and D. Bianchi, J. Phys. Chem. C, 2014, 118, 15664–15676 CAS.
- E. Roze, P. Gravejat, E. Quinet, J.-L. Rousset and D. Bianchi, J. Phys. Chem. C, 2009, 113, 1037–1045 CAS.
- S. Derrouiche and D. Bianchi, Appl. Catal., A, 2006, 313, 208–217 CrossRef CAS.
- V. M. Browne, S. G. Fox and P. Hollins, Mater. Chem. Phys., 1991, 29, 235–244 CrossRef CAS.
- S. G. Fox, V. M. Browne and P. Hollins, J. Electron Spectrosc. Relat. Phenom., 1990, 54/55, 749–758 CrossRef.
- A. Moscu, Y. Schuurman, L. Veyre, C. Thieuleux and F. C. Meunier, Chem. Commun., 2014, 50, 8590–8592 RSC.
- A. B. Merlo, V. Vetere, J. F. Ruggera and M. L. Casella, Catal. Commun., 2009, 10, 1665–1669 CrossRef CAS.
- R. Burch and L. C. Garla, J. Catal., 1981, 71, 360–372 CrossRef CAS.
- A. O. Neto, R. R. Dias, M. M. Tusi, M. Linardi and E. V. Spinacé, J. Power Sources, 2007, 166, 87–91 CrossRef.
- W. D. Michalak, J. M. Krier, S. Alayoglu, J.-Y. Shin, K. An, K. Komvopoulos, Z. Liu and G. A. Somorjai, J. Catal., 2014, 312, 17–25 CrossRef CAS.
- M. M. Schubert, M. J. Kahlich, G. Feldmeyer, M. Huttner, S. Hackenberg, H. A. Gasteiger and R. J. Behm, Phys. Chem. Chem. Phys., 2001, 3, 1123–1131 RSC.
- S. Derrouiche, V. Perrichon and D. Bianchi, J. Phys. Chem. B, 2003, 107, 8588–8591 CrossRef CAS.
- P. Atkins and J. De Paula in Atkins' Physical Chemistry 8th edition, Oxford University Press, Oxford, 2006 Search PubMed.
- G. C. Bond and P. B. Wells, Appl. Catal., 1985, 18, 221–224 CrossRef CAS.
- A. Garnier, S. Sall, F. Garin, M. J. Chetcuti and C. Petit, J. Mol. Catal. A: Chem., 2013, 373, 127–134 CrossRef CAS.
- I. Jbir, A. Paredes-Nunez, S. Khaddar-Zine, Z. Ksibir, F. Meunier and D. Bianchi, Appl. Catal., A, 2015, 505, 309–318 CrossRef CAS.
- J. Velasquez and M. A. Duncan, Chem. Phys. Lett., 2008, 461, 28–32 CrossRef CAS.
- L. Manceron, B. Tremblay and M. E. Alikhani, J. Phys. Chem. A, 2000, 104, 3750–3758 CrossRef CAS.
- V. M. Browne, S. G. Fox and P. Hollins, Catal. Today, 1991, 9, 1–14 CrossRef CAS.
- A. Goguet, S. Shekhtman, F. Cavallaro, C. Hardacre and F. C. Meunier, Appl. Catal., A, 2008, 344, 30–35 CrossRef CAS.
- W. Deng and M. Flytzani-Stephanopoulos, Angew. Chem., Int. Ed., 2006, 45, 2285–2289 CrossRef CAS PubMed.
- F. C. Meunier, D. Tibiletti, A. Goguet, D. Reid and R. Burch, Appl. Catal., A, 2005, 289, 104–112 CrossRef CAS.
- S. L. Shannon and J. G. Goodwin, Chem. Rev., 1995, 95, 677–695 CrossRef CAS.
- F. Meunier, Appl. Catal., B, 2014, 152, 437–438 CrossRef.
- J. Schweicher, A. Bundhoo, A. Frennet, N. Kruse, H. Daly and F. C. Meunier, J. Phys. Chem. C, 2010, 114, 2248–2255 CAS.
- S. Chansai, R. Burch, C. Hardacre, J. Breen and F. Meunier, J. Catal., 2010, 276, 49–55 CrossRef CAS.
- S. Chansai, R. Burch, C. Hardacre, J. Breen and F. Meunier, J. Catal., 2011, 281, 98–105 CrossRef CAS.
- R. Burch, F. C. Meunier and A. Goguet, Appl. Catal., A, 2011, 409–410, 3–12 CrossRef CAS.
- D. Tibiletti, F. C. Meunier, A. Goguet, D. Reid, R. Burch, M. Boaro, M. Vicario and A. Trovarelli, J. Catal., 2006, 244, 183–191 CrossRef CAS.
- D. Lorito, A. Paredes-Nunez, C. Mirodatos, Y. Schuurman and F. C. Meunier, Catal. Today, 2016, 259, 192–196 CrossRef CAS.
- K. I. Hadjiivanov, Catal. Rev.: Sci. Eng., 2000, 42, 71–144 CAS.
- M. A. Centeno, K. Hadjiivanov, T. Venkov, H. Klimev and J. A. Odriozola, J. Mol. Catal. A: Chem., 2006, 252, 142–149 CrossRef CAS.
- H. Klimev, K. Fajerwerg, K. Chakarova, L. Delannoy, C. Louis and K. Hadjiivanov, J. Mater. Sci., 2007, 42, 3299–3306 CrossRef CAS.
- M. Mihaylov, B. C. Gates, J. C. Fierro-Gonzalez, K. Hadjiivanov and H. Knozinger, J. Phys. Chem., 2007, 111, 2548–2556 CAS.
- M. Manzoli, F. Boccuzzi, A. Chiorino, F. Vindigni, W. Deng and M. Flytzani-Stephanopoulos, J. Catal., 2007, 245, 308–315 CrossRef CAS.
- T. Tabakova, F. Boccuzzi, M. Manzoli, J. W. Sobczak, V. Idakiev and D. Andreeva, Appl. Catal., A, 2006, 298, 127–143 CrossRef CAS.
- F. Menegazzo, M. Manzoli, A. Chiorino, F. Boccuzzi, T. Tabakova, M. Signoretto, F. Pinna and N. Pernicone, J. Catal., 2006, 237, 431–434 CrossRef CAS.
- J. Couble and D. Bianchi, J. Phys. Chem. C, 2013, 117, 14544–14557 CAS.
- A. Paredes-Nunez, D. Lorito, N. Guilhaume, C. Mirodatos, Y. Schuurman and F. C. Meunier, Catal. Today, 2015, 242, 178–183 CrossRef CAS.
- J. Scalbert, C. Daniel, Y. Schuurman, C. Thomas and F. C. Meunier, J. Catal., 2014, 318, 61–66 CrossRef CAS.
- A. Moscu, Y. Schuurman, L. Veyre, C. Thieuleux and F. C. Meunier, Catal. Today, 2015, 258, 241–246 CrossRef CAS.
- K. J. J. Mayrhofer, V. Juhart, K. Hartl, M. Hanzlik and M. Arenz, Angew. Chem., Int. Ed., 2009, 48, 3529–3531 CrossRef CAS PubMed.
- L. Delannoy, S. Giorgio, J. G. Mattei, C. R. Henry, N. El Kolli, C. Méthievier and C. Louis, ChemCatChem, 2013, 5, 2707–2716 CrossRef CAS.
- K. Bechoux, O. Marie, M. Daturi, G. Delahay, C. Petitto, S. Rousseauc and G. Blanchard, Catal. Today, 2012, 197, 155–161 CrossRef CAS.
| This journal is © The Royal Society of Chemistry 2016 |

