DOI:
10.1039/C6RA25016E
(Paper)
RSC Adv., 2016,
6, 113260-113266
Insights into the effect of surface functional groups on catalytic performance for hydrogen generation from sodium borohydride†
Received
10th October 2016
, Accepted 24th October 2016
First published on 1st December 2016
Abstract
Sodium borohydride hydrolysis to generate hydrogen has great potential for mobile and portable applications, and designing efficient catalysts for this reaction is indispensable. In this work, the effect of surface functional groups on hydrogen generation rate (HGR) is investigated using two polystyrene resin supported Pt catalysts. The first type of resin (resin-NH) contains –N(CH3)3OH and abundant –OH groups, while the other one (resin-SH) contains –SO3H and less –OH. After excluding the influences of basicity and Pt loading, it is found that the Pt/resin-NH catalyst exhibits a much higher HGR and lower activation energy compared with the Pt/resin-SH catalyst. Moreover, multiple techniques such as FT-IR, XRD, TEM and XPS are further employed to elucidate the intrinsic mechanism. Compared with the –SO3H group, the –N(CH3)3OH and –OH groups not only facilitate Pt dispersion by enhancing metal–support interaction but also improve the electronic conductivity during hydrolysis by forming electron-enriched Pt active sites.
1. Introduction
Nowadays, decreasing natural gas, coal and petroleum reserves highlight the importance of renewable energy.1 Among renewable energy resources, H2 is considered one of the most promising ideal fuels for the future due to its great environmental friendliness, high energy capacity and colossal ability to reduce environmental pollution.2,3 However, the problems of H2 delivery and storage remain as two major hurdles in developing large-scale H2-based energy technologies. Currently, chemical hydrides (e.g., sodium borohydride, NaBH4) have great potential to resolve above problems thanks to their high gravimetric/volumetric hydrogen storage capacities.4–8 NaBH4 has advantages such as non-flammability, high stability in air for months and environmentally safe by-products (i.e., H2O and NaBO2) which can be recycled at temperatures lower than room temperature.9 Typically, H2 generation from NaBH4 hydrolysis can be obtained via suitable supported metal catalyst in aqueous solution according to eqn (1). About 4 mol of H2 can be produced from each mole of NaBH4 by utilizing H atoms in H2O.| |
 | (1) |
It is noted that the hydrogen generation rate (HGR) can be significantly enhanced by using catalyst during the NaBH4 hydrolysis reaction. Therefore, extensive studies been focused on designing efficient catalyst to achieve superior catalytic performance. Various types of catalysts have been reported for this reaction. Besides acid (e.g., oxalic acid and citric acid),6 metallic salts (e.g., RuCl3, RhCl3 and PtCl3),10 metal borides (e.g., CoB and NixB)11,12 and reduced transition metals (e.g., Co and Ru),12–14 supported metal catalysts have attracted exclusive attention because the performance can be improved by the geometric effect (e.g. shape of metal) and/or the electronic effect (change in the electronic environment of metal). To date, a series of Pt, Co, Ru and Ni15–17 catalysts supported on carbon,17–20 Al2O3,21 polymer,22–26 SiO2,27 TiO2,28–30 ZrO2![[thin space (1/6-em)]](https://www.rsc.org/images/entities/char_2009.gif) 31 and ZrO2–SO42–32 have shown good performance for NaBH4 hydrolysis. Kojima et al.33 studied the effect of LiCoO2 support on catalytic performance, and attributed the high catalytic performance to the enhanced water adsorption on support which facilitates H2 formation from H2O by reduction of H+. Dong et al.23 showed that the hydrophobicity and hydrophilicity of polymer support could tune the metal loading, and thus change the hydrogen production rate. Notably, the surface functional groups as important part of support usually have interaction with the metal nanoparticles, and thus change the catalytic performance by metal–support interaction.34 It is thus of great significance to choose suitable surface functional groups for the design of highly efficient catalyst. However, few reports have focused on the role of surface functional groups during the NaBH4 hydrolysis reaction. Therefore, understanding the effects of surface functional groups on HGR will undoubtedly be beneficial to improve the performance of catalyst for NaBH4 hydrolysis.
31 and ZrO2–SO42–32 have shown good performance for NaBH4 hydrolysis. Kojima et al.33 studied the effect of LiCoO2 support on catalytic performance, and attributed the high catalytic performance to the enhanced water adsorption on support which facilitates H2 formation from H2O by reduction of H+. Dong et al.23 showed that the hydrophobicity and hydrophilicity of polymer support could tune the metal loading, and thus change the hydrogen production rate. Notably, the surface functional groups as important part of support usually have interaction with the metal nanoparticles, and thus change the catalytic performance by metal–support interaction.34 It is thus of great significance to choose suitable surface functional groups for the design of highly efficient catalyst. However, few reports have focused on the role of surface functional groups during the NaBH4 hydrolysis reaction. Therefore, understanding the effects of surface functional groups on HGR will undoubtedly be beneficial to improve the performance of catalyst for NaBH4 hydrolysis.
Herein, effect of surface functional groups on HGR for NaBH4 hydrolysis are elucidated using two types of polystyrene resins supported Pt catalysts. The first type of resin (resin-NH) has –N(CH3)3OH and abundant –OH groups, while the other type (resin-SH) contains –SO3H and less –OH groups. To increase the accuracy of the comparison, the average size of the resin particles and Pt loadings are keenly controlled. As a result, the Pt/resin-NH catalyst exhibits a much higher HGR and lower activation energy compared with those of Pt/resin-SH catalyst. Furthermore, combining characterizations of FT-IR, XRD, SEM, TEM and XPS, the effects of surface functional groups on metal–support interaction and catalytic performance are investigated. The insights reported here are of referential importance to the design and development of highly active supported metal catalysts.
2. Experimental methods
2.1 Materials
Sodium borohydride (NaBH4, AR), sodium hydroxide (NaOH, AR) and hexachloroplatinic acid (H2PtCl6, AR) were purchased from Sinopharm. NaBH4 was used as strong reducing agent and H2 source for preparation of Pt nanoparticles and hydrolysis reactions, respectively. Two kinds of polystyrene resin beads with different surface functional groups were purchased from yzhou water treatment technology Co., Ltd. These two kinds of polystyrene resins, i.e., resin-SH and resin-NH have abundant –SO3H and –N(CH3)3OH groups respectively and similar mesh size of 30–40. Deionized water was taken from a Millipore's Milli-Q ultra-purification system having resistivity greater than 18.2 MW cm−1. All chemicals were used as received without further purification.
Pt/resin-SH and Pt/resin-NH catalysts were prepared by incipient wetness impregnation method as follows. In a typical process, 1 g resin beads was added in required volume of H2PtCl6 aqueous solution at ambient temperature, and then stirred for 30 min. Afterwards, the reactor was placed in cooling water which was maintained at 0 °C to prevent vigorous reaction. 5 wt% NaBH4 solution was then added to reduce Pt/resin catalysts under stirring. The beads produced were filtered and washed repeatedly with de-ionized water to remove by-products and residual ions. The resultant black beads were then dried under vacuum at 50 °C for 6 h. Pt loadings of the Pt/resin-NH and Pt/resin-SH catalysts are 2 wt%.
2.2 Characterization
X-ray diffraction (XRD) was performed on a Rigaku D/Max 2550VB/PC diffractometer using Cu Kα radiation. Fourier transform infrared spectroscopy (FT-IR) was performed on a Nicolet 6700, where the samples were ground with KBr. Transmission electron microscope (TEM) characterization was carried out for reduced and grinded catalysts on a JEOL JEM 2100F with accelerating voltage of 200 kV. Metal particle sizes and distributions were determined by measuring more than 150 randomly selected Pt nanoparticles. Scanning electron microscope (SEM) of prepared catalysts was identified on a JEOL JSM-6700F. Atomic absorption spectroscopy (AAS) was carried out using a ZEEnit 600 spectroscopy for elemental analysis. X-ray photoelectron spectroscopy (XPS) analysis of Pt catalyst was performed on a PHI5000Versa Probe spectrometer with monochromatic Al Kα radiation (hν = 1486.6 eV), in which the samples were stored under Ar atmosphere at room temperature before XPS analysis. The binding energy of C 1s (284.6 eV) was taken as a reference to correct the binding energy of the samples. The spectra of Pt element were curve-fitted by the software XPSPEAK 4.1 with 80% Lorentzian-20% Gaussian peaks to determine the Pt binding energy.
2.3 Hydrogen generation measurement
The HGR for NaBH4 hydrolysis in alkaline solution was measured by a classic gas volumetric method. The hydrogen generation performance was tested in a 100 mL three-neck flask immersed in a constant temperature bath. 50 mg catalysts were introduced into a sealed three-neck flask, and aqueous solution consisting of NaBH4 and NaOH was added into the flask to initiate the hydrolysis reaction under stirring. The volume of generated hydrogen was calculated according to the volume of water replaced by hydrogen. Each group of measurements was done in duplicate for at least 3 times to reduce the error as much as possible.
3. Results and discussion
3.1 Effect of surface functional group on catalytic performance
The different functional groups of two kinds of polystyrene resin are first determined by FT-IR spectra, as shown in Fig. 1. For both resins, characteristic bands of C–H stretching and aromatic C–C stretching show up at 3000–3025 and 1470 cm−1, respectively. In addition, the adsorption bands of C–H out-of-plane bending and aromatic C–C out-of-plane bending are observed at ca. 750 and 700 cm−1, respectively.35 The above bands confirm the presence of polystyrene matrix. For resin-SH sample, characteristic bands at 617 and 1038 cm−1 are clearly observed. These adsorption bands are bending vibration of –OH in –SO3H and symmetric stretching vibration of O![[double bond, length as m-dash]](https://www.rsc.org/images/entities/char_e001.gif) SO, indicating the presence of –SO3H surface functional group. The band at 1650 cm−1 is CC extending vibration of styrene. In contrast, for resin-NH sample, the surface quaternary amine group is evidenced by the adsorption bands at 1100 and 1634 cm−1, assigning to the stretching vibration of C–N and bending vibration of N–H.36 It should be noted that the strong adsorption bands at around 3400 cm−1 are surface –OH groups. Compared with resin-SH sample, the intensity of –OH band is much stronger, indicating that more –OH groups show up in the resin-NH sample.
SO, indicating the presence of –SO3H surface functional group. The band at 1650 cm−1 is CC extending vibration of styrene. In contrast, for resin-NH sample, the surface quaternary amine group is evidenced by the adsorption bands at 1100 and 1634 cm−1, assigning to the stretching vibration of C–N and bending vibration of N–H.36 It should be noted that the strong adsorption bands at around 3400 cm−1 are surface –OH groups. Compared with resin-SH sample, the intensity of –OH band is much stronger, indicating that more –OH groups show up in the resin-NH sample.
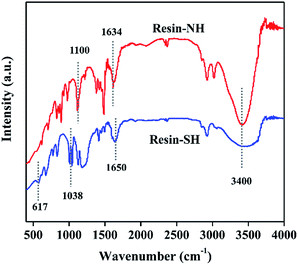 |
| | Fig. 1 FT-IR spectra of resin-NH and resin-SH samples. | |
Fig. 2 shows the XRD patterns of Pt/resin-SH and Pt/resin-NH samples. It is clear that all samples present two phases. The first phase, i.e., the principal component of the spectrum at 2θ = 18–20° is the amorphous polymeric matrix. The different diffraction peaks at 2θ = 39.75, 46.23 and 67.51 can be indexed as (111), (200) and (220) planes respectively, corresponding to the face-centered cubic (FCC) structure of Pt nanoparticle. It is obvious that there is broadening of diffraction peak at 39.75° for Pt/resin-NH catalyst, which suggests the decrease of Pt crystal size.37 The average crystallite grain sizes of the Pt nanoparticles are calculated according to Scherrer eqn (2):
| |
 | (2) |
where
d is the average particle size (nm),
λ is the wavelength of the X-ray used (1.54056 Å),
θ is the angle at the maximum of the peak (rad), and
β1/2 is the width of the peak at half height in radians. The estimated Pt particle sizes of Pt/resin-SH and Pt/resin-NH catalysts are 5.8 and 4.1 nm, respectively. In other words, the average Pt particle size of Pt/resin-NH catalyst is slightly smaller than that of Pt/resin-SH catalyst.
Fig. 3(a) and (b) shows the SEM images depicting surface morphologies of the two types of resin beads. The average sizes of the two resin beads are approximate to 500 μm. Moreover, the surfaces of resin beads are relatively smooth. In order to gain further information about Pt particle size distribution, TEM characterization is also performed.
Fig. 3(c)–(f) shows the representative TEM images of Pt/resin-SH and Pt/resin-NH samples and corresponding Pt particle size distributions. Compared with the average particle size (
i.e., 4.9 nm) of Pt/resin-SH catalyst, the Pt/resin-NH catalyst has a slightly smaller size of 3.4 nm. This trend is in accordance with the previous XRD results.
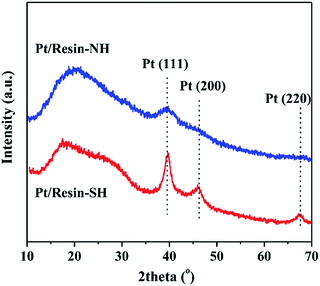 |
| | Fig. 2 XRD patterns of Pt/resin-NH and Pt/resin-SH catalysts. | |
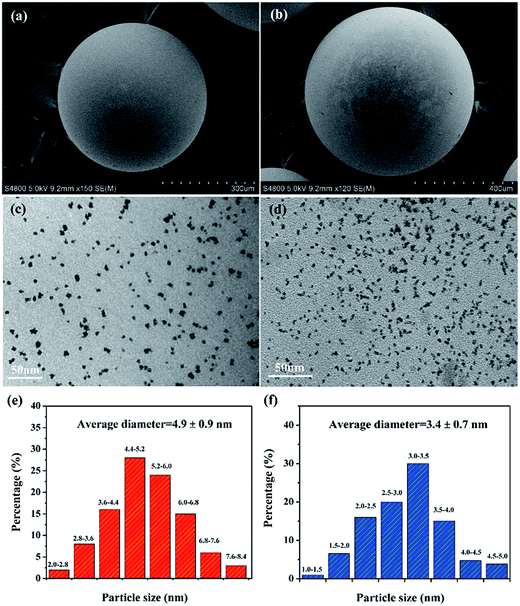 |
| | Fig. 3 SEM images of resin-SH (a) and resin-NH (b); representative TEM images and corresponding particle size distributions of Pt/resin-SH (c and e) and Pt/resin-NH (d and f). The scale bars in (c and d) represent 50 nm. | |
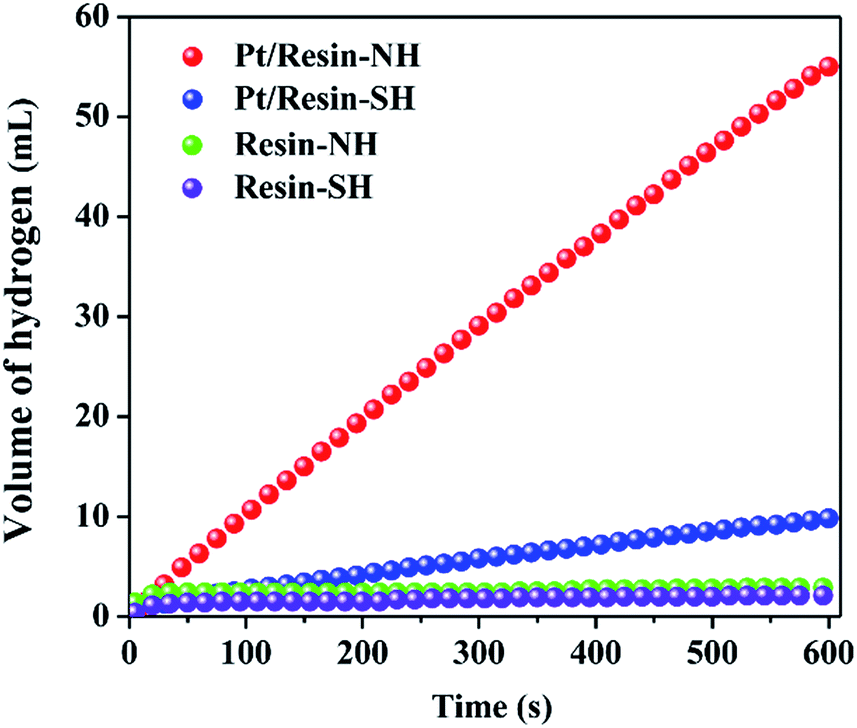
Pt/resin-SH and Pt/resin-NH catalysts with the same Pt loadings of 2 wt% are then tested for NaBH4 hydrolysis in order to elucidate the effect of surface functional groups on HGR. Fig. 4 shows the catalytic performance of the two catalysts. The acidic polystyrene polymer could lead to self-hydrolysis of NaBH4 to hydrogen. However, neglectable hydrogen is generated within a very short period of time when the polystyrene polymer resin-SH is added to solution. This is because H+ ions left on the surface of polymer beads are completely consumed, thus stopping the hydrolysis reaction of NaBH4. The similar phenomenon is also confirmed by Chen et al.38 Clearly, the pure resin-NH and resin-SH supports all show neglectable HRG rate, excluding the influence of acidity on catalytic performance. In addition, the Pt/resin-NH catalyst exhibits much higher HGR of 5500 mL min−1 gPt−1 than Pt/resin-SH catalyst (i.e., 980 mL min−1 gPt−1).
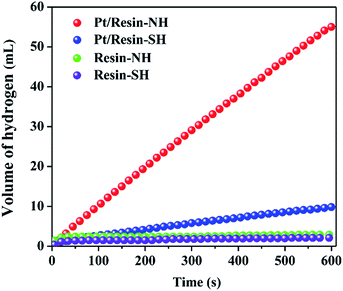 |
| | Fig. 4 Effects of surface functional group on hydrogen generation performance in 0.5 mol L−1 NaBH4 solution containing 0.5 mol L−1 NaOH at 25 °C. | |
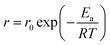
In order to further confirm the effect of surface functional group on performance, the HGR at various reaction temperature is also investigated, as shown in Fig. 5(a) and (b). For Pt/resin-NH catalyst, the HGR increases from 5500 to 24400 mL min−1 gPt−1 with the rise of reaction temperature from 25 to 55 °C. In comparison, the HGR only grows from 980 to 6800 mL min−1 gPt−1 in the same temperature range for Pt/resin-SH catalyst. This temperature dependent reaction rate can be used to evaluate the activation energy by Arrhenius eqn (3):
| |
 | (3) |
where
r is the reaction rate (mL min
−1 g
Cat−1),
Ea is the activation energy (kJ mol
−1),
R is the gas constant (8.3145 J mol
−1 K
−1) and
T is the absolute temperature (K). The calculated activation energy of Pt/resin-NH and Pt/resin-SH catalysts are 40.99 and 64.27 kJ mol
−1, respectively. The lower activation energy of Pt/resin-NH confirms the conclusion that the hydrolysis reaction is more easily to take place on Pt/resin catalyst with –N(CH
3)
3OH than with –SO
3H group.
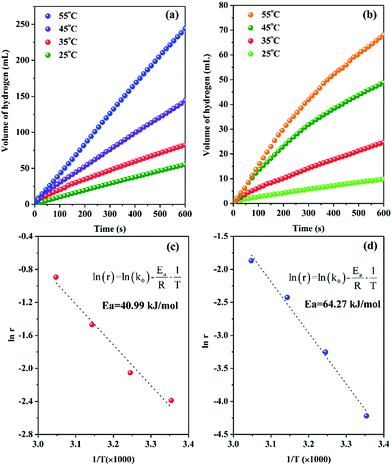 |
| | Fig. 5 Hydrogen generation performance at different temperature and activation energy on Pt/resin-NH (a and c) and Pt/resin-SH (b and d) catalysts. | |
It should be noted that pure resin-SH and resin-NH supports show neglectable H2 generation rate, nevertheless, Pt/resin catalysts with same Pt loadings and preparation parameters (e.g., preparation and drying temperature, mixing time and charging sequence39,40) but different surface functional groups exhibit quite different performance. Therefore, the catalytic performance of Pt catalysts should be originated from distinct metal–support interaction which is mainly affected by the different surface properties of polymer supports. Firstly, it is noted from Fig. 3 that Pt/resin catalyst with keenly controlled preparation parameters exhibit slightly different Pt nanoparticle sizes. From the perspective of geometric effect, the slightly different Pt nanoparticle sizes could contribute to the distinct catalytic performance since Kojima33 founded that as the crystallite size of Pt decreases, the HGR increases. The surface acidic oxygen surface groups on resin-SH could be considered as weak anchoring sites.41 On resin-NH, the basic N-functionality with moderate strength could also show strong interaction with H2PtCl6 during impregnation and act as the anchoring site for the hexachloroplatinic anion.42,43 In addition, during the preparation process of Pt/resin-NH catalyst, part of –N(CH3)3OH can exist as –N(CH3)3+ which may also interact with hexachloroplatinic anion,38 favoring the Pt dispersion on the resin surface. This result is also in consistent with the previous finding that surface functionalization of the support could affect the Pt dispersion by strong metal–support interaction.44 Moreover, the presence of abundant oxygen containing groups (i.e., –OH) on resin-NH can enhance the hydrophilicity of the support and thus facilitate the stabilization of the Pt NPs, resulting in a better dispersion.45 This should be one main effect of surface functional group on catalytic performance.
Besides the geometric effect, the role of surface functional groups is also investigated from the perspective of electronic effect by XPS characterizations. Fig. 6 shows the corresponding X-ray photoelectron spectra. Comparing the binding energy of pure Pt (71.2 eV)46 with that of metallic Pt on resin-NH support (70.8 eV), there is a negative shift of 0.4 eV. This is mainly caused by the strong metal–support interactions which results in electron transfer from the support to Pt, leading to a decrease in d-band vacancy.47 Moreover, compared with the binding energy of Pt/resin-SH catalyst (71.3 eV), a negative shift of Pt 4f7/2 binding energy of Pt/resin-NH catalyst is also observed. In other words, the metallic Pt NPs supported on resin-NH has much lower binding energy than that on resin-SH. This negative shift of Pt binding energy makes Pt as electron-enriched metal active sites, which could facilitate the electronic conductivity during hydrolysis reaction by providing hydrogen in hydridic form, which then leaves the metal sites and reacts with a H2O molecule to produce H2 and OH ion.48 This should be another effect of surface functional group on the catalytic performance.
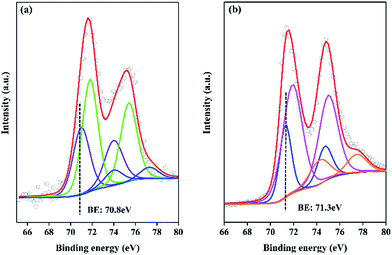 |
| | Fig. 6 X-ray photoelectron spectra of Pt 4f levels for Pt/resin-NH (a) and Pt/resin-SH (b) catalysts. | |
3.2 Influence of NaOH concentration
In general, NaOH is added to the solution of NaBH4 as the stabilizer in order to keep the NaBH4 solution stable at the room temperature. However, the concentration of NaOH greatly affects the catalytic performance. Fig. 7 shows the influence of NaOH concentration on catalytic performance. With the increase of NaOH concentration from 0.25 to 4 mol L−1, the HGR decreases from 8100 to 1699 mL min−1 gPt−1. The negative effect of NaOH concentration agrees with the results in literature.49 This is mainly because there are three main steps in the hydrolysis of NaBH4 on the catalyst surface such as NaBH4 adsorption, NaBH4 hydrolysis and H2 desorption from the catalyst surface. The adsorption of BH4− on the catalyst surface is reported to be the rate-determining step.50 Therefore, the increase in the concentrate of OH− would increase the alkalinity and viscosity of the solution. The OH− may adsorb competitively with BH4− on the catalyst surface, resulting in the decrease in the reaction rate. The above result that HGR decreases with the increase of NaOH concentration together with the neglectable HGR of the pure resin catalyst (Fig. 4) demonstrate that the higher catalytic performance of Pt/resin-NH catalyst is not due to the higher basicity of resin-NH support.
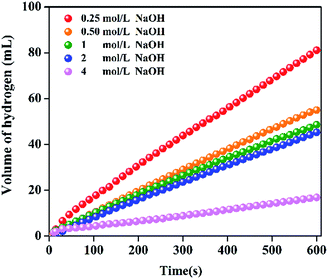 |
| | Fig. 7 Hydrogen generation performance at different concentration of NaOH ranging from 0.25 to 4 mol L−1 for Pt/resin-NH catalyst. | |
To sum up, the reason for the higher performance of resin-NH supported Pt catalyst should be mainly due to the different metal–support interaction which are affected by surface functional groups. On the one hand, the presence of –N(CH3)3OH and abundant –OH groups facilitate the dispersion of Pt nanoparticles, resulting in slightly smaller Pt nanoparticles which are more active towards NaBH4 hydrolysis. On the other hand, the presence of –N(CH3)3OH and abundant –OH groups results in a negative shift of Pt binding energy, which leads to the formation of electron-enriched Pt active sites and favors the electronic conductivity during hydrolysis reaction (Fig. 8). Table S1† shows the catalytic performance of reported catalysts51–55 for NaBH4 hydrolysis. It can also be seen that compared with other efficient catalysts, the Pt/resin-NH catalyst also exhibit good performance due to the presence of unique surface functional groups. Although bimetallic Pt–Ru/LiCoO2 shows higher HGR, the monometallic Pt/resin-NH catalyst still shows promising performance since it can be further improved by adding another metallic promoter. More importantly, these results provided in this work offer a new direction of designing more effective supported metal catalysts for NaBH4 hydrolysis by manipulating surface functional groups of support. Further enhancing the catalytic activity of supported metal catalysts on other materials such as carbon using the strategy in this work is also an interesting topic and will be carried out in our future study.
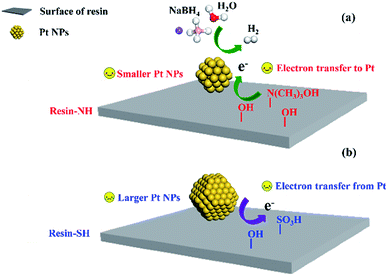 |
| | Fig. 8 NaBH4 hydrolysis over Pt/resin-NH (a) and Pt/resin-SH (b) catalysts with different surface functional groups. | |
4. Conclusions
In this work, effect of surface functional groups on HGR for NaBH4 hydrolysis are elucidated using two kinds of polystyrene resin supported Pt catalysts, i.e., resin-NH containing –N(CH3)3OH and abundant –OH groups and resin-SH containing –SO3H and less –OH groups. By excluding the effect of basicity and Pt loadings on catalytic performance, it is found that the Pt/resin-NH catalyst exhibits a much higher HGR (5500 mL min−1 gPt−1) than Pt/resin-SH catalyst (980 mL min−1 gPt−1) at room temperature. This is also confirmed by a lower activation energy of Pt/resin-NH (40.99 kJ mol−1) than that of Pt/resin-SH catalyst (64.27 kJ mol−1). Compared with the average nanoparticle size of Pt/resin-SH catalyst (4.9 nm), that of Pt/resin-NH catalyst is slightly smaller (3.4 nm). In addition, compared with the binding energy of Pt/resin-SH catalyst (71.3 eV), a negative shift of Pt 4f7/2 binding energy of Pt/resin-NH catalyst is also observed. Consequently, the surface functional groups on resin-NH not only facilitate the dispersion of Pt on support which results in smaller-sized Pt nanoparticles, but also reduces Pt binding energy which leads to the formation of electron-enriched Pt active sites and better electronic conductivity.
Acknowledgements
This work is financially supported by the Natural Science Foundation of China (21606254), Natural Science Foundation of Shandong Province (ZR2016BB16), Special Grade of the China Postdoctoral Science Foundation (2016T90657) and postdoctoral innovation project of Shandong (201601011).
Notes and references
- U. B. Demirci, O. Akdim, J. Andrieux, J. Hannauer, R. Chamoun and P. Miele, Fuel Cells, 2010, 10, 335 CrossRef CAS.
- Y. Chen, L. Liu, Y. Wang and H. Kim, Fuel Process. Technol., 2011, 92, 1368 CrossRef CAS.
- A. Pinto, M. Ferreira, V. Fernandes and C. Rangel, Catal. Today, 2011, 170, 40 CrossRef CAS.
- L. Schlapbach and A. Züttel, Nature, 2001, 414, 353 CrossRef CAS PubMed.
- W. Chen, J. Ji, X. Duan, G. Qian, P. Li, X. Zhou, D. Chen and W. Yuan, Chem. Commun., 2014, 50, 2142 RSC.
- H. Schlesinger, H. C. Brown, A. Finholt, J. R. Gilbreath, H. R. Hoekstra and E. K. Hyde, J. Am. Chem. Soc., 1953, 75, 215 CrossRef CAS.
- D. Hua, Y. Hanxi, A. Xinping and C. Chuansin, Int. J. Hydrogen Energy, 2003, 28, 1095 CrossRef.
- J. Ingersoll, N. Mani, J. Thenmozhiyal and A. Muthaiah, J. Power Sources, 2007, 173, 450 CrossRef CAS.
- S. C. Amendola, S. L. Sharp-Goldman, M. S. Janjua, N. C. Spencer, M. T. Kelly, P. J. Petillo and M. Binder, Int. J. Hydrogen Energy, 2000, 25, 969 CrossRef CAS.
- H. C. Brown and C. A. Brown, J. Am. Chem. Soc., 1962, 84, 1493 CrossRef CAS.
- S. Jeong, R. Kim, E. Cho, H. J. Kim, S. W. Nam, I. H. Oh, S. A. Hong and S. H. Kim, J. Power Sources, 2005, 144, 129 CrossRef CAS.
- J. C. Walter, A. Zurawski, D. Montgomery, M. Thornburg and S. Revankar, J. Power Sources, 2008, 179, 335 CrossRef CAS.
- B. H. Liu, Z. P. Li and S. Suda, J. Alloys Compd., 2006, 415, 288 CrossRef CAS.
- S. C. Amendola, S. L. Sharp-Goldman, M. S. Janjua, M. T. Kelly, P. J. Petillo and M. Binder, J. Power Sources, 2000, 85, 186 CrossRef CAS.
- P. Krishnan, T. H. Yang, W. Y. Lee and C. S. Kim, J. Power Sources, 2005, 143, 17 CrossRef CAS.
- D. Xu, H. Zhang and W. Ye, Catal. Commun., 2007, 8, 1767 CrossRef CAS.
- C. Wu, H. Zhang and B. Yi, Catal. Today, 2004, 93, 477 CrossRef.
- A. Boran, S. Erkan, S. Ozkar and I. Eroglu, Int. J. Energy Res., 2013, 37, 443 CrossRef CAS.
- X. Zhang, Z. Wei, Q. Guo and H. Tian, J. Power Sources, 2013, 231, 190 CrossRef CAS.
- Y. Li, Q. Zhang, N. Zhang, L. Zhu, J. Zheng and B. H. Chen, Int. J. Hydrogen Energy, 2013, 38, 13360 CrossRef CAS.
- Z. Li, H. Li, L. Wang, T. Liu, T. Zhang, G. Wang and G. Xie, Int. J. Hydrogen Energy, 2014, 39, 14935 CrossRef CAS.
- H. Cai, L. Liu, Q. Chen, P. Lu and J. Dong, Energy, 2016, 99, 129 CrossRef CAS.
- H. Cai, P. Lu and J. Dong, Fuel, 2016, 166, 297 CrossRef CAS.
- A. D. Chowdhury, N. Agnihotri and A. De, Chem. Eng. J., 2015, 264, 531 CrossRef CAS.
- M. Dinç, Ö. Metin and S. Özkar, Catal. Today, 2012, 183, 10 CrossRef.
- F. Li, E. E. Arthur, D. La, Q. Li and H. Kim, Energy, 2014, 71, 32 CrossRef CAS.
- Y. J. Shih, C. C. Su, Y. H. Huang and M. C. Lu, Energy, 2013, 54, 263 CrossRef CAS.
- A. H. Tamboli, A. A. Chaugule, F. A. Sheikh, W. J. Chung and H. Kim, Energy, 2015, 89, 568 CrossRef CAS.
- E. Petit, P. Miele and U. B. Demirci, ChemSusChem, 2016, 9(14), 1777–1780 CrossRef CAS PubMed.
- Ö. Şahin, M. S. İzgi, E. Onat and C. Saka, Int. J. Hydrogen Energy, 2016, 41, 2539 CrossRef.
- U. Demirci and F. Garin, J. Mol. Catal. A: Chem., 2008, 279, 57 CrossRef CAS.
- U. Demirci and F. Garin, Catal. Commun., 2008, 9, 1167 CrossRef CAS.
- Y. Kojima, K.-I. Suzuki, K. Fukumoto, M. Sasaki, T. Yamamoto, Y. Kawai and H. Hayashi, Int. J. Hydrogen Energy, 2002, 27, 1029 CrossRef CAS.
- W. Chen, J. Ji, X. Feng, X. Duan, G. Qian, P. Li, X. Zhou, D. Chen and W. Yuan, J. Am. Chem. Soc., 2014, 136, 16736 CrossRef CAS PubMed.
- I. Jang, J. Sung, H. Choi and I. Chin, J. Mater. Sci., 2005, 40, 3021 CrossRef CAS.
- S.-H. Lim and S. M. Hudson, Carbohydr. Res., 2004, 339, 313 CrossRef CAS PubMed.
- K. Takemura, J. Appl. Phys., 2001, 89, 662 CrossRef CAS.
- C. H. Liu, B. H. Chen, C. L. Hsueh, J.-R. Ku, M.-S. Jeng and F. Tsau, Int. J. Hydrogen Energy, 2009, 34, 2153 CrossRef CAS.
- X. Feng, X. Duan, H. Cheng, G. Qian, D. Chen, W. Yuan and X. Zhou, J. Catal., 2015, 325, 128 CrossRef CAS.
- X. Feng, Y. Liu, Y. Li, C. Yang, Z. Zhang, X. Duan, X. Zhou and D. Chen, AIChE J., 2016, 62(11), 3963–3972 CrossRef CAS.
- K. E. Swider and D. R. Rolison, Electrochem. Solid-State Lett., 2000, 3, 4 CrossRef CAS.
- F. Su, Z. Tian, C. K. Poh, Z. Wang, S. H. Lim, Z. Liu and J. Lin, Chem. Mater., 2009, 22, 832 CrossRef.
- B. P. Vinayan, R. Nagar, N. Rajalakshmi and S. Ramaprabhu, Adv. Funct. Mater., 2012, 22, 3519 CrossRef CAS.
- T. Maiyalagan, Appl. Catal., B, 2008, 80, 286 CrossRef CAS.
- X. Li, G. Fan and C. Zeng, Int. J. Hydrogen Energy, 2014, 39, 14927 CrossRef CAS.
- J. Contour, G. Mouvier, M. Hoogewys and C. Leclere, J. Catal., 1977, 48, 217 CrossRef CAS.
- N. G. Akalework, C. J. Pan, W. N. Su, J. Rick, M. C. Tsai, J. F. Lee, J. M. Lin, L. D. Tsai and B. J. Hwang, J. Mater. Chem., 2012, 22, 20977 RSC.
- R. Pena-Alonso, A. Sicurelli, E. Callone, G. Carturan and R. Raj, J. Power Sources, 2007, 165, 315 CrossRef CAS.
- Y. Shang, R. Chen and G. Jiang, Int. J. Hydrogen Energy, 2008, 33, 6719 CrossRef CAS.
- J. Zhang, W. Delgass, T. Fisher and J. Gore, J. Power Sources, 2007, 164, 772 CrossRef CAS.
- N. Sahiner, T. Turhan and L. A. Lyon, Energy, 2014, 66, 256 CrossRef CAS.
- T. Turhan, Y. A. Güvenilir and N. Sahiner, Energy, 2013, 55, 511 CrossRef CAS.
- S. Yildiz, N. Aktas and N. Sahiner, Int. J. Hydrogen Energy, 2014, 39, 14690 CrossRef CAS.
- N. Sahiner, S. Yildiz and H. A. Lohedan, Appl. Catal., B, 2015, 166–167, 145 CrossRef CAS.
- P. Krishnan, K. L. Hsueh and S. D. Yim, Appl. Catal., B, 2007, 77, 206 CrossRef CAS.
Footnote |
| † Electronic supplementary information (ESI) available. See DOI: 10.1039/c6ra25016e |
|
| This journal is © The Royal Society of Chemistry 2016 |
Click here to see how this site uses Cookies. View our privacy policy here. 
 Open Access Article
 This Open Access Article is licensed under a Creative Commons Attribution-Non Commercial 3.0 Unported Licence