Evaluation of graphene-wrapped LiFePO4 as novel cathode materials for Li-ion batteries

Sungun Wi a, Jaewon Kima, Kimin Parka, Sangheon Leea, Joonhyeon Kanga, Kyung Hwan Kima, Seunghoon Nam*b, Chunjoong Kim*c and Byungwoo Park*a
aWCU Hybrid Materials Program, Department of Materials Science and Engineering, Research Institute of Advanced Materials, Seoul National University, Seoul 08826, Korea. E-mail: byungwoo@snu.ac.kr; Fax: +82-2-885-9671; Tel: +82-2-880-8319
bDepartment of Nano Mechanics, Nano Mechanical Systems Research Division, Korea Institute of Machinery and Materials (KIMM), Daejeon 34103, Korea. E-mail: kwek14@kimm.re.kr; Fax: +82-42-868-7824; Tel: +82-42-868-7182
cSchool of Materials Science and Engineering, Chungnam National University, Daejeon 34134, Korea. E-mail: ckim0218@cnu.ac.kr; Fax: +82-42-822-5850; Tel: +82-42-821-5635

Received 2nd October 2016 , Accepted 28th October 2016

First published on 28th October 2016


Abstract

Graphene-wrapped LiFePO4 (LiFePO4/G) is introduced as a cathode material for Li-ion batteries with an excellent rate capability. A straightforward solid-state reaction between graphene oxide-wrapped FePO4 and a lithium precursor resulted in highly conducting LiFePO4/G composites, which feature ∼70 nm-sized LiFePO4 crystallites with robust connection to the external graphene network. This unique morphology enables all LiFePO4 particles to be readily accessed by electrons during battery operation, leading to a remarkably enhanced rate capability. The in situ electrochemical impedance spectra were studied in detail throughout charge and discharge processes, by which enhanced electronic conductance and thereby reduced charge transfer resistance was confirmed as the origin of the superior performance in the novel LiFePO4/G.

Introduction

Since the first study by the Goodenough group in 1997, LiFePO4 has been considered one of the most promising cathode materials for lithium ion batteries due to its high theoretical capacity (170 mA h g−1), moderate operating voltage (3.4 V vs. Li+/Li), environmental benignity, long cycle life, superior safety, and low material cost.1–3 However, there are several disadvantages in using LiFePO4 for wider use in the market. The main obstacles are the poor electronic conductivity (∼10−9 S cm−1) and low ion-transfer coefficient (∼10−15 cm2 s−1), which result from a small polaron hoping and the one-dimensional (1D) lithium-ion diffusion channel, respectively.4–6 Aiming to solve these problems, many efforts have been made to improve the electrochemical performance of LiFePO4, by modifying surface with electronically conductive layers,7–14 reducing Li+-diffusion lengths,15,16 or doping with supervalent ions.17 Of these methods, coating with carbonaceous materials is the most common and effective way to enhance the electrical conductivity of LiFePO4.7–12 Among derivatives of carbon, graphene has attracted tremendous interests due to its intrinsic characteristics (superior electronic conductivity, high mechanical strength, structural flexibility, and large surface area), and therefore graphene can offer an improved interfacial contact to LiFePO4.18–27 Of particular note is stacking graphene on the surface of target materials via electrostatic interaction to incorporate graphene.18,20,23,24 In the case of directly attaching graphene on the surface of active materials via electrostatic interactions, LiFePO4 nanoparticles easily becomes aggregated, which inhibits individual graphene from wrapping or coating around each LiFePO4 nanoparticle. As a result, these aggregated active materials, which cannot be benefitted from the incorporated graphene, will be left electronically isolated, resulting in unsatisfactory electrochemical performances.22–24

Herein, we report on an effective strategy to obtain graphene-wrapped LiFePO4 from graphene oxide-wrapped metal phosphate and a Li precursor, instead of simple graphene wrapping on prepared LiFePO4 particles. The subsequent solid-state reaction led to a composite of LiFePO4 and three-dimensional (3D) conducting networks of graphene on the LiFePO4 surface, and as such composite is electronically percolated via the graphene sheets. The method of precursor-incorporated graphene-wrapping proved to exhibit a faster electron transfer rate than the conventional graphene-wrapping.18 The graphene-wrapped LiFePO4 achieved a high capacity of ∼165 mA h g−1 (theoretical capacity: 170 mA h g−1) at a discharge rate of 0.1C (1C = 170 mA g−1) and ∼100 mA h g−1 even at a rate of 10C. In addition, the origin of superior electrochemical performance of the graphene-wrapped LiFePO4 was investigated by in-depth in situ analysis of the electrochemical impedance spectroscopy.

Experimental

Synthesis of graphene-wrapped LiFePO4

FePO4 nanoparticles were synthesized using FeCl3 and NH4H2PO4. 100 ml of a distilled water solution containing FeCl3 (0.02 M) was slowly added to 200 ml of deionized (DI) water solution containing NH4H2PO4 (0.02 M). The reaction mixture was stirred for 5 h at room temperature, then the resulting FePO4 nanoparticles were centrifuged and washed several times with DI water. The obtained yellow precipitate was dried at 200 °C under vacuum overnight with its change of color to dark green.

The modified Hummers' method was used to synthesize graphene oxide (GO), and the details are described elsewhere.11,18,28 Prior to GO wrapping, the surface of FePO4 was modified to be favourable for assembly with GO. In a typical process, the dried FePO4 powder was dispersed in 100 ml of anhydrous ethanol by ultrasonication for 1 h. Then, aminopropyltriethoxysilane (C9H23NO3Si: APTES, 1 ml) was injected into a FePO4 ethanol dispersion, followed by being kept under constant stirring overnight. The APTES induces positive charges on the surface of the FePO4 particles. The fabrication of graphene-oxide-wrapped FePO4 was rendered by electrostatic interactions between positively-charged APTES-modified FePO4 and negatively-charged graphene oxide.29–33 For the self-assembly, an aqueous graphene-oxide suspension (100 ml, 1 mg ml−1) was added into the APTES-modified FePO4 dispersion (500 ml, 1 mg ml−1) under stirring for 1 h. The FePO4/GO powder was collected by centrifuge, and dried for 12 h. The resulting powder was mixed thoroughly with lithium acetate (C2H3LiO2) as a lithium precursor at a Li[thin space (1/6-em)]:[thin space (1/6-em)]Fe molar ratio of 1.05[thin space (1/6-em)]:[thin space (1/6-em)]1, followed by annealing at 600 °C for 10 h under H2/Ar (5 vol% H2 in argon) atmosphere. After the pyrolysis, the graphene oxide turned into graphene (reduced graphene oxide), and the graphene-wrapped LiFePO4 (LiFePO4/G) could be obtained. The terminology “graphene” was used throughout this article for the convenience's sake, although it is actually reduced graphene oxide.

For comparison, LiFePO4 without graphene (bare LiFePO4) and graphene-wrapped commercial LiFePO4 (c-LiFePO4/G) were also prepared in a similar manner. Bare LiFePO4 was synthesized by the same method as above, except the use of graphene oxide. As for the c-LiFePO4/G, the surface modification of commercial LiFePO4 powder (Sigma-Aldrich) was performed by mixing APTES with commercial LiFePO4 in ethanol dispersion for 12 h. The resulting well-dispersed solution was slowly added to GO solution, and gently stirred for 1 h. The obtained graphene-wrapped commercial LiFePO4 powder was centrifuged, and dried for 12 h. Thermal reduction of GO was carried out under H2/Ar (5 vol% H2 in argon) at 600 °C for 3 h.

Characterization

The crystal structures of the prepared samples were characterized by X-ray diffraction (XRD, D8 Advance: Bruker). The morphologies of synthesized materials were analyzed using a field-emission scanning electron microscopy (FE-SEM, Merlin Compact: Zeiss) and high-resolution transmission electron microscopy (HRTEM, JEM-3000F: JEOL, Japan). The graphene amount in the composites was measured using a CHNS analyzer (Flash EA 1112: Thermo Electron Corp.).

For the electrochemical characterization, the active materials were tested by using coin-type half cells (2016 type) with a Li counter electrode. The composition of the electrode was set to be the same for all samples, which consisted of an active material, super P carbon black, and a polyvinylidene fluoride (PVDF) binder with a weight ratio of 7[thin space (1/6-em)]:[thin space (1/6-em)]2[thin space (1/6-em)]:[thin space (1/6-em)]1. Loading level of active materials was ∼1 mg cm−2. The electrolyte contained 1 M LiPF6 in ethylene carbonate and diethyl carbonate (1/1 vol%) (Panax Etec). The cells were charged and discharged between 4.3 and 2 V by applying various current densities. The cycling tests were performed at a constant current density of 170 mA g−1 (1C rate based on the theoretical capacity of LiFePO4). The specific capacity was calculated based on the mass of only LiFePO4. Electrochemical impedance spectra (EIS) were measured using a potentiostat (CHI 608C: CH Instrumental Inc.) from 10 mHz to 100 kHz with an AC amplitude of 5 mV.

Results and discussion

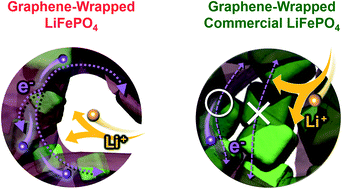
A schematic depicts how graphene-wrapped LiFePO4 (LiFePO4/G) and graphene-wrapped commercial LiFePO4 (c-LiFePO4/G) are synthesized, as shown in Fig. 1 and S1. In the case of LiFePO4/G (Fig. 1), the positively-charged FePO4 nanoparticles (Fig. S2, prepared through the surface modification by APTES) attracted the negatively-charged graphene oxide (GO) to assemble themselves into GO-wrapped FePO4 (GO/FePO4) nanocomposites. After the electrostatic self-assembly, the GO/FePO4 nanoparticles were thoroughly mixed with lithium acetate followed by annealing under a reducing atmosphere to obtain LiFePO4/G. In this solid-state reaction, the graphene sheets became crimped, and connected to form a conducting 3D network, while the LiFePO4 nanoparticles were confined, and wrapped by this graphene matrix. These well-connected graphene sheets not only act as a conductive network for LiFePO4 particles, but also constrain the size of LiFePO4 from getting larger during the heat treatment. For c-LiFePO4/G, on the other hand, the likelihood that each LiFePO4 particle is confined and connected by GO sheets is relatively small Fig. S1. Because of the non-uniform contact between LiFePO4 and graphene, the electrons could reach only the LiFePO4 particles that are directly attached to graphene during electrochemical cycling. As a result, the transport of electrons in c-LiFePO4/G is limited, leading to low utilization of LiFePO4 at a given charge/discharge rate.
image file: c6ra24514e-f1.tif
Fig. 1 Schematic illustration showing the synthetic process for the graphene-wrapped LiFePO4.

Transmission electron microscopy (TEM) images in Fig. 2a and b revealed that the FePO4 nanoparticles were fully wrapped by the flexible GO. While the SEM images (Fig. 2c and d) could not visualize the crinkled textures associated with the presence of flexible graphene sheets, high magnification TEM clearly exhibited that most of the LiFePO4 nanoparticles were well-wrapped by the 3D network of flexible graphene sheets (Fig. 2e–g). The HRTEM image in Fig. 2h clearly shows lattice fringes, corresponding to the (101) plane of LiFePO4. On the contrary, for c-LiFePO4/G, only a few LiFePO4 particles were attached to the graphene sheets (Fig. S3).


image file: c6ra24514e-f2.tif
Fig. 2 (a and b) TEM images of the graphene oxide-wrapped FePO4. (c and d) SEM images of the graphene-wrapped LiFePO4. (e and f) TEM images of the graphene-wrapped LiFePO4. (g and h) HRTEM images of local areas in the graphene-wrapped LiFePO4 as marked in (f).

The graphene content in LiFePO4/G composite was 1.7 wt% (from CHN analysis, Table S1), which is lower than that of the conventional carbon-coated and/or graphene-wrapped active material having ∼10 wt%.11,15 The average grain size of graphene-wrapped LiFePO4 particles estimated from the Scherrer equation (Fig. S4) was ∼80 nm,11–13 which is consistent with the size distribution of graphene-wrapped LiFePO4 grains from the SEM images, as shown in Fig. S5. When compared with LiFePO4 particles synthesized without GO (∼400 nm), the size of graphene-wrapped LiFePO4 particles was smaller (Fig. S3 and Table S1). These results confirm that even small amount of graphene layer (∼1.7 wt%) successfully prevent the growth of LiFePO4 nanoparticles during the annealing process.

In order to investigate the battery performance of the graphene-wrapped LiFePO4 and the effect of the graphene layers, the bare LiFePO4, graphene-wrapped commercial LiFePO4, (c-LiFePO4/G), and graphene-wrapped LiFePO4 (LiFePO4/G) were cycled at various current densities (sequentially from 0.1C to 10C) (Fig. 3a–c). The battery performance of the bare LiFePO4 was very poor due to the low electronic conductance, the large grain size (∼400 nm), and the agglomeration of the active particles leading to reduction of the exposed surfaces to the liquid electrolyte (Fig. S3a and b). Even at a discharge rate of 0.1C, the bare LiFePO4 showed a low capacity less than 50 mA h g−1 (Fig. 3a), which is consistent with previous studies.34–36 On the contrary, the formation of the surface-conducting layer (graphene) dramatically improved the capacity of both the commercial and synthesized LiFePO4. Particularly, the LiFePO4/G samples showed much better rate capability than that of the c-LiFePO4/G with distinguishable features between them, as seen in Fig. 3d. The discharge capacity of LiFePO4/G at a discharge rate of 0.1C was ∼165 mA h g−1 (∼97% of the theoretical capacity), and a specific capacity of ∼100 mA h g−1 could be retained at a 10C rate (∼60% of the capacity at a rate of 0.1C). In comparison with the excellent performance of LiFePO4/G, the discharge capacity of c-LiFePO4/G at a rate of 10C was ∼30 mA h g−1 (∼30% of the initial capacity at a rate of 0.1C). The degree of polarization in the voltage profile is much less significant for LiFePO4/G whereas c-LiFePO4/G shows high polarization resistance with a limited flat-potential region (Fig. 3b and c). When the cycling performance of the LiFePO4/G was investigated at a rate of 1C (Fig. 3e), the LiFePO4/G still delivered a discharge capacity of ∼115 mA h g−1 after 500 cycles which is about 86% of the initial capacity. The LiFePO4/G has high specific capacity and excellent rate capability under fast discharging conditions, and this remarkable performance is attributed to the well-connected electron percolation among the LiFePO4 nanoparticles via the graphene sheets. Comparison of this superior rate capability of the LiFePO4/G with those of the previously-reported graphene-wrapped LiFePO4 (Fig. 3f)21–26 indicates that the LiFePO4/G outperforms the others, or at least, it is competitive amongst other graphene-wrapped LiFePO4.


image file: c6ra24514e-f3.tif
Fig. 3 Charge–discharge curves of the (a) bare LiFePO4, (b) graphene-wrapped commercial LiFePO4, and (c) graphene-wrapped LiFePO4. (d) Rate capability of the bare LiFePO4, graphene-wrapped commercial LiFePO4, and graphene-wrapped LiFePO4 (1C = 170 mA g−1). (e) Cycling performance of graphene-wrapped LiFePO4 at a rate of 1C. (f) Comparison of the rate capability between this study and typical graphene-wrapped LiFePO4.

The origin of the enhanced electrochemical properties for the LiFePO4/G was identified by in situ electrochemical impedance spectroscopy (EIS). The EIS spectra were measured point by point at a rate of 0.1C (Fig. 4a and b). During lithiation/delithiation, the cell was switched off every hour to observe the EIS spectra at each open-circuit potential (OCP), in correspondence to the points marked by circles in the voltage profiles of Fig. 4a and b. By fitting trace of the spectra, the charge-transfer resistances and apparent Li+ diffusivities were derived, and plotted in Fig. 5a and b.


image file: c6ra24514e-f4.tif
Fig. 4 The in situ impedance analysis results of (a) graphene-wrapped LiFePO4 and (b) graphene-wrapped commercial LiFePO4 at different state of charge (delithiation) and discharge (lithiation). It should be noted that different scales are used on both axes of the Nyquist plots for graphene-wrapped LiFePO4 and graphene-wrapped commercial LiFePO4. The circles in the voltage profiles indicate the intervals of impedance analysis.

image file: c6ra24514e-f5.tif
Fig. 5 (a) Charge-transfer resistance and (b) apparent Li+ diffusivity of graphene-wrapped LiFePO4 and graphene-wrapped commercial LiFePO4 at different state of charge (delithiation) and discharge (lithiation). Different scales on the axis should be noted for charge-transfer resistance. The red and green solid lines represent the voltage profiles of the graphene-wrapped LiFePO4 and graphene-wrapped commercial LiFePO4, respectively.

As shown in Fig. 5a, the charge-transfer resistance (Rct) of both the LiFePO4/G and the c-LiFePO4/G progressively increased with the depth of charge (delithiation), as reported by Delacourt et al.37 The differences in values of Rct were noticeable between the two which are prepared by different wrapping methods. Provided that electrolyte/electrode interfaces of the two electrodes are assumed to be the same (electrolyte/graphene), the enhanced charge transfer of LiFePO4/G can be attributed to the well-established electronic percolation of the electrode by the in situ confinement of LiFePO4 within graphene. On the contrary, the possible contact resistance between c-LiFePO4/G particles, as already described in Fig. S1, impedes the transport of electrons, the result of which is reflected in the greater Rct value. Upon lithiation, the charge transfer resistance of LiFePO4/G decreases down to Rct value at the pristine state, while that of the c-LiFePO4/G could not recover to its original Rct value (Table S2). It is possible that some of the c-LiFePO4/G loses contact with graphene when the volume of the LiFePO4 lattice shrinks by ∼6.8% on delithiation.2 Obviously, the reversibility of Rct for LiFePO4/G might come from the well-defined 3D graphene network that tightly encloses each nanoparticle.

In order to identify whether enhanced electronic conductance was the main contributor to the superior electrochemical properties of LiFePO4/G, the Li+ diffusivity (DEIS) within the olivine structure of the LiFePO4/G and c-LiFePO4/G was estimated according to the Warburg equation (eqn (S1)).38 As seen in Fig. 5b, a trend was apparent in the DEIS value profile along the delithiation depth for both LiFePO4/G and c-LiFePO4/G: the trend shows that the DEIS value initially decreases, but rises back at the last stage of delithiation.39 Since the diffusion of Li in LiFePO4, which occurs through the 〈010〉 direction, is hindered when the volume of LiFePO4 shrinks by ∼6.8% upon delithiation, the changes over the state of charge could be attributed to the coupling of the Li+ diffusion and the movement of two-phase boundary.32 In addition, the last stage of (de)lithiation that occurs through the solid solution reaction accounts for the abrupt increase in Li+ diffusivity at deep (dis)charged state.2,40

The absolute DEIS values are approximately two orders of magnitude higher for c-LiFePO4/G than that for LiFePO4/G. Even though the LiFePO4/G has a shorter Li+ diffusion path because of its relatively-small grain size (Table S1), overall higher Li+ diffusivity of c-LiFePO4/G shall be rooted from the higher crystallinity of the commercial LiFePO4. Since the solid state of Li+ diffusion in LiFePO4 lattice is governed by t = L2D−1, crystallinity of the commercial LiFePO4 compromises the Li diffusion time to be comparable to that of the LiFePO4/G. Hence, this comparative study indicates that the influence of solid-state diffusion of Li+ on the rate capabilities of the two samples is less significant. Instead, it can be concluded that the superior electrochemical performance of LiFePO4/G to c-LiFePO4/G mainly results from the boosted charge (especially electron) transfer that is rendered by the well-percolated conductive graphene network.

Conclusions

The graphene-wrapped LiFePO4 (LiFePO4/G) composites were synthesized by a simple solid-state reaction from graphene-wrapped FePO4 and lithium acetate. The LiFePO4/G had a specific capacity of ∼100 mA h g−1 even at a rate of 10C. The enhanced electrochemical performance arose from the graphene sheets' well-established framework, percolating through all of the LiFePO4 nanoparticles, which is confirmed by the reduced charge-transfer resistance. This effective cathode design could also be extended to other electrode materials, which promises to promote the development of next-generation Li-ion batteries.

Acknowledgements

This research was supported by the National Research Foundation of Korea (NRF: 2015K2A1A2070386 and 2016R1A2B4012938) and by the Office of Naval Research Global (ONRG: N62909-16-1-2083). C. Kim acknowledges the support from the NRF grant (2015R1D1A1A01056874).

Notes and references

  1. A. K. Padhi, K. S. Nanjundaswamy and J. B. Goodenough, J. Electrochem. Soc., 1997, 144, 1188–1194 CrossRef CAS.
  2. Y. S. Yu, C. Kim, D. A. Shapiro, M. Farmand, D. Qian, T. Tyliszczak, A. L. D. Kilcoyne, R. Celestre, S. Marchesini, J. Joseph, P. Denes, T. Warwick, F. C. Strobridge, C. P. Grey, H. Padmore, Y. S. Meng, R. Kostecki and J. Cabana, Nano Lett., 2015, 15, 4282–4288 CrossRef CAS PubMed.
  3. M. S. Whittingham, Chem. Rev., 2004, 104, 4271–4302 CrossRef CAS PubMed.
  4. J.-M. Tarascon and M. Armand, Nature, 2001, 414, 359–367 CrossRef CAS PubMed.
  5. M. Armand and J.-M. Tarascon, Nature, 2008, 451, 652–657 CrossRef CAS PubMed.
  6. B. Ellis, W. H. Kan, W. R. M. Makahnouk and L. F. Nazar, J. Mater. Chem., 2007, 17, 3248–3254 RSC.
  7. L. Cheng, J. Yan, G. N. Zhu, J. Y. Luo, C. X. Wang and Y. Y. Xia, J. Mater. Chem., 2010, 20, 595–602 RSC.
  8. J. Cho, J. G. Lee, B. Kim and B. Park, Chem. Mater., 2003, 15, 3190–3193 CrossRef CAS.
  9. S. Wi, J. Kim, S. Lee, J. Kang, K. H. Kim, K. Park, K. Kim, S. Nam, C. Kim and B. Park, Electrochim. Acta, 2016, 216, 203–210 CrossRef CAS.
  10. E. Lee, A. Murthy and A. Manthiram, Electrochem. Commun., 2011, 13, 480–483 CrossRef CAS.
  11. S. Wi, S. Nam, Y. Oh, J. Kim, H. Choi, S. Hong, S. Byun, S. Kang, D. J. Choi, K. Ahn, Y.-H. Kim and B. Park, J. Nanopart. Res., 2012, 14, 1327 CrossRef.
  12. H. H. Park, R. Heasley, L. Sun, V. Steinmann, R. Jaramillo, K. Hartman, R. Chakraborty, P. Sinsermsuksakul, D. Chua, T. Buonassisi and R. G. Gordon, Progress in Photovoltaics Research and Applications, 2015, 23, 901–908 CrossRef CAS.
  13. T. Hwang, D. Cho, J. Kim, J. Kim, S. Lee, B. Lee, K. H. Kim, S. Hong, C. Kim and B. Park, Nano Energy, 2016, 25, 91–99 CrossRef.
  14. J. S. Park, X. Meng, J. W. Elam, S. Hao, C. Wolverton, C. Kim and J. Cabana, Chem. Mater., 2014, 26, 3128–3134 CrossRef CAS.
  15. S. Nam, S. Kim, S. Wi, H. Choi, S. Byun, S.-M. Choi, S. L. Yoo, K. T. Lee and B. Park, J. Power Sources, 2012, 211, 154–160 CrossRef CAS.
  16. B. L. Ellis, W. R. Makahnouk, Y. Makimura, K. Toghill and L. F. Nazar, Nat. Mater., 2007, 6, 749–753 CrossRef CAS PubMed.
  17. S. Y. Chung, J. T. Bloking and Y.-M. Chiang, Nat. Mater., 2002, 1, 123–128 CrossRef CAS PubMed.
  18. Y. Oh, S. Nam, S. Wi, J. Kang, T. Hwang, S. Lee, H. H. Park, J. Cabana, C. Kim and B. Park, J. Mater. Chem. A, 2014, 2, 2023–2027 CAS.
  19. Y. Hwa, J. Zhao and E. J. Cairns, Nano Lett., 2015, 15, 3479–3486 CrossRef CAS PubMed.
  20. S. Nam, S. J. Yang, S. Lee, J. Kim, J. Kang, J. Y. Oh, C. R. Park, T. Moon, K. T. Lee and B. Park, Carbon, 2015, 85, 289–298 CrossRef CAS.
  21. C. Su, X. Bu, L. Xu, J. Liu and C. Zhang, Electrochim. Acta, 2012, 64, 190–195 CrossRef CAS.
  22. J. Wang, Y. Xu, J. Zhu and P. Ren, J. Power Sources, 2012, 208, 138–143 CrossRef CAS.
  23. J. Yang, J. Wang, Y. Tang, D. Wang, X. Li, Y. Hu, R. Li, G. Liang, T.-K. Sham and X. Sun, Energy Environ. Sci., 2013, 6, 1521–1528 CAS.
  24. W.-B. Luo, S.-L. Chou, Y.-C. Zhai and H.-K. Liu, J. Mater. Chem. A, 2014, 2, 4927–4931 CAS.
  25. W. K. Kim, W. H. Ryu, D. W. Han, S. J. Lim, J. Y. Eom and H. S. Kwon, ACS Appl. Mater. Interfaces, 2014, 6, 4731–4736 CAS.
  26. J. Ha, S.-K. Park, S.-H. Yu, A. Jin, B. Jang, S. Bong, I. Kim, Y.-E. Sung and Y. A. Piao, Nanoscale, 2013, 5, 8647–8655 RSC.
  27. Y. Shi, S.-L. Chou, J.-Z. Wang, D. Wexler, H.-J. Li, H.-J. Liu and Y. Wu, J. Mater. Chem., 2012, 22, 16465–16470 RSC.
  28. W. S. Hummers and R. E. Offeman, J. Am. Chem. Soc., 1958, 80, 1339 CrossRef CAS.
  29. D. Wang, H. Li, Z. Wang, X. Wu, Y. Sun, X. Huang and L. Chen, Solid State Chem., 2004, 177, 4582–4587 CrossRef CAS.
  30. Y. Lin, M. X. Gao, D. Zhu, Y. F. Liu and H. G. Pan, J. Power Sources, 2008, 184, 444–448 CrossRef CAS.
  31. J.-K. Kim, G. Cheruvally, J.-W. Choi, J.-U. Kim, J.-H. Ahn, G.-B. Cho, K.-W. Kim and H.-J. Ahn, J. Power Sources, 2007, 166, 211–218 CrossRef CAS.
  32. Y. Zhang, F. Gao, B. Wanjala, Z. Li, G. Cernigliaro and Z. Gu, Appl. Catal., B, 2016, 199, 504–513 CrossRef CAS.
  33. S. Wang, Q. Cai, M. Du, J. Xue and H. Xu, J. Phys. Chem. B, 2015, 119, 12059–12065 CrossRef CAS PubMed.
  34. J. S. Chen, Z. Wang, X. S. Dong, P. Chen and X. W. Lou, Nanoscale, 2011, 3, 2158–2161 RSC.
  35. Y.-T. Xu, Y. Guo, C. Li, X.-Y. Zhou, M. C. Tucker, X.-Z. Fu, R. Sun and C.-P. Wong, Nano Energy, 2015, 11, 38–47 CrossRef CAS.
  36. H. Zhu, X. Wu, L. Zan and Y. Zhang, ACS Appl. Mater. Interfaces, 2014, 6, 11724–11733 CAS.
  37. C. Delacourt, L. Laffont, R. Bouchet, C. Wurm, J.-B. Lefiche, M. Morcrette, J.-M. Tarascon and C. Masquelier, J. Electrochem. Soc., 2005, 152, A913–A921 CrossRef CAS.
  38. D. D. Lecce and J. Hassoun, J. Phys. Chem. C, 2015, 119, 20855–20863 Search PubMed.
  39. D. Li, X. Liu and H. Zhou, Energy Technol., 2014, 2, 542–574 CrossRef CAS.
  40. C. Delmas, M. Maccario, L. Croguennec, F. L. Cras and F. Weill, Nat. Mater., 2008, 7, 665–671 CrossRef CAS PubMed.

Footnotes

Electronic supplementary information (ESI) available: Schematic illustration, size distribution, SEM images, XRD pattern, and impedance parameters of the LiFePO4 electrodes. See DOI: 10.1039/c6ra24514e
These authors equally contributed to this work.

This journal is © The Royal Society of Chemistry 2016
Click here to see how this site uses Cookies. View our privacy policy here.