
Enhanced corrosion protection and biocompatibility of a PLGA–silane coating on AZ31 Mg alloy for orthopaedic applications†
Sankalp Agarwal ab,
Muhammad Morsheda,
Marie-Noelle Labourcd,
David Hoeycde,
Brendan Duffya,
James Curtinb and
Swarna Jaiswal*a
ab,
Muhammad Morsheda,
Marie-Noelle Labourcd,
David Hoeycde,
Brendan Duffya,
James Curtinb and
Swarna Jaiswal*a
aCentre for Research in Engineering and Surface Technology, FOCAS Institute, Dublin Institute of Technology, Kevin Street, Dublin 8, Ireland. E-mail: swarna.jaiswal@dit.ie
bSchool of Food Science and Environmental Health, Dublin Institute of Technology, Cathal Brugha Street, Dublin 1, Ireland
cTrinity Centre for Bioengineering, Trinity Biomedical Sciences Institute, Trinity College Dublin, Dublin 2, Ireland
dDepartment of Mechanical and Manufacturing Engineering, School of Engineering, Trinity College Dublin, Dublin 2, Ireland
eAdvanced Materials and Bioengineering Research Centre, Royal College of Surgeons in Ireland, Trinity College Dublin, Dublin 2, Ireland
First published on 28th November 2016
Abstract
This paper reports a multi-step procedure to fabricate a novel corrosion resistant and biocompatible PLGA–silane coating on the magnesium (Mg) alloy AZ31. The first step involves alkaline passivation followed by dip coating in a methyltriethoxysilane (MTES) and tetraethoxysilane (TEOS) mixture to produce a cross-linked siloxane coating. The second step is to impart an amine functionalization to the silane modified surface by using 3-aminopropyl-triethoxy silane (APTES) for promoting adhesion of the acid terminated poly-(lactic-co-glycolic) acid (PLGA) as a final coating step. Static contact angle measurements, Fourier transform infrared spectroscopy and scanning electron microscopy analysis confirmed the successful assembly of coatings on the AZ31 Mg alloy. Potentiodynamic polarization and impedance spectroscopy studies showed the improved initial corrosion resistance of the coated AZ31 substrate. Measurements of magnesium ion release, pH changes and hydrogen evolution showed enhanced corrosion protection of coated substrate over uncoated AZ31 alloy for 21 and 14 days respectively. The MTT assay, live–dead cells staining, DNA quantification and alkaline phosphatase activity assay were used to measure the biocompatibility, proliferation and differentiation of MC3T3-E1 osteoblast cells. Scanning electron microscopy was used to observe cell morphology and integration with the coated surface. The coated substrate showed improved cytocompatibility as compared to the uncoated AZ31 alloy surface. The application of such coatings on biodegradable Mg alloys enhanced their corrosion resistance and biocompatibility. An additional advantage is that the coating also served as a potential delivery vehicle for specific drugs and bio-active molecules releasing from an implant surface as the coatings, such as PLGA, adapt during the corrosion process, thereby enhancing bone regeneration.
1 Introduction
Conventional metals such as 316L stainless steel, titanium and cobalt–chromium based medical grade inert alloys are used as permanent implants in order to immobilize and restore damaged bone.1 Over the past decade, there has been increasing interest to replace these permanent alloys with biodegradable magnesium (Mg) and its alloys which not only degrades under in vivo conditions, but also exhibits low toxicity and similar mechanical properties to natural bone.2 Research to date has shown that Mg and its alloys can be potentially used for orthopaedic fracture fixation such as in fixation plates, rods and screws. Such temporary implants can remain for the appropriate time to support the bone fracture recovery before degrading and being absorbed by the body. Biodegradable metallic implants reduce the complications associated with permanent implants such as a potential inflammatory response, physical irritation and implant removal surgery.3 However, the potential clinical applications of Mg based alloys have been delayed due to their rapid electrochemical dissolution under physiological conditions, resulting in the elevated release of hydrogen gas and pH changes, which create a bio-incompatible environment to the surrounding tissue.3 In addition, the rapid degradation can lead to the early loss of mechanical stability of Mg based implants, thereby structural failure before the healing process has progressed sufficiently.2 Therefore, it is important to have controlled degradation in tandem with improved biocompatibility of Mg alloys for orthopaedic implant.Several strategies have been employed to improve the corrosion resistance and biocompatibility of Mg alloys such as alloying elements, passivation and surface coatings.4 Variation of the alloying elements may improve the original mechanical properties and enhance the corrosion resistance, but are not likely to improve the biocompatibility of Mg alloys because it may induce cytotoxicity depending on the locally released concentration or systemic accumulation of alloying elements.4 Apart from alloying, surface modifications or passivation of Mg alloys such as alkaline hydrothermal treatment, micro-arc oxidation (MAO) and ion implantation have been investigated to improve the corrosion resistance.2 However, these surface modifications alter the mechanical properties and are unable to protect the Mg alloys over a long time in the corrosive environment.5,6 Therefore, surface coatings are now being investigated as an effective approach with the potential to improve the corrosion resistance and biocompatibility of Mg alloys.
Silane and biodegradable aliphatic polyester have been used widely to achieve protective biocompatible coatings.7,8 Organosilanes have been used as a corrosion resistant coating for Mg alloys due to their good adhesive property to the metal surface, chemically modifiable and generates hydrophobic network. It has been demonstrated that organosilane coatings obtained from methyltriethoxysilane–tetraethoxysilane (MTES–TEOS) precursor are hydrophobic and crack free, thereby improved the corrosion behaviour of Mg alloys in the physiological environment.9 In addition, to improve the corrosion resistance of Mg alloys, the biocompatibility of the coatings plays an important role to stimulate the osseo-integration and bone growth. Recently, organofunctional silane aminopropyl-triethoxy silane (APTES) have been extensively used to immobilise the variety of biocompatible materials into coatings, which also improve the corrosion resistance.10,11 Amongst several aliphatic polyesters, poly(lactide-co-glycolide) (PLGA) coatings are FDA-approved for use on implants. The polymer displays good biocompatibility and widely used as a delivery vehicle for bioactive molecules as its by-products are metabolically digestible and provide corrosion resistance.12 Liu et al., showed an improved biocompatibility and corrosion resistance of Mg–Zn–Y–Nd alloy by introducing a crosslinked APTES silane barrier functionalized with rapamycin loaded PLGA.10 However, it is reported that the amino group of amine-functional silanes preferentially interacts with metal surface, which introduces defects in the coating, thus allowing water in the silane/metal interface.13,14 Therefore, integration of organosilanes and PLGA into a multilayer coating could be used to develop multifunctional corrosion resistant-biocompatible coating on Mg based alloys for orthopaedic applications.
In this study, we developed a multi-layer PLGA–APTES–(MTES–TEOS) coating to produce a biocompatible and corrosion resistant surface on AZ31 Mg alloy for orthopaedic applications (Fig. 1). The corrosion behaviour of PLGA–organosilane coatings on AZ31 alloy was evaluated. The multi-layer organosilane and PLGA coating enhances the corrosion resistance due to the formation of Si–O–Si bonds and PLGA as a physical barrier which together prevents electrolyte penetration to the AZ31 Mg alloy. Furthermore, improved biocompatibility of the coated substrate over uncoated AZ31 has been observed with the murine osteoblast cells.
 | ||
| Fig. 1 Schematic representation showing the steps involved in PLGA–silane coating on AZ31 mg alloy. The alkaline passivated AZ31 alloy (step-a) was coated sequentially with MTES–TEOS (step-b), APTES (step-c) and PLGA (step-d) to improve the corrosion resistance and biocompatibility of AZ31 mg alloy. | ||
2 Experimental
2.1 Materials
AZ31 alloy (Table 1) sheets were obtained from Shaanxi Taipu Rare Metal Materials Ltd, China. Methyltriethoxysilane (MTES) and tetraethoxysilane (TEOS), 3-aminopropyl-triethoxy silane (APTES), poly-(lactic-co-glycolic) acid (PLGA), mol wt 30![[thin space (1/6-em)]](https://www.rsc.org/images/entities/char_2009.gif) 000–60000, phosphate buffer saline (PBS), Dulbecco's Modified Eagle's Medium (DMEM), fetal bovine serum (FBS), penicillin–streptomycin antibiotics, 1-(4,5-dimethylthiazol-2-yl)-3,5-diphenylformazan (MTT), and dimethyl sulfoxide (DMSO) were purchased from Sigma Aldrich. Milli-Q water was used to prepare solutions.
000–60000, phosphate buffer saline (PBS), Dulbecco's Modified Eagle's Medium (DMEM), fetal bovine serum (FBS), penicillin–streptomycin antibiotics, 1-(4,5-dimethylthiazol-2-yl)-3,5-diphenylformazan (MTT), and dimethyl sulfoxide (DMSO) were purchased from Sigma Aldrich. Milli-Q water was used to prepare solutions.
| Elements | Weight (%) |
|---|---|
| Mg | 96.37 |
| Al | 2.45 |
| Si | 0.1 |
| Ca | 0.03 |
| Mn | 0.22 |
| Fe | 0.05 |
| Cu | 0.05 |
| Zn | 0.74 |
2.2 Surface modifications of AZ31 Mg alloy
2.3 Characterisation of AZ31 modified samples
All modified (AZ31-OH, AZ31-MT, AZ31-MT-A and AZ31-MT-A-P) and uncoated AZ31 substrates were investigated using attenuated total reflection-infrared spectroscopy (ATR-IR). The IR spectra were recorded over a scan range of 4000 cm−1 to 600 cm−1. The wettability of samples was determined by static water contact angle measurements (FTÅ-200 system) by using sessile drop method (2 μl, Milli-Q water).16 The surface morphology of coatings was studied by scanning electron microscope (Hitachi SU-70 FESEM with EDX and WDX) operating at 5.0 kV. The chemical compositions of coatings were studied using energy-dispersive X-ray spectroscopy (EDS, Oxford Instruments). To determine the thickness of AZ31-MT-A-P coatings by SEM, samples were embedded in an epoxy resin which was cured, progressively ground (80–1200 grit) and finally polished (9, 6 μm) to a smooth surface. Before SEM and EDX analysis, all samples were coated with Au–Pd sputter coating system (Cressington 208HR Sputter Coater).The evolution of hydrogen gas was monitored by placing the samples in DMEM at 37 ± 0.5 °C under an inverted funnel connected to graduated burette and measuring the medium level up to 14 days. The ratio of surface area-to-the volume of DMEM was kept constant at 10 cm2 l−1.18,19
2.4 Cytocompatibility
294g for 10 minutes and supernatant was filtered through 0.22 μm filter (Millipore, Merck). All extracts were stored at 4 °C for further use.The murine pre-osteoblast cell line (MC3T3-E1) (ATCC® CRL-2593™, LGC standard) was utilized for in vitro cytotoxicity experiments. Cells were cultured under 37 °C, 5% CO2 and 95% relative humidity in DMEM containing 10% fetal bovine serum and 1% penicillin and streptomycin. Cells were seeded in 96 well-plates with the cell density of 104 cells per ml and incubated for 24 h. After 24 h, the culture medium was replaced with extracted medium of different dilutions (50%, 25% and 10%) added with 10% FBS, 1% penicillin and streptomycin (P/S) and incubated for 1, 3 and 5 days. The culture medium with 10% DMSO and without extracted medium was considered as positive and negative controls respectively. After the incubation, the extracted medium was replaced with fresh culture medium containing MTT dye (100 μl serum free medium with 25 μl of 5 mg ml−1 MTT dissolved in PBS) for 4 h to prevent the interference of magnesium ions with the tetrazolium salt.20 The culture medium with MTT was discarded after the incubation and 100 μl of DMSO was added into each well to dissolve the formazan crystal. The absorbance of the samples was recorded using the Synergy multi-mode micro-plate reader at a wavelength of 570 nm. To determine the percentage cell viability, the following equation was used:
| Percentage cell viability (%) = absorbance(sample)/absorbance(negative control) × 100 |
:500 ratios in DMEM containing 10% FBS and 1% P/S. Cells cultured on the experimental substrates were washed with PBS and incubated in a fluorescent dye for 20 minutes at 37 °C. After incubation, the cells were rinsed with PBS and imaged using an Olympus IX83 epifluorescence microscope fitted with a 10× objective lens. For each substrate, images were taken from two to four sites to determine cell adhesion.3 Results and discussion
3.1 Characterisation of surface modified AZ31 Mg alloy
The ATR-IR spectrum of the surface modified AZ31 Mg alloys are shown in Fig. 2. To facilitate the organosilane coating, the AZ31 Mg alloy was passivated with sodium hydroxide to generate hydroxide layer (AZ31-OH) on the surface which is indicated by band at 3694 cm−1.15 The MTES–TEOS coating on the passivated was evident by IR bands around 1045–1127 cm−1 and 1270 cm−1, corresponding to Si–O asymmetric stretching of Si–O–Si bond13 and absorption vibration of Si–CH3 of MTES respectively.9 Subsequent coating with APTES increases the intensity of siloxane band with an appearance of a new band at 1570 cm−1, which is assigned to vibrational mode of amine group.13 The bands at 3295 cm−1 and 3368 cm−1 are related to the asymmetric and symmetric stretching modes of NH2 group respectively.21 Broadening of the band at 1570 cm−1 was observed when the amine functionalised silane substrate was coated with PLGA and most of the amine peaks became obscured, indicating the presence of an electrostatic interaction occurred.22,23 The presence of the Si–CH3 band (1270 cm−1) in all coated substrates indicates the presence of methyl groups which imparts some hydrophobicity to the coating.24,25 | ||
| Fig. 2 ATR-IR of uncoated and AZ31 modified substrates. | ||
The effect of the surface modifications was observed by the surface wettability of AZ31 modified substrates, as characterized by static water contact angle measurement showed in Fig. 3. The bare AZ31 surface presents with a water contact angle of 74.6 ± 0.9°. The treatment with NaOH increases the surface hydrophilicity of bare AZ31 due to the presence of a hydroxyl layer with a water contact angle of 29.1 ± 1.8°. As expected, the MTES–TEOS coating increases the surface hydrophobicity due to the presence of the methyl groups and siloxane bond with a water contact angle of 77.9 ± 1.3°.9,13 Subsequent coating with APTES (AZ31-MT-A) decreases the contact angle to 46.4 ± 2.1° which is attributed to the presence of amine group on the surface.16 Further modification with PLGA re-establishes the relative hydrophobicity with an increase in water contact angle to 68.2 ± 1.5°. It can be observed that the surfaces are significantly different (p < 0.01) at each stage of the functionalization. These results along with ATR-IR analysis confirm the sequential functionalization of the AZ31 alloy coating.
 | ||
| Fig. 3 Contact angle measurements of uncoated and AZ31 modified surfaces. One way ANOVA with post hoc Tukey test with significance level of **p < 0.01. | ||
The surface morphology and coating thickness of modified AZ31 substrates were observed by SEM. Fig. 4, shows the images of uncoated and coated substrates (a) AZ31 (polished), (b) AZ31-MT, (c) AZ31-MT-A, (d) AZ31-MT-A-P and (e) cross-section of AZ31-MT-A-P. The coated substrates (Fig. 4(b)–(d)) showed homogenous and crack free surface. In addition, delamination of coatings has not been observed in AZ31 coated surface. Fig. 4(e) shows the cross-section of AZ31-MT-A-P substrate with the coating thickness of 1.61 μm. There was no significant difference was observed in AZ31-OH with respect to polished AZ31 (SEM image is not shown). Therefore, the combined results of ATR-IR, contact angle measurement and SEM analysis confirm the successful assembly of PLGA–silane coating on the surface of AZ31 substrates.
 | ||
| Fig. 4 SEM images of (a) AZ31, (b) AZ31-MT, (c) AZ31-MT-A, (d) AZ31-MT-A-P and (e) cross section of AZ31-Mt-A-P. | ||
3.2 In vitro corrosion and degradation behaviour of AZ31 substrates
 | ||
| Fig. 5 Potentiodynamic polarization curves of AZ31 alone, AZ3-OH, AZ31-MT, AZ31-MT-A and AZ31-MT-A-P surfaces. | ||
| Substrates | Ecorr (VSCE) | icorr (A cm−2) |
|---|---|---|
| AZ31 | −1.679 ± 0.021 | 17.9 ± 0.128 |
| AZ31-OH | −1.652 ± 0.008 | 15 ± 0.056 |
| AZ31-MT | −1.677 ± 0.003 | 0.987 ± 0.039 |
| AZ31-MT-A | −1.612 ± 0.009 | 0.26 ± 0.049 |
| AZ31-MT-A-PLGA-2% | −1.561 ± 0.002 | 0.214 ± 0.047 |
The EIS measurements are used to study the corrosion behaviour of uncoated and coated AZ31 substrates as represented in Bode plot in Fig. 6(a). Fig. 6(a) clearly shows that the magnitude of impedance at lowest frequency (|Z|0.01 Hz) gradually increases, while phase Bode plot displays increase in the broad crest wave toward −90° with every step of coating, suggesting an improvement in corrosion resistance of AZ31 Mg alloy. Such features have been observed in corrosion resistant coating on Mg alloys.9,27,28 The |Z|0.01 Hz value of passivated AZ31-OH substrate is ∼7.4 × 10³ Ω cm2, which is slightly higher than the AZ3 (∼4.8 × 10³ Ω cm2) alone. With further modification, a progressive increase in |Z|0.01 Hz value of ∼2.2 × 10⁵ Ω cm2 for AZ31-MT to ∼5.8 × 10⁵ Ω cm2 and ∼1.44 × 10⁶ Ω cm2 for AZ31-MT-A and AZ31-MT-A-P have been observed respectively.
 | ||
| Fig. 6 (a) Bode plots for AZ31 alone, AZ3-OH, AZ31-MT, AZ31-MT-A and AZ31-MT-A-P surfaces, equivalent circuits used to fit experimental data (b) coated and (c) uncoated AZ31 and AZ31-OH substrates. | ||
In addition, phase angle Bode plots for all coated samples were characterised with two time constants. One time constant at high frequencies referring to capacitive response or barrier part of the organo-silane (MT and MTA) and PLGA (MT-A-P) coatings, and the second time constant at low frequencies assigned to the diffusion process of electrolyte in the coatings. The AZ31 and AZ31-OH substrates are characterised by two capacitive responses at higher and medium frequencies (suppressed response) with additional inductance at very low frequency (<0.1 Hz). This low frequency inductance is commonly observed in uncoated Mg alloys, indicating the presence of surface adsorbed species like Mg(OH)+ and Mg(OH)2.27,29–31
The EIS spectra of coated and uncoated substrates were analysed based on the electrical equivalent circuits which fit best with the experimental data, composed of two time constants respectively as shown in Fig. 6(b) and (c). The equivalent circuit consists of Rs (solution resistance), constant phase element (CPE) components, CPEcoat (Qcoat) one of the, expresses coating capacitance and Rcoat is the resistance of the coating. CPEcoat (Qdl), another component of the CPE, represents the capacitance of electrical double layer at vulnerable region and a charge transfer resistance Rct. For AZ31 and AZ31-OH substrates, CPE and resistances are related to the hydroxide film on the surface. The RL and L represent the inductive resistance and inductance respectively, for AZ31 and AZ31-OH substrate. However, data of these two components have not been shown as CPEcoat, Rcoat, CPEdl and Rct are the elements of interest which are comparable to corresponding coated substrates. The low frequency inductance has not been observed in any of the coated surface. The equivalent circuits were selected based on the literature available for corrosion of uncoated and coated Mg alloys.31–33 The fitting parameters are given in Table 3.
| AZ31 substrates | AZ31 | AZ31-OH | AZ31-MT | AZ31-MT-A | AZ31-MT-A-P |
|---|---|---|---|---|---|
| Rs (Ω cm2) | 150.1 | 349 | 250.1 | 398 | 1251 |
| CPEcoat-T (×10−8 F cm−2) | 1280.2 | 386.6 | 3.0741 | 2.8447 | 1.34 |
| CPEcoat-P | 0.63659 | 0.7259 | 0.77427 | 0.78549 | 0.83357 |
| Rcoat (×105 Ω cm2) | 0.05679 | 0.07555 | 1.4694 | 3.9657 | 9.7297 |
| CPEdl-T (×10−6 F cm−2) | 290.02 | 55.858 | 4.4765 | 1.1012 | 0.30164 |
| CPEdl-P | 0.94597 | 0.97 | 0.65008 | 0.83252 | 0.9728 |
| Rct (Ω cm2) | 768.5 | 1371 | 82394 |
2.4533 × 10⁵ | 5.6467 × 10⁸ |
It is observed that the Rcoat and Rct for coated substrates gradually increase with every layer of coating on the AZ31 Mg alloy. Rct which is a measure of corrosion resistance of alloy samples coated with a silane or PLGA–silane, suggesting a substantial increase of corrosion resistance in case of AZ31-MT-A-P coated substrate (5.6467 × 10⁸ Ω cm2) than AZ31 alloy (5679 Ω cm2). Once exposed to the electrolyte, a thin film of Mg(OH)2 can be developed on the AZ31 Mg alloy. This could acts as an initial passivation layer, but it may not withstand with electrolytic attack, especially chloride ions.23 Though, alkaline passivated AZ31-OH showed enhanced corrosion resistance as compared to AZ31 alloy (Table 3), but it also susceptible to the degradation in corrosive medium.23 Therefore, the alkaline passivated surface has been widely used to facilitate the bonding of silane coating on the surface.10,34,35 The CPEcoat and CPEdl are related to the area of the capacitor. The relatively low values of capacitance have been observed in the case of AZ31-MT-A-P as compared to the AZ31 bare alloy as well as those for other coated substrates, implying that the active area of corrosion with PLGA–silane coating is considerably decreased. As established from potentiodynamic polarization and EIS tests in DMEM, the PLGA–silane coating showed superior corrosion resistance compared to all other surface modifications.
Consulting to other published literature, bilayer PLGA–APTES treated MgZnYNd alloy and γ-APS-BTSE treated AZ31 alloy showed lower corrosion resistance than the present model of AZ31-MT-A-P.10,16 This enhanced corrosion resistance offered by silane and PLGA coatings could be attributed to the defect free coatings and combined physical barrier performance of the siloxane network of MT-A and PLGA coating to electrolyte penetration,12,13 which is in agreement with the SEM images, FTIR spectrum, low capacitance values. This results in the slowdown of anodic dissolution reaction (Mg → Mg2+ + 2e−) and charge transfer associated with cathodic reactions (2H2O + 2e− → H2 + 2OH−), which blocks the mass transport of Mg2+ ions and release H2 gas,16 as observed from lower icorr values and anodic shift of Ecorr. Moreover, the corrosive medium used by previous electrochemical studies were less corrosive Hanks' buffer and stimulated body fluid (SBF) than the DMEM. According to previous reports, these electrochemical corrosion studies for Mg based alloys should be complement by the other measurements such as Mg2+ ion release rate and hydrogen gas evolution rate (in vitro degradation studies).18,30,36 Since, the AZ31-MT-A-P coated substrate presents the greatest corrosion resistance, hereafter, further long term degradation and biocompatibilities studies have been performed with AZ31-MT-A-P substrate with the uncoated AZ31 (i.e. without any modification) as a control.
 | ||
| Fig. 7 (a) ICP-OES measurement of Mg ions release, (b) pH change and (c) rate of H2 gas release from AZ31 and AZ31-MT-A-P over a period of 21 and 14 days respectively. | ||
Furthermore, the bulk pH change of AZ31-MT-A-P and uncoated AZ31 in DMEM over a period 21 days is shown in Fig. 7(b). It can be seen that the pH of DMEM for both the substrates are alkaline, but the coated AZ31-MT-A-P was less alkaline when compared to uncoated AZ31 alloy. The coated substrate showed gradual increases until day 9 (pH 8.22) then stabilises in the remaining immersion time (pH 8.32). On the other hand, the uncoated alloy which showed sudden increase in pH until day 9 (pH 9.2) and then decreases at later period (pH 8.8). The trend of Mg2+ release from coated substrate was consistent with the observed pH change.
The rate of hydrogen gas evolution from AZ31 and AZ31-MT-A-P in DMEM has been performed for 14 days as shown in Fig. 7(c). The results indicated that the rate of H2 gas evolution is much higher for uncoated AZ31 than coated AZ31-MT-A-P substrate. The uncoated AZ31 alloy showed a characteristically high corrosion rate until day 7 with 0.084 ± 0.004 ml h−1 cm−2 of H2 gas release, followed by a slower corrosion rate throughout the remaining period with 0.041 ± 0.003 ml h−1 cm−2 of H2 gas release for day 14. For coated AZ31-MT-A-P substrate, a slow, steady ever with decreasing release of H2 gas was observed throughout the period of 14 days dropping from 0.015 ± 0.007 ml h−1 cm−2 to 0.008 ± 0.001 ml h−1 cm−2. The average rate of H2 gas release over a period 14 days for the coated surface (0.011 ml h−1 cm−2) is much lower when compared to uncoated surface (0.062 ml h−1 cm−2). Therefore, the trend in hydrogen gas release for the coated surface was very much in agreement with Mg2+ ion release rate, indicating that coating enhanced the corrosion resistance of AZ31 Mg alloy.
Furthermore, the stability of coating was evaluated by SEM and EDX analysis of AZ31-MT-A-P substrates for various elements at different times as shown in Fig. 8(a–c). The SEM images showed that with increase in immersion time from day 7 to 21, the crack formation in coating also increases. The spot EDX analysis and elemental mapping of silicon (Si), phosphorus (P) and calcium (Ca) of the coated substrate were performed to assess the corrosion products formed on the sample and the presence of coating component (Si). The spot EDX elemental analysis around the cracks of the coated surface, as shown within the table in Fig. 8, are rich in Ca, P, Mg and O. Here, a higher content of Ca–P deposition with low Si content near the cracks was observed with the immersion time of day 7, 14 and 21. The EDX elemental mapping of day 7, 14 and 21 indicated the presence of Si, P and Ca. From the EDX maps, a weak signal of Si element has been observed near the cracks (as shown by arrows), whereas at the same site strong signal of P (indicated by arrows) can be observed on day 14 and 21. The spot EDX analysis and elemental mapping indicate the degradation of coating and the formation of protective layer, as observed from weak Si signal (component of silane coating) and Ca–P deposition respectively. Furthermore, the degradation of PLGA coating was determined by IR analysis of –C![[double bond, length as m-dash]](https://www.rsc.org/images/entities/char_e001.gif) O band at 1760 cm−1 (ESI: 2†). On day 21, the –CO band was not detectable, indicating the hydrolysis of the PLGA coating. Previous reports showed that PLGA is susceptible to hydrolytic degradation, thereby failing to offer long term corrosion resistance alone.12,26
O band at 1760 cm−1 (ESI: 2†). On day 21, the –CO band was not detectable, indicating the hydrolysis of the PLGA coating. Previous reports showed that PLGA is susceptible to hydrolytic degradation, thereby failing to offer long term corrosion resistance alone.12,26
 | ||
| Fig. 8 Surface morphology and EDX mapping of AZ31-MT-A-P immersed in DMEM for days (a) 7, (b) 14 and (c) 21 respectively. EDX was performed near cracks as denoted by arrows (scale bar is 50 μm). | ||
The possible reasons for the increased development of cracks in the coated AZ31 substrate with the immersion time, are due to the electrolyte (DMEM) penetration into the coating and subsequent corrosion of underlying alkaline treated Mg alloy with the dissolution of Mg2+ ions which react with water to form Mg(OH)2 and H2 gas.2 The overall reactions ((Mg + 2H2O → H2 + Mg(OH)2) include anodic and cathodic reactions (see 3.2.1).6 It is well known that the hydroxide layer on the AZ31 does not provide long term corrosion resistance.15 The surface layer of Mg alloy would become unstable due to the release of hydrogen gas, which not only corrodes the underlying surface, but also increases the electrolyte permeability of the coating, thereby initiating the crack formation. This leads to the degradation of surface coating as observed from weak Si signals (EDX analysis), which is a component of organosilane coating and disappearance of PLGA IR band, indicating the degradation of the PLGA–organosilane coating over time. During corrosion of Mg alloy, the OH− ions release from the surface which increases the bulk pH of the medium.37 However, the localised pH depends upon the balance between the Mg alloy degradation rate with the formations of OH− ions and the rate of removal of these ions by convection and diffusion.38
According to Dezfuli et al., the bulk electrolyte pH remains relatively less alkaline as compared to the localised pH.39 Moreover, it is expected that the localised pH near the cracks will be relatively more alkaline. This results in the higher build-up of protective or corrosion layer arising from Mg(OH)2 and Ca–P deposition at the site of cracks over time, as observed from the increased deposition of the corresponding elements recorded by SEM-EDX elemental analysis of coated substrate (indicating by arrows in Fig. 8(a–c) and inset table). This prevents the further chemical reaction across the metal surface and reduces the corrosion rate of Mg alloy,40 which is also evident by the reduced rate of magnesium ions release, H2 gas evolution and pH change with increase in immersion time for both coated and uncoated surfaces (Fig. 7). Previous reports also showed that degradation layer during the corrosion process which consists of calcium phosphate precipitates and other corrosion products reduced the degradation rate of the Mg based alloy in vitro with time.40,41 Since, the organosilane coating on the AZ31 Mg alloy has not been completely degraded or delaminated; this controlled degradation of coated AZ31 substrate could be attributed to the stability of coating as well as in situ formation of such protective layers.
3.3 Cytocompatibility
The indirect cytotoxicity of uncoated and coated AZ31 alloy was performed for different duration (day 1, 3 and 5) by using MTT assay as shown in Fig. 9. A non-linear regression analysis of cell viability to neat or diluted extracts of coated and uncoated substrates was plotted. | ||
| Fig. 9 Cell viability of MC3T3E1 osteoblast in the extracts of AZ31 and AZ31-MT-A-P substrates over a 5 days incubation period. Arrows indicating the % extracts (v/v) which corresponds to its logarithmic values on x-axis. | ||
The cell viability results for the coated AZ31-MT-A-P substrate using 100% of the extract (Mg2+ ions concentration is 17.69 ± 0.12 mM, pH 8.03 ± 0.04) is significantly higher than the uncoated AZ31 alloy (Mg2+ ion concentration is 58.01 ± 0.26 mM, pH 8.76 ± 0.09) and with further dilution of extracts. It was observed that the cell viability is markedly higher for all days with 100% extract of coated AZ31 substrate as compared uncoated AZ31 alloy. In addition, no reduction in cell viability was observed with the diluted extracts from 25% to 10% of coated substrate for all days. On the contrary, the uncoated AZ31 alloy extracts showed higher cytotoxicity with the all extracts. Mg based biomaterial is not only biodegradable but also bioresorbable, as it is an essential mineral and mostly stored in bone, in an apatite inorganic matrix.42 Moreover, it also stimulates bone growth and healing.42 It is known that cells viability are very sensitive to environmental fluctuation, especially changes in pH due to the rapid degradation of bare AZ31 alloy.2,43 In case of uncoated AZ31 surface, osteoblasts exposed to the extraction medium showed cell cytotoxicity in all samples due to the rapid degradation, whereas extraction medium of coated AZ31 alloy substrate stimulates the proliferation or retain the viability of osteoblast cells. This suggested that the coated AZ31 substrates not only controlled the degradation of Mg alloys but also allows to exploit their bioresorbable properties.
Fig. 10 shows the pre-osteoblasts directly cultured on uncoated AZ31, coated AZ31-MT-A-P substrates for 1, 3 and 5 days, and then stained with calcein AM and propidium iodide. From day 1 to 5, coated substrate (Fig. 10(d–f)) demonstrated a marked increase in live cell density (green fluorescence) when compared to uncoated AZ31 alloy (a–c), indicating that cells are proliferating faster. Very few dead cells (red fluorescence) were observed on the coated surface over uncoated AZ31 alloy, indicating the enhanced biocompatibility of the AZ31-MT-A-P surface.
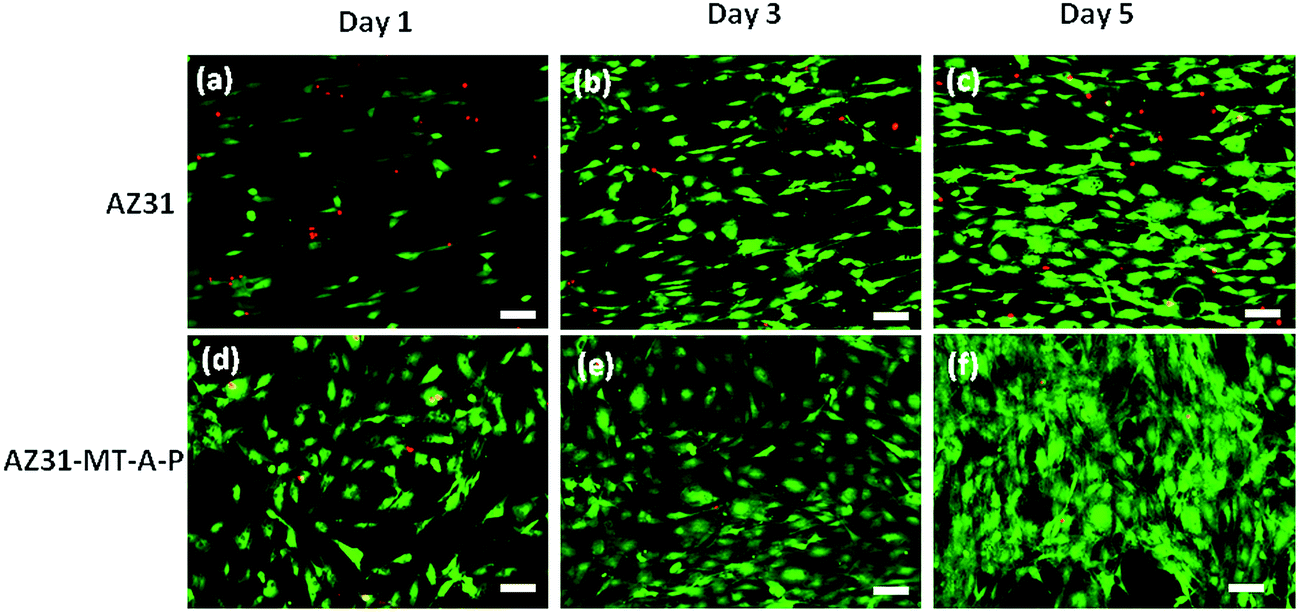 | ||
| Fig. 10 Fluorescence microscopic images of live–dead MC3T3E1 cells attached on AZ31 (a–c) and AZ31-MT-A-P (d–f) for day 1, 3 and 5 respectively (scale bar is 100 μm). | ||
SEM images of the fixed osteoblast cells on uncoated AZ31 alloy and coated surface at day 1, 3 and 5 post seeding are shown in Fig. 11(a–f). The cells grown on the AZ31 alloy surface on day 1 (Fig. 11(a)) have attached (indicated by red arrows) while dead or distorted shaped (yellow arrows) osteoblast cells were also observed. This observation is similar to live/dead staining of AZ31 on day 1. With an increased duration of culture exposure, greater localised attachment of osteoblast cells can be observed on AZ31 surface (Fig. 11b and c). In contrast, the attachment of osteoblast cells is delocalised on the AZ31-MT-A-P substrate following as with increase in the incubation period from day 1 to 5 (Fig. 11(d–f)). A distinct morphology of osteoblast cells cannot be observed on day 5 (Fig. 11(f)), because of the dense coverage of confluent osteoblast cells which intercalate with each other. These results indicate that the PLGA component of the coated surface facilitates the greater cells adhesion and proliferation of osteoblast cells, thereby enhancing the biocompatibility of coating. Several reports have shown that the application of PLGA as a biocompatible coating on Mg based alloy which enables the osteoblast cell attachment and proliferation.12,26 Hence, it can be concluded that the coated AZ31-MT-A-P substrate is more biocompatible the uncoated AZ31 alloy.
 | ||
| Fig. 11 SEM morphology of fixed MC3T3E1 osteoblast cells on AZ31 (a–c) and AZ31-MT-A-P (d–f) alloy after incubation of day 1, 3 and 5 (red and yellow arrows indicating attached cells and dead or distorted shaped osteoblast cells respectively). | ||
The DNA content of osteoblast cells cultured on the uncoated AZ31 and AZ31-MT-A-P substrates for day 3, 7 and 14 was measured by fluorescence assay as shown in Fig. 12(a). The concentration of DNA is the direct measure of cells that attach and proliferate on a substrate surface. The low DNA concentration on day 3 on uncoated AZ31 surface suggests that many of seeded cells did not attach. This was expected due to the rapid corrosion and release of hydrogen gas upon the contact with the cell culture medium prior to passivation. The intial cell attachment on the coated AZ31-MT-A-P substrate was nearly 4 fold higher than the uncoated AZ31 equivalent. The cells were found to attach and proliferate on both the substrates between day 7 and 14, resulting an increase in DNA concentration. However, the concentration of DNA for the coated surface was significantly higher (p < 0.01) when compared to the uncoated AZ31 surface over a period of 14 days. The increase in DNA concentration for the uncoated AZ31 surface is likely due to the formation of a passivation layer, which slows down the corrosion rate of Mg alloy with the incubation time, thereby supporting the growth of cells.40,44 This DNA quantification study is consistent with cell viability assay and live/dead staining qualitative results which indicate that the cell viability and proliferation are higher on the coated surface when compared to the uncoated AZ31 surface.
 | ||
| Fig. 12 (a) Quantification of total DNA content and (b) ALP activity of osteoblast cultured on uncoated AZ31 and coated AZ31-MT-A-P substrates for 3, 7 and 14 days. One way ANOVA with post hoc Tukey test with significance level of **p < 0.01. | ||
Osteoblasts expresses ALP in the early stages of osteoblastic commitment and is actively involved in the mineralisation of the extracellular matrix through generation of phosphate ions from the hydrolysis of organic substrates.45 The differentiation of osteoblast cells on the coated and uncoated AZ31-MT-A-P substrate was evaluated upto 14 days using ALP as an early stage marker. The ALP activity of osteoblast cells cultured on the uncoated AZ31 and coated AZ31-MT-A-P substrates are presented in Fig. 12(b). The osteoblasts that adhered to the coated surface showed significant higher ALP expression (p < 0.01) as compared to the uncoated AZ31 alloy over a culture duration of 14 days. The enhanced proliferation of cells is the likely reason of greater cell differentiation on coated AZ31-MT-A-P surface.15,45 Hence, the multilayer PLGA–silane coating is promising way to improve the osteointegration of Mg based implants.
4 Conclusions
A novel multi-layered PLGA–silane coating on the biodegradable Mg alloy has been developed. The corrosion resistance of AZ31 alloy was considerably improved with every step of coating. The AZ31-MT-A-P coated substrate showed enhanced and long-term corrosion resistance over uncoated AZ31 alloy, while keeping the conditions necessary for biocompatibility. The stability of coatings as well as in situ formation of protective layer played an important role in the controlled degradation of coated AZ31 alloy. The coated AZ31 Mg alloy showed good osteoblastic cytocompatibility, allowing cell adhesion, proliferation and differentiation when compared to the uncoated equivalent. The cytocompatibility results indicate that the PLGA coating facilitates better cell adhesion and proliferation, thereby enhancing the biocompatibility of the coating. These results indicate that the proposed coating for Mg alloys is a promising strategy to not only improve the corrosion resistance and cellular integration with the surrounding tissues but also potentially serve to deliver desired drugs, growth factors and other bio-active molecules at the site of implantation during coating degradation process (such as PLGA), expediting the bone healing process.Acknowledgements
The authors would like to thank Dublin Institute of Technology for the financial support through Fiosraigh Scholarship Programme (2014). This study was also supported by a European Research Council (ERC) Starting Grant (#336882) and a Science Foundation Ireland ERC Support Grant SFI 13/ERC/L2864.References
- F. Witte, N. Hort, C. Vogt, S. Cohen, K. U. Kainer, R. Willumeit and F. Feyerabend, Curr. Opin. Solid State Mater. Sci., 2008, 12, 63–72 CrossRef CAS.
- S. Agarwal, J. Curtin, B. Duffy and S. Jaiswal, Mater. Sci. Eng., C, 2016, 68, 948–963 CrossRef CAS PubMed.
- G. Song and S. Song, Adv. Eng. Mater., 2007, 9, 298–302 CrossRef CAS.
- G. E. J. Poinern, S. Brundavanam and D. Fawcett, Am. J. Biomed. Eng., 2012, 2, 218–240 CrossRef.
- A. Němcová, P. Skeldon, G. Thompson, S. Morse, J. Čížek and B. Pacal, Corros. Sci., 2014, 82, 58–66 CrossRef.
- Y. Zheng, X. Gu and F. Witte, Mater. Sci. Eng., R, 2014, 77, 1–34 CrossRef.
- H. Hornberger, S. Virtanen and A. Boccaccini, Acta Biomater., 2012, 8, 2442–2455 CrossRef CAS PubMed.
- R. G. Hu, S. Zhang, J. F. Bu, C. J. Lin and G. L. Song, Prog. Org. Coat., 2012, 73, 129–141 CrossRef CAS.
- S. Wang, X. Guo, Y. Xie, L. Liu, H. Yang, R. Zhu, J. Gong, L. Peng and W. Ding, Surf. Coat. Technol., 2012, 213, 192–201 CrossRef CAS.
- J. Liu, B. Zheng, P. Wang, X. Wang, B. Zhang, Q. Shi, T. Xi, M. Chen and S. Guan, ACS Appl. Mater. Interfaces, 2016, 8, 17842–17858 CAS.
- V. Wagener, M. S. Killian, C. M. Turhan and S. Virtanen, Colloids Surf., B, 2013, 103, 586–594 CrossRef CAS PubMed.
- N. J. Ostrowski, B. Lee, A. Roy, M. Ramanathan and P. N. Kumta, J. Mater. Sci.: Mater. Med., 2013, 24, 85–96 CrossRef CAS PubMed.
- J. Song and W. Van Ooij, J. Adhes. Sci. Technol., 2003, 17, 2191–2221 CrossRef CAS.
- V. Subramanian and W. Van Ooij, Corrosion, 1998, 54, 204–215 CrossRef CAS.
- S. Kunjukunju, A. Roy, M. Ramanathan, B. Lee, J. E. Candiello and P. N. Kumta, Acta Biomater., 2013, 9, 8690–8703 CrossRef CAS PubMed.
- X. Liu, Z. Yue, T. Romeo, J. Weber, T. Scheuermann, S. Moulton and G. Wallace, Acta Biomater., 2013, 9, 8671–8677 CrossRef CAS PubMed.
- B. Homayun and A. Afshar, J. Alloys Compd., 2014, 607, 1–10 CrossRef CAS.
- N. Kirkland, N. Birbilis and M. Staiger, Acta Biomater., 2012, 8, 925–936 CrossRef CAS PubMed.
- K. Bobe, E. Willbold, I. Morgenthal, O. Andersen, T. Studnitzky, J. Nellesen, W. Tillmann, C. Vogt, K. Vano and F. Witte, Acta Biomater., 2013, 9, 8611–8623 CrossRef CAS PubMed.
- D. T. Chou, D. Hong, P. Saha, J. Ferrero, B. Lee, Z. Tan, Z. Dong and P. N. Kumta, Acta Biomater., 2013, 9, 8518–8533 CrossRef CAS PubMed.
- N. Majoul, S. Aouida and B. Bessaïs, Appl. Surf. Sci., 2015, 331, 388–391 CrossRef CAS.
- S. Minardi, L. Pandolfi, F. Taraballi, E. De Rosa, I. K. Yazdi, X. Liu, M. Ferrari and E. Tasciotti, ACS Appl. Mater. Interfaces, 2015, 7, 16364–16373 CAS.
- N. Ostrowski, B. Lee, N. Enick, B. Carlson, S. Kunjukunju, A. Roy and P. N. Kumta, Acta Biomater., 2013, 9, 8704–8713 CrossRef CAS PubMed.
- J. Gallardo, P. Galliano and A. Duran, J. Sol-Gel Sci. Technol., 2000, 19, 393–397 CrossRef CAS.
- R. Supplit, T. Koch and U. Schubert, Corros. Sci., 2007, 49, 3015–3023 CrossRef CAS.
- J. Li, P. Cao, X. Zhang, S. Zhang and Y. He, J. Mater. Sci., 2010, 45, 6038–6045 CrossRef CAS.
- Z. Jia, P. Xiong, Y. Shi, W. Zhou, Y. Cheng, Y. Zheng, T. Xi and S. Wei, J. Mater. Chem. B, 2016, 4, 2498–2511 RSC.
- A. Zomorodian, M. Garcia, T. M. e. Silva, J. Fernandes, M. Fernandes and M. Montemor, Mater. Sci. Eng., C, 2015, 48, 434–443 CrossRef CAS PubMed.
- N. Dinodi and A. N. Shetty, J. Magnesium Alloys, 2013, 1, 201–209 CrossRef CAS.
- A. King, N. Birbilis and J. Scully, Electrochim. Acta, 2014, 121, 394–406 CrossRef CAS.
- S. Gaur, R. S. Raman and A. Khanna, Mater. Sci. Eng., C, 2014, 42, 91–101 CrossRef CAS PubMed.
- Y. Xin, K. Huo, H. Tao, G. Tang and P. K. Chu, Acta Biomater., 2008, 4, 2008–2015 CrossRef CAS PubMed.
- A. Srinivasan, K. S. Shin and N. Rajendran, RSC Adv., 2016, 6, 49910–49922 RSC.
- D. Wang and G. P. Bierwagen, Prog. Org. Coat., 2009, 64, 327–338 CrossRef CAS.
- A. Khramov and J. Johnson, Prog. Org. Coat., 2009, 65, 381–385 CrossRef CAS.
- Z. Shi, M. Liu and A. Atrens, Corros. Sci., 2010, 52, 579–588 CrossRef CAS.
- S. Feliu and I. Llorente, Appl. Surf. Sci., 2015, 347, 736–746 CrossRef CAS.
- J. Y. Uan, B.-L. Yu and X.-L. Pan, Metall. Mater. Trans. A, 2008, 39, 3233–3245 CrossRef.
- S. N. Dezfuli, Z. Huan, J. Mol, M. Leeflang, J. Chang and J. Zhou, Prog. Nat. Sci.: Mater. Int., 2014, 24, 531–538 CrossRef.
- F. Witte, J. Fischer, J. Nellesen, H.-A. Crostack, V. Kaese, A. Pisch, F. Beckmann and H. Windhagen, Biomaterials, 2006, 27, 1013–1018 CrossRef CAS PubMed.
- F. Witte, V. Kaese, H. Haferkamp, E. Switzer, A. Meyer-Lindenberg, C. Wirth and H. Windhagen, Biomaterials, 2005, 26, 3557–3563 CrossRef CAS PubMed.
- D. Persaud-Sharma and A. McGoron, J. Biomimetics, Biomater., Tissue Eng., 2011, 12, 25–39 CrossRef CAS PubMed.
- J. Fischer, D. Pröfrock, N. Hort, R. Willumeit and F. Feyerabend, Mater. Sci. Eng., B, 2011, 176, 1773–1777 CrossRef CAS.
- M. Thomann, C. Krause, N. Angrisani, D. Bormann, T. Hassel, H. Windhagen and A. Meyer-Lindenberg, J. Biomed. Mater. Res., Part A, 2010, 93, 1609–1619 Search PubMed.
- Y. Takagishi, T. Kawakami, Y. Hara, M. Shinkai, T. Takezawa and T. Nagamune, Tissue Eng., 2006, 12, 927–937 CrossRef CAS PubMed.
Footnote |
| † Electronic supplementary information (ESI) available. See DOI: 10.1039/c6ra24382g |
| This journal is © The Royal Society of Chemistry 2016 |