Study of the influence of magnetic dilution over relaxation processes in a Zn/Dy single-ion magnet by correlation between luminescence and magnetism

Jérôme Long*a, Ekaterina Mamontovaa, Vania Freitasb, Dominique Luneauc, Veacheslav Vierud, Liviu F. Chibotarud, Rute A. S. Ferreirab, Gautier Félixa, Yannick Guaria, Luis D. Carlosb and Joulia Larionovaa
aInstitut Charles Gerhardt Montpellier, UMR 5253, Ingénierie Moléculaire et Nano-Objets, Université de Montpellier, ENSCM, CNRS, Place E. Bataillon, 34095 Montpellier Cedex 5, France. E-mail: jerome.long@umontpellier.fr
bPhysics Department and CICECO Aveiro – Institute of Materials, University of Aveiro, 3810-193, Aveiro, Portugal
cLaboratoire des Multimatériaux et Interfaces (UMR 5616), Université Claude Bernard Lyon 1, Campus de la Doua, 69622, Cedex Villeurbanne, France
dTheory of Nanomaterials Group and INPAC, Katholieke Universiteit Leuven, Celesijnenlaan, 200F, Heverlee, B-3001, Belgium

Received 28th September 2016 , Accepted 9th November 2016

First published on 9th November 2016


Abstract

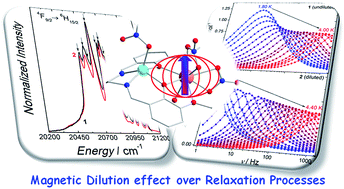
We investigate the magnetic dilution effect on the relaxation mechanisms and the estimation of the energy barrier in a photo-luminescent Dy(III)/Y(III) based Single-Ion Magnet (SIM). The photo-luminescent spectroscopy permits the careful determination of the Orbach barrier, which is in a good agreement with the ab initio calculations. This barrier does not change upon magnetic dilution. The magnetic properties investigations highlight that the determination of the energy barrier is affected by magnetic dilution due to the changes in Quantum Tunnelling of the Magnetization (QTM).


Introduction

Among magnetic molecular materials, Single-Ion Magnets (SIMs) or Single-Molecule Magnets (SMMs) appear to be promising compounds for future technological applications including data storage or quantum computing.1,2 Such coordination complexes present a magnetic bistability arising from the appearance of an anisotropic barrier, Δ, responsible for the reversal of the magnetization at low temperature. In the case of lanthanide based SIMs, the origin of such behaviour is clearly associated to the relative energies of the spectroscopic sub-levels of the lanthanide ion. Such features depend on the nature, the symmetry and geometry of the lanthanide ion. These two latter parameters can be imposed by a coordination environment including the donor strength of the ligands, which can stabilize the prolate or oblate character of the electronic density of the chosen lanthanide.3,4 Additionally, the occurrence of magnetic exchange interactions, hyperfine coupling or dipolar interactions between neighbours SIMs affect this property by enhancing the Quantum Tunnelling of the Magnetization (QTM).5 Transition between the degenerated ±mJ states in Kramers ions are forbidden by the Kramers theorem. However, the presence of a transverse dipolar field may enhance the QTM by splitting the ground state doublet allowing such transitions. Dilution in a diamagnetic matrix is known to be the easiest classical way to study the intrinsic features of SIMs by reducing dipolar interactions. Surprisingly, regardless the nature of the lanthanide ion, rather controversial effects on the relaxation process upon magnetic dilution has been reported in the literature. An increase of the energy barrier determined by magnetic measurements was frequently observed for diluted systems,6–10 while in some cases it has been found significantly decreased11 or nearly identical.12–17 In the vast majority of the reported studies, the spin-reversal barrier in SIMs has been evaluated considering solely a thermally activated process for which the thermal dependence of the relaxation time follows an Arrhenius law with τ = τ0[thin space (1/6-em)]exp(Δ/kT). However, deviations from this model are almost systematically observed and originate from the presence of others spin-lattice relaxation processes, such as Raman and direct relaxations and/or QTM especially at low temperature.16 Consequently, additional studies are required in order to better comprehend the influence of the magnetic dilution on these relaxations pathways and ultimately optimize the SIM features.

One possibility to achieve such objectives can be found in luminescent lanthanide SIMs since the careful examination of the optical transitions relative to the lanthanide ion allows to experimentally access to the mJ sub-levels structure. Such correlation between the luminescence and magnetism has been performed for several SIMs with various lanthanide ions to put in comparison the barrier (Δ) obtained from the magnetic measurements and/or theoretical calculations with the value of the energy gap between the ground state and the first excited state extracted from the luminescence data (ΔOrbach).18–26 In most cases, ΔOrbach obtained from luminescence is systematically higher than the one obtained from the magnetism, indicating that the extraction of the energy barrier using magnetic data gives underestimated values. In this article, we investigate the magnetic dilution effect on the evaluation of the energy barrier in bifunctional magneto – luminescent systems considering that optical spectroscopy appears as the ideal technique to directly probe the changes in the mJ sub-levels structure that may occur upon magnetic dilution. To perform such studies, we focus on a bifunctional dinuclear Schiff-base [Zn(NO3)LDy(NO3)2(H2O)] (H2L = N,N′-bis(3-methoxysalicylidene)-1,2-diaminoethane)18 as a model compound.

Results and discussion

Synthesis and crystal structure description

The complex [Zn(NO3)LDy(NO3)2(H2O)] (1) was synthesized according to the previously described procedure.18 The stoichiometric reaction between the complex [Zn(L)(H2O)] (H2L = N,N′-bis(3-methoxysalicylidene)-1,2-diaminoethane) and Dy(NO3)3·5H2O in acetonitrile yields crystals of 1 upon slow diffusion of diethyl ether. The diluted analogue 2 was obtained using a molar ratio mixture 5/95 of Dy(NO3)3·5H2O and Y(NO3)3·6H2O.

Compounds 1 and 2 are isostructural and crystallize in the P21/n space group (Table S1) with unique crystallographic Dy3+ (or Y3+) and Zn2+ sites. Their molecular structure can be described as a dinuclear complex with connection between Zn2+ and Dy3+ (or Y3+) being ensured by phenolate bridges (Fig. 1). The lanthanide ion adopts a nine-coordinated environment, the coordination sphere being composed by four oxygens from the ligand, two bidentate nitrate molecules and one water molecule. Intermolecular hydrogen bonds appear between the coordinated water and the nitrate molecules belonging to the adjacent complex, creating a supramolecular chain that propagates along the a crystallographic axis. The shortest intermolecular Dy–Dy distance is found to be 7.756 Å (Fig. 1). Analysis of the coordination sphere for 1 and 2 using the SHAPE software27 shows that the geometries are close, confirming that the Y3+/Dy3+ sites in 2 present a similar coordination environment with respect to the undiluted sample 1 (Table S2). Powder X-Ray Diffraction (PXRD) patterns (Fig. S1) ultimately confirm the isostructural character of 1 and 2 as well as the purity of the samples. Additionally, Energy Dispersive Spectroscopy (EDS) gives a doping rate of Dy = 7 ± 2% and confirms the homogeneous distribution of the samples.


image file: c6ra24115h-f1.tif
Fig. 1 Top: Molecular structure of complex 1. Color code: orange, Dy; light blue, Zn; red, O; blue N; grey, C. Middle: View of the supramolecular chain of 1 along the c crystallographic axis. Dashed bonds represent hydrogen bonds. Bottom: View of the packing arrangement of 1 along the a crystallographic axis.

Magnetic properties

Magnetic properties of 1. There are at least four different relaxation processes that could be find in SIM:16 (i) if enough thermal energy is available, the Orbach process involves absorption of a phonon followed by a phonon emission and relaxation from an excited state. In this case, the energy must be equal or larger to the energy gap between the ground state and the first excited state (ΔOrbach). This process should therefore only occur if ΔOrbach is lower than the maximum acoustic phonon energy D, ΘD being the Debye temperature of the material and k the Boltzmann constant. However, optical phonons, and multi-phonon processes can cause this relaxation to be operative even if the aforementioned condition is not fulfilled.28,29

Relaxation involving higher excited states have been recently evidenced and constitute one of the best strategy to obtain large energy barriers systems;9,30–33 (ii) the two-phonon Raman process involves the simultaneous absorption of a phonon with emission of a phonon of different energy from a virtual excited state. In contrast to Orbach process, the phonon spectrum is entirely available implying that such relaxation may occur even if the ΔOrbach/k is higher than ΘD. This relaxation is independent on the magnetic field but shows different temperature dependencies according to the magnetic ions nature; (iii) the direct process involves a relaxation from ±mJ levels with emission of one phonon. It relies on the magnetic field and shows a linear or quadratic dependencies with temperature; (iv) in contrast to the three previous cases of spin-lattice relaxation processes, the QTM does not involve any exchange of energy and arises from a transverse anisotropy component that promotes the relaxation between the degenerated ±mJ levels. Since these transitions are forbidden between Kramer's states, the QTM involves deviation from axial symmetry, hyperfine coupling inducing a mixing of the wavefunctions allowing these transitions. Additionally, the presence of dipolar interactions may create a transverse field that enhance this relaxation. Consequently systems showing a strong QTM exhibit a totally temperature independent relaxation time at low temperature.

Given that the preliminary magnetic properties of 1 were previously reported,18 we focus here on the additional alternative current (AC) measurements. In the absence of a static DC-field, no significant out-of-phase component, χ′′, is observed due to the fast QTM frequently observed in lanthanide SIMs. The frequency dependence of χ′′ at 1.8 K for 1 measured for various DC fields leads to the appearance of an out-of-phase component with the highest relaxation time found for a 900 Oe DC field (Fig. 2). For higher field values, a decrease of the relaxation time, τ, is observed. This fact can be directly ascribed to the occurrence of a direct relaxation process, which becomes predominant at high magnetic fields. Taking into account that at this low temperature, the Raman and Orbach processes can be neglected, the field dependence of the relaxation time can be reproduced using a simple model recently updated by Zadrozny et al.34 with

 
τ−1 = DH4T + B1/(1 + B2H2), (1)
for which the first term accounts for the direct process (for Kramers-ion), while the second one stands for the QTM. The fit parameters are summarized in Table S3. The antagonist effect of the QTM and direct processes gives birth to the maximum observed in the field dependence of τ. The B1 and B2 parameters directly reflect the degree of mixing between the ±mJ levels and give the information about the magnitude of the QTM process. The frequency dependence of the AC susceptibility under the optimum DC field of 900 Oe at different temperatures reveals a series of frequency dependent single peaks (Fig. 3). Their maxima shift toward higher temperature when the frequency increases, indicating the occurrence of a slow relaxation of the magnetisation. Δ can be estimated from the linear region using the thermally activated model, τ = τ0[thin space (1/6-em)]exp(Δ/kT) and gives the parameters τ0 = 3.55 × 10⁻⁸ s and Δ = 24 cm−1. Despite its pseudo-linear character, such fit most likely gathers different relaxation processes and a clear deviation from the linearity appears in the low temperature range (Fig. 4), reflecting the appearance of additional relaxation spin-lattice pathways, such as Raman or direct processes, which show various degree of temperature dependence. As it can be seen, the relaxation time does not become temperature independent confirming that applying a DC field has greatly suppressed the QTM. In order to estimate the contribution from Raman and direct processes and extracting a more accurate value of the energy barrier, fitting of the temperature dependence of the relaxation time was performed using the model recently updated by J. R. Long and coll. with the following equation:16
 
τ−1 = τ0−1[thin space (1/6-em)]exp(−Δ/kT) + CTm + ATn. (2)


image file: c6ra24115h-f2.tif
Fig. 2 Field dependence of the relaxation time at 1.8 K for 1 and 2. The blue solid and dashed lines correspond to the fit using eqn (1).

image file: c6ra24115h-f3.tif
Fig. 3 Frequency dependence of the out-of-phase susceptibility, χ′′, for 1 (top) and 2 (bottom) performed under a 900 and 600 Oe DC field respectively.

image file: c6ra24115h-f4.tif
Fig. 4 Temperature dependence of the relaxation time for 1 (900 Oe) and 2 (600 Oe). The blue solid lines represent the fit with eqn (2) while the red dashed line represents the expected Orbach process with the value extracted from photo-luminescence.

The first term accounts for an acoustic Orbach process, while the second and the third ones stand for two-phonon Raman and direct relaxations, respectively. Due to the minor role of the QTM under this DC field, its contribution has not been included in the fitting. The best fit parameters are obtained by fixing m = 5, 7, or 9 and n = 1 (usually found for direct process, although n = 2 can be found in the case of phonon bottleneck35). For Kramers ion, the expected m value should equal to 9 although lower values can be found in the presence of optical phonons.36 The Δ value using this fit is found to be 35 cm−1 with τ0 = 6.4 × 10⁻⁹ s and m = 9. The non-negligible values of the A and C parameters indicate contributions from both, Raman and direct processes (Table 1). Cole–Cole plots (χ′′ vs. χ′) gave well defined semi-circles (Fig. S2). Fitting with a Debye generalized model yields low value of the α parameter for the highest temperature (close to 0.1, Table S4) indicating a narrow distribution of the relaxation processes. Lowering the temperature induces an increase of the α parameter which can be explained by the overlap between the different spin-lattice relaxations.

Table 1 Fit parameters of the temperature dependence of the relaxation time obtained using eqn (2)
Compound Δ (cm−1) τ0 (s) CRaman (s−1 K−9) A (s−1 K−1)
1 (900 Oe) 35 ± 22 (6.4 ± 0.4) × 10−9 0.019 ± 0.004 48 ± 12
2 (600 Oe) 45 ± 3 (4.6 ± 0.5) × 10−11 0.009 ± 0.002 0


Magnetic properties of 2. The presence of dipole–dipole magnetic interactions is well known to affect the relaxation processes and, in particular, the QTM. In contrast with 1, a strong component of χ′′ can be observed in zero-DC field for 2, indicating that the QTM pathway is greatly reduced by dilution, but without a maximum in the available frequency range (Fig. S3). The field dependence of the relaxation time (Fig. 2) can be modelled in a similar way than for 1 and gives the parameters summarized in Table S3. The values of the D, B1 and B2 parameters directly reflect the relative weight of the direct and QTM processes, respectively. In contrast, the undiluted sample 1 presents higher values of the D and B1 parameters, while B2 is nearly similar, indicating that the magnetic dilution reduces the QTM.

The frequency dependence of χ′′ under an optimum DC field of 600 Oe also reveals a series of single frequency dependent peaks. The fit using eqn (2) yields τ0 = 4.6 × 10⁻¹¹ s and Δ = 45 cm−1 (Fig. 4, Table 1). In the latter case, the parameter A is close to zero confirming that the magnetic dilution might also affect the direct process as evidenced from the field dependence of τ. Such dependence of the direct process over the concentration of paramagnetic ions have also been observed in some SIMs.16 The Cole–Cole plots (Fig. 5) yields to well defined semi-circles and fitting with a Debye model gives α values of 0.413 at 1.8 K and then strongly decreases to 0.0002 at 4.3 K (Table S5). The low value of α in the high-temperature region indicates a narrow distribution of the relaxation times.


image file: c6ra24115h-f5.tif
Fig. 5 Cole–Cole (Argand) plot obtained using the ac susceptibility data (600 Oe) for 2. The solid lines correspond to the best fit obtained with a generalized Debye model.

Note that the frequency dependence of the AC susceptibilities were also measured under the same DC field of 900 Oe that was used for 1 (Fig. S4). The fit using eqn (2) of the temperature dependence of the relaxation time gives a very similar value of Δ in comparison to the 600 Oe data (Fig. S5 and Table S6). Consequently, the results obtained from the magnetism point out that: (i) the magnetic dilution clearly affects the QTM; (ii) different Δ values are obtained for 1 and 2, regardless the extraction method used (linear fit or fit using eqn (2)).

Ab initio calculations. In order to get additional insights into the relaxation processes, ab initio calculations were performed (Table S7), allowing the estimation of Δ as well as the values of the g tensor for each Kramers doublets. For 1, the first excited Kramers doublet is found to be 59 cm−1 above the Kramers ground state (Table S8).

This value is almost twice higher than the value obtained from the AC magnetic data for the undiluted sample confirming the occurrence of under-barriers relaxation processes. The large value of gz (18.4, Table S9) indicates that the Kramers ground-state is close to mJ = ±15/2. However, the non-negligible values of the transversal components of gx and gy point out the presence of a transverse anisotropy causing the QTM contribution. Consequently, the magnetic dilution reduces the QTM in some extent by suppressing dipolar interactions. However, the intrinsic transverse anisotropy component of the molecule still contributes to the QTM. This explains the absence of a maximum in the frequency dependence of the out-of-phase susceptibilities for 2 under a zero field. The use of the static DC field is therefore required to strongly reduce the QTM.

Spectroscopy

Photoluminescence. Aiming at correlating the magnetic and optical properties, solid-state photoluminescence measurements were carried out at room and low temperatures for diluted and undiluted samples. The photoluminescence features of 1 were previously reported.18 Here, we report for the first time the excited state decay curve at low temperature. In addition, the high-resolution steady-state emission spectrum is revisited to enable an easier accurate study of the effect of the dilution on the optical properties.

Fig. 6 compares the room and low-temperature emission spectra of 1 and 2. In contrast to that found previously for 1,18 the characteristic Dy3+ transitions are not observed at room temperature for 2. Decreasing the temperature to 14 K reveals the characteristic luminescence of the Dy3+ ions ascribed to the 4F9/26H15/2–11/2 transitions. The excitation spectrum of 2 was monitored within the 4F9/26H13/2 transition for both, 1 and 2 crystals (Fig. S6) showing a broad band centred at ca. 280 nm and a large plateau at higher wavelengths with an absorption edge around 400 nm ascribed to the ligand's excited states, resembling that of 1.18 The fact that the ligand-related bands dominate the excitation spectra monitored within the Dy3+ transitions, confirms the presence of the ligand-to-Dy3+ energy transfer at 14 K.


image file: c6ra24115h-f6.tif
Fig. 6 Emission spectra acquired at 300 K (red line) and at 14 K (black line) for 2 excited at 385 nm.

The low-temperature 4F9/2 emission decay curves were measured under direct excitation into the ligands excited levels (Fig. S7) for 1 and 2. The decay of 2 is well-described by a single-exponential function yielding a lifetime value of τ = 10.0 ± 0.4 × 10⁻⁹ s, whereas for 1 the lifetime lies beyond the detection limits of our experimental set-up (5 × 10⁻⁹ s).

The larger lifetime value found after dilution (for 2) suggests the presence of concentration quenching effects present in the undiluted sample 1. The presence of operative non-radiative energy transfer involving lanthanide ions is distance dependent.37 According to the crystallographic analysis, the average shortest Dy–Dy intermolecular distance is 7.756 Å. Thus, the electric multipolar mechanism dominates as the exchange one becomes irrelevant for ion–ion distances larger than 4 Å.37

Aiming at analysing the dilution effect on the emission spectra and getting further insights into the correlation between the SIM behaviour and luminescence properties, the crystal field splitting of the ground state of the Dy3+ ion in both samples was investigated. In particular, low temperature (14 K) high-resolution emission spectra involving transitions of the magnetic ground state 6H15/2 in the spectral region of the 6F9/26H15/2 transitions were acquired (Fig. 7A and B). The emission spectrum of 1 resembles to that which was previously reported,18 apart from minor variations in the relative intensity of the Stark components. The large number of Stark components (12 components marked with arrows in Fig. 7A) makes extremely difficult to fit unambiguously the 4F9/26H15/2 transitions (maximum splitting into 8 Stark levels, assuming that only the 4F9/2 low-energy component is populated), pointing out the presence of 4 transitions arising from “hot” bands involving the first excited Stark component of the 7F9/2 level. Therefore, we only analyse the high-energy region of the transition (20[thin space (1/6-em)]900–21[thin space (1/6-em)]200 cm−1) in order to estimate the energy difference between the ground level and the first Stark component. In such spectral interval, the emission spectra of 1 and 2 are well reproduced by 3 Stark components ascribed to transitions from the lowest 4F9/2 Stark sublevel to the two lowest Stark levels of the 6H15/2 multiplet (mJ = ±15/2 and 13/2). The third transition can be ascribed to an hot band arising from a transition from the first excited Stark sublevel of the emitting 4F9/2 state (located at ∼55 cm−1 above the low-energy 4F9/2 sublevel)18,26,38 to the corresponding ground Kramers doublet of the 6H15/2 multiplet (mJ = ±15/2), as illustrated in Fig. 7C and D for 1 and 2, respectively.


image file: c6ra24115h-f7.tif
Fig. 7 (A) High-resolution emission spectra (14 K) for 1 and 2 excited at 385 nm. (B) Magnification of the 4F9/26H15/2 transition in the 20[thin space (1/6-em)]900–21[thin space (1/6-em)]200 cm−1 region. (C and D) Multi-Gaussian function fit components arising from the first 4F9/2 Stark sublevel to the 6H15/2 multiplet in the energy interval 20[thin space (1/6-em)]900–21[thin space (1/6-em)]200 cm−1. The fits regular residual plots (R2 > 0.98) are shown at the bottom.

The energy gap between the ground and first excited Kramers doublet (6H15/2 multiplet) is ΔOrbach-1 = 48 ± 3 cm−1 (identical within the experimental error to the value previously reported, 44 ± 3 cm−1)18 and ΔOrbach-2 = 52 ± 3 cm−1 for 1 and 2, respectively. While the value of ΔOrbach-1 is higher than those deduced from the magnetism (35 cm−1), the value for ΔOrbach-2 is in a relatively good agreement with both, the values obtained from the magnetic data (45 cm−1) and from theoretical calculations (59 cm−1). As a result, by using the photoluminescence measurements we found nearly identical values for ΔOrbach (within the experimental error of 3 cm−1) for diluted and non-diluted samples which unambiguously correspond to the real energy gap between the ground (mJ = ±15/2) and first excited Kramers doublet (mJ = ±13/2). The good accordance of Δ (magnetism) and ΔOrbach (theoretical calculations and luminescence) points out that the Orbach process is dominant at high temperature in these compounds. However, since the magnetic data indicate significant differences in the Δ values between 1 and 2, this suggests that the extraction is somehow altered.

Vibrational spectroscopy. To get further insights, Raman spectroscopy was used to monitor the changes in the crystal-lattice vibrations. Note that Raman spectroscopy studies of coordination complexes based on lanthanides in the low energy modes are relatively scarce.39 As it can be seen in Fig. 8, Raman spectra for 1 and 2 are rather complex, precluding the assignment of individual peaks. For comparison, the crystal-lattice vibrations in lanthanide nitrate salts are observed only up to 250 cm−1.40 While the profile of the spectra of 1 and 2 remains identical confirming their isostructural character, the position of the peaks, especially in the low energy range, are clearly shifted towards higher wavenumbers in the case of 2. This indicates that the phonons are affected upon dilution in the diamagnetic yttrium matrix. Such fact could be reasonably ascribed to a change in the density between these two samples. Based on the densities obtained from single crystal X-ray diffraction, a decrease of about 10% upon going from 1 to 2 is observed.
image file: c6ra24115h-f8.tif
Fig. 8 Raman spectra for the undiluted 1 and diluted 2 compounds. Inset magnification.
Correlation. To study in detail the modifications of the spin-lattice relaxation processes, the fitting of the temperature dependence of the relaxation time was performed with eqn (2), by fixing the values of Δ with ΔOrbach (luminescence measurements) which represent the real energy difference between the ground and first excited Kramers doublets.

The values of ΔOrbach and Δ are close enough to consider the Orbach process as dominant at high temperature in contrast to others systems showing enhanced Raman or direct relaxation.41 Results from the fitting indicate that the values of the A and C parameters are close to the previously obtained values (Table 2). However, the error for the C parameter is greatly lowered. Attempts to let the m coefficient free yields to values close to 9. Due to the simplicity of the model used (approximation by Debye model), the obtained parameters may be taken with great care but might reflect the fact that spin-lattice relaxation processes are affected by the magnetic dilution through the modification of the phonon density of states in the crystal.

Table 2 Fit parameters of the temperature dependence of the relaxation time obtained using eqn (2). ΔOrbach have been fixed from the results of photo-luminescence
Compound ΔOrbach (cm−1) τ0 (s) CRaman (s−1 K−9) A (s−1 K−1)
1 (900 Oe) 48 (1.2 ± 0.6) × 10−10 0.0205 ± 0.0006 44 ± 8
2 (600 Oe) 52 (6.0 ± 0.2) × 10−12 0.0102 ± 0.0002 0


Since the unit cell volume change is only 1%, the density decrease could be mainly associated to the weight change between 1 and 2, which should lead to a modification of the vibrational Density Of State (DOS) which is in line with the Raman spectroscopy study. As a result, all the spin lattice relaxation processes are dependent of the material's vibrational DOS.36 The luminescence results directly point out that as expected, the chemical dilution has only a moderate influence on the values of ΔOrbach. The limited available frequency of ac magnetometry (<1500 Hz) induces that even for the highest temperature data points used to extract the relaxation time, the system does not follow a pure Orbach relaxation and overlap with others processes occur. Such fact may be particularly effective in our case taking into account the narrow range of temperature for which the slow relaxation is observed. Moreover the chemical dilution partially reduces the dipolar QTM by suppressing transverse dipolar field. The intrinsic QTM caused by a transverse anisotropy component is still operative and requires the use of a static DC field to be reduced.

Recently, an investigation of the influence of a magnetic dilution over the relaxation processes has been performed by mean of magnetic measurements spectroscopy in Zn/Dy Schiff base complexes,42 for which the Orbach barriers for all dilution ratios have been fixed from the magnetic results of the undiluted analogue. The obtained results show also a progressive decrease of the QTM and the Raman parameter as the dilution ratio increases.

Conclusions

In this article, we have investigated in details the magnetic and luminescence properties of two isostructural luminescent SIMs, [Zn(NO3)LDy(NO3)2(H2O)] (1) and [Zn(NO3)Dy0.07Y0.93(L)(NO3)2(H2O)] (2) in order to study the effect of the magnetic dilution over the different magnetic relaxation processes. The first point to note is that the emission lifetime is affected upon magnetic dilution. Namely, the lifetime value of the diluted sample is twice higher than the one of the undiluted compound. This fact is due to Dy3+–Dy3+ interactions that fasten the relaxation. Secondly, the luminescence data clearly indicate that the values of ΔOrbach are found nearly identical for both, diluted and non-diluted systems, confirming similar coordination environment of the dysprosium sites in both compounds.

On the other hand, magnetic properties analysis indicates an increase of the energy barrier upon dilution. The in-depth studies indicate that, as expected, the QTM is highly reduced upon dilution by suppressing the transverse magnetic field. Besides, the correlation between luminescence and magnetism shows that the high-temperature region for which the relaxation times are extracted by dynamic magnetic measurements does not correspond to a pure thermally activated regime, giving underestimated energy barrier's value. Performing ac magnetic measurements with higher frequencies or by pulsed-EPR would probably allow us to obtain comparable energy barriers between the luminescence and magnetism. As a result, considering solely the fit from the pseudo-linear region appears to be insufficient to correctly estimate the energy barrier and extreme care should be taken. It should be also emphasized that although dilution in a diamagnetic matrix appears as the most straightforward strategy to study the intrinsic behaviour of SIM, this may induce significant changes in the spin-lattice processes through variation of the crystal density. Further work is in progress to investigate such features.

Experimental

Synthesis of 1 and 2

All experiments were carried out under aerobic conditions. The lanthanide nitrate salts were purchased from Alfa Aesar. All the solvents in these experiments were analytical grade.

The ligand H2L (H2L = N,N′-bis(3-methoxysalicylidene)-1,2-diaminoethane) has been synthesized according to a well-established procedure from the literature.43 The [ZnL(H2O)] complex has been synthesized by refluxing Zn(OAc)2·2H2O with H2L in ethanol according to the procedure from the literature.44

Synthesis of [Zn(NO3)Dy(L)(NO3)2(H2O)] (1). The stoichiometric reaction between [ZnL(H2O)] (1.0 mmol g) and Dy(NO3)3·5H2O (1 mmol) in 20 mL of acetonitrile gives a clear yellow solution upon heating. Slow diffusion of diethyl-ether yields to the formation of yellow crystals. Yield = 68%. Elemental analysis calcd for ZnDyC18H20N5O14 (exp.): C 28.51 (28.42), H 2.66 (2.86), N 9.23 (9.20).
Synthesis of [Zn(NO3)Dy0.07Y0.93(L)(NO3)2(H2O)] (2). The stoichiometric reaction between [ZnL(H2O)] (1.0 mmol), Dy(NO3)3·5H2O (0.05 mmol) and Y(NO3)3·6H2O (0.95 mmol) in 20 mL of acetonitrile gives a clear yellow solution upon heating. Slow diffusion of diethyl-ether yields to the formation of yellow crystals. Yield = 54%. Elemental analysis calcd for ZnDy0.07Y0.93C18H20N5O14 (exp.): C 31.34 (30.97), H 2.92 (2.55), N 10.15 (10.05). The ratio Dy/Y was estimated using the ratio of the magnetization values at 70 kOe and is in good agreement with EDS analysis.

Single-crystal X-ray diffraction study for 2

Single crystals of 2 was selected and on a Xcalibur, Onyx diffractometer. The crystal was kept at 300 K during data collection. Using Olex2,45 the structure was solved with the Superflip46 structure solution program using charge flipping and refined with the olex2.refine47 refinement package using Gauss–Newton minimisation.

Crystal data for C18H18YN2O14Zn (M = 691.16 g mol−1): monoclinic, space group P21/n (no. 14), a = 7.8023(3) Å, b = 19.2183(8) Å, c = 16.1293(6) Å, β = 91.994(4)°, V = 2417.07(16) Å3, Z = 4, T = 300 K, μ(Mo Kα) = 3.643 mm−1, Dcalc = 1.8962 g cm−3, 14[thin space (1/6-em)]130 reflections measured (5.48° ≤ 2Θ ≤ 58.62°), 5697 unique (Rint = 0.0263, Rsigma = 0.0351) which were used in all calculations. The final R1 was 0.0334 (I ≥ 2u(I)) and wR2 was 0.0828 (all data).

Magnetic measurements

Magnetic susceptibility data were collected with a Quantum Design MPMS-XL SQUID magnetometer working between 1.8–350 K with the magnetic field up to 7 tesla. The sample was prepared in a glove box. The data were corrected for the sample holder and the diamagnetic contributions calculated from Pascal's constants.

Computational details

All calculations were carried out with MOLCAS 7.8 and are of CASSCF/RASSI/SINGLE_ANISO type.48,49

The Dy centre was calculated keeping the entire molecule, i.e. without cutting any atoms. The geometry was optimized at the B3LYP level of theory using ORCA 2.9.0 program.50 TZVP basis set was used for Dy atom and SVP for the rest. Scalar relativistic effects were taken into account within 0th order regular approximation (ZORA)51 methodology as implemented in ORCA.

Two basis set approximations have been employed: 1 – small, and 2 – large. Table S1 shows the contractions of the employed basis sets for all elements.

Active space of the CASSCF method included 9 electrons in 7 orbitals (4f orbitals of Dy3+ ion). We have mixed 21 sextets, 128 quartet and 130 doublet states by spin–orbit coupling. On the basis of the resulting spin–orbital multiplets SINGLE_ANISO program computed local magnetic properties (g-tensors, magnetic axes, local magnetic susceptibility, etc.).

Photoluminescence measurements

The photoluminescence spectra were recorded at 12 K and at 300 K with a modular double grating excitation spectrofluorimeter with a TRIAX 320 emission monochromator (Fluorolog-3, Horiba Scientific) coupled to a R928 Hamamatsu photomultiplier, using a front face acquisition mode. The excitation source was a 450 W Xe arc lamp. The emission spectra were corrected for detection and optical spectral response of the spectrofluorimeter and the excitation spectra were corrected for the spectral distribution of the lamp intensity using a photodiode reference detector. The emission decay curves were acquired with the same instrumentation coupled to a TBX-04 photomultiplier tube module (950 V). The excitation source was a Horiba-Jobin-Yvon pulsed diode (NanoLED-390, peak at 388 ± 10 nm, FWHM of 14 nm, 1.2 ns pulse duration, 1 MHz repetition rate, and 150 ns synchronization delay).

Acknowledgements

The authors thank the University of Montpellier, CNRS and PAC Balard ICGM. E. M. acknowledges the financial support from the LABEX CheMISyst ANR-10-LABX-05-01. This work is partially developed in the scope of the projects CICECO – Aveiro Institute of Materials (UID/CTM/50011/2013) financed by national funds through the Fundação para a Ciência e a Tecnologia/Ministério da Educação e Ciência (FCT/MEC) and when applicable co-financed by FEDER under the PT2020 Partnership Agreement. The Portugal-France bilateral action, Programa PESSOA (Hubert Curien) “Multifunctional magneto-luminescent molecular architectures” is also acknowledged. V. V. is a postdoc and gratefully acknowledges the financial support from the Flemish Science Foundation (FWO).

Notes and references

  1. J. Luzon and R. Sessoli, Dalton Trans., 2012, 41, 13556 RSC.
  2. D. N. Woodruff, R. E. P. Winpenny and R. A. Layfield, Chem. Rev., 2013, 113, 5110 CrossRef CAS PubMed.
  3. J. D. Rinehart and J. R. Long, Chem. Sci., 2011, 2, 2078 RSC.
  4. L. Ungur and L. F. Chibotaru, Inorg. Chem., 2016, 55, 10043 CrossRef CAS PubMed.
  5. F. Pointillart, K. Bernot, S. Golhen, B. Le Guennic, T. Guizouarn, L. Ouahab and O. Cador, Angew. Chem., Int. Ed., 2015, 54, 1504 CrossRef CAS PubMed.
  6. K. R. Meihaus, J. D. Rinehart and J. R. Long, Inorg. Chem., 2011, 50, 8484 CrossRef CAS PubMed.
  7. Y. Bi, Y.-N. Guo, L. Zhao, Y. Guo, S.-Y. Lin, S.-D. Jiang, J. Tang, B.-W. Wang and S. Gao, Chem.–Eur. J., 2011, 17, 12476 CrossRef CAS PubMed.
  8. W.-B. Sun, B. Yan, Y.-Q. Zhang, B.-W. Wang, Z.-M. Wang, J.-H. Jia and S. Gao, Inorg. Chem. Front., 2014, 1, 503 RSC.
  9. Y.-N. Guo, L. Ungur, G. E. Granroth, A. K. Powell, C. Wu, S. E. Nagler, J. Tang, L. F. Chibotaru and D. Cui, Sci. Rep., 2014, 4, 5471 CAS.
  10. C. Das, A. Upadhyay, S. Vaidya, S. K. Singh, G. Rajaraman and M. Shanmugam, Chem. Commun., 2015, 51, 6137 RSC.
  11. A. J. Brown, D. Pinkowicz, M. R. Saber and K. R. Dunbar, Angew. Chem., Int. Ed., 2015, 54, 5864 CrossRef CAS PubMed.
  12. N. Ishikawa, M. Sugita, T. Ishikawa, S.-y. Koshihara and Y. Kaizu, J. Phys. Chem. B, 2004, 108, 11265 CrossRef CAS.
  13. S.-D. Jiang, B.-W. Wang, G. Su, Z.-M. Wang and S. Gao, Angew. Chem., Int. Ed., 2010, 49, 7448 CrossRef CAS PubMed.
  14. K. R. Meihaus and J. R. Long, J. Am. Chem. Soc., 2013, 135, 17952 CrossRef CAS PubMed.
  15. G. Cosquer, F. Pointillart, S. Golhen, O. Cador and L. Ouahab, Chem.–Eur. J., 2013, 19, 7895 CrossRef CAS PubMed.
  16. K. R. Meihaus, S. G. Minasian, W. W. Lukens, S. A. Kozimor, D. K. Shuh, T. Tyliszczak and J. R. Long, J. Am. Chem. Soc., 2014, 136, 6056 CrossRef CAS PubMed.
  17. W.-B. Sun, P.-F. Yan, S.-D. Jiang, B.-W. Wang, Y.-Q. Zhang, H.-F. Li, P. Chen, Z.-M. Wang and S. Gao, Chem. Sci., 2016, 7, 684 RSC.
  18. J. Long, R. Vallat, R. A. S. Ferreira, L. D. Carlos, F. A. Almeida Paz, Y. Guari and J. Larionova, Chem. Commun., 2012, 48, 9974 RSC.
  19. J. Long, J. Rouquette, J.-M. Thibaud, R. A. S. Ferreira, L. D. Carlos, B. Donnadieu, V. Vieru, L. F. Chibotaru, L. Konczewicz, J. Haines, Y. Guari and J. Larionova, Angew. Chem., Int. Ed., 2015, 54, 2236 CrossRef CAS PubMed.
  20. G. Cucinotta, M. Perfetti, J. Luzon, M. Etienne, P.-E. Car, A. Caneschi, G. Calvez, K. Bernot and R. Sessoli, Angew. Chem., Int. Ed., 2012, 51, 1606 CrossRef CAS PubMed.
  21. F. Pointillart, B. Le Guennic, S. Golhen, O. Cador, O. Maury and L. Ouahab, Chem. Commun., 2013, 49, 615 RSC.
  22. K. Yamashita, R. Miyazaki, Y. Kataoka, T. Nakanishi, Y. Hasegawa, M. Nakano, T. Yamamura and T. Kajiwara, Dalton Trans., 2013, 42, 1987 RSC.
  23. S. Shintoyo, K. Murakami, T. Fujinami, N. Matsumoto, N. Mochida, T. Ishida, Y. Sunatsuki, M. Watanabe, M. Tsuchimoto, J. Mrozinski, C. Coletti and N. Re, Inorg. Chem., 2014, 53, 10359 CrossRef CAS PubMed.
  24. Y. Rechkemmer, J. E. Fischer, R. Marx, M. Dörfel, P. Neugebauer, S. Horvath, M. Gysler, T. Brock-Nannestad, W. Frey, M. F. Reid and J. van Slageren, JACS, 2015, 137, 13114 CrossRef CAS PubMed.
  25. M. A. Palacios, S. Titos-Padilla, J. Ruiz, J. M. Herrera, S. J. A. Pope, E. K. Brechin and E. Colacio, Inorg. Chem., 2014, 53, 1465 CrossRef CAS PubMed.
  26. E. L. Gavey, M. Al Hareri, J. Regier, L. D. Carlos, R. A. S. Ferreira, F. S. Razavi, J. M. Rawson and M. Pilkington, J. Mater. Chem. C, 2015, 3, 7738 RSC.
  27. D. Casanova, M. Llunell, P. Alemany and S. Alvarez, Chem.–Eur. J., 2005, 11, 1479 CrossRef CAS PubMed.
  28. C.-Y. Huang, Phys. Rev., 1967, 154, 215 CrossRef CAS.
  29. S. T. Liddle and J. van Slageren, Chem. Soc. Rev., 2015, 44, 6655 RSC.
  30. R. J. Blagg, L. Ungur, F. Tuna, J. Speak, P. Comar, D. Collison, W. Wernsdorfer, E. J. L. McInnes, L. F. Chibotaru and R. E. P. Winpenny, Nat. Chem., 2013, 5, 673 CrossRef CAS PubMed.
  31. I. Oyarzabal, J. Ruiz, E. Ruiz, D. Aravena, J. M. Seco and E. Colacio, Chem. Commun., 2015, 51, 12353 RSC.
  32. M. Gregson, N. F. Chilton, A.-M. Ariciu, F. Tuna, I. F. Crowe, W. Lewis, A. J. Blake, D. Collison, E. J. L. McInnes, R. E. P. Winpenny and S. T. Liddle, Chem. Sci., 2016, 7, 155 RSC.
  33. J. Liu, Y.-C. Chen, J.-L. Liu, V. Vieru, L. Ungur, J.-H. Jia, L. F. Chibotaru, Y. Lan, W. Wernsdorfer, S. Gao, X.-M. Chen and M.-L. Tong, J. Am. Chem. Soc., 2016, 138, 5441 CrossRef CAS PubMed.
  34. J. M. Zadrozny, M. Atanasov, A. M. Bryan, C.-Y. Lin, B. D. Rekken, P. P. Power, F. Neese and J. R. Long, Chem. Sci., 2013, 4, 125 RSC.
  35. P. L. Scott and C. D. Jeffries, Phys. Rev., 1962, 127, 32 CrossRef CAS.
  36. K. N. Shrivastava, Phys. Status Solidi B, 1983, 117, 437 CrossRef CAS.
  37. O. L. Malta, J. Non-Cryst. Solids, 2008, 354, 4770 CrossRef CAS.
  38. M. Ren, S.-S. Bao, R. A. S. Ferreira, L.-M. Zheng and L. D. Carlos, Chem. Commun., 2014, 50, 7621 RSC.
  39. S. Petit, F. Baril-Robert, G. Pilet, C. Reber and D. Luneau, Dalton Trans., 2009, 6809,  10.1039/b822883c.
  40. J.-C. G. Bünzli, E. Moret and J.-R. Yersin, Helv. Chim. Acta, 1978, 61, 762 CrossRef.
  41. K. S. Pedersen, J. Dreiser, H. Weihe, R. Sibille, H. V. Johannesen, M. A. Sørensen, B. E. Nielsen, M. Sigrist, H. Mutka, S. Rols, J. Bendix and S. Piligkos, Inorg. Chem., 2015, 54, 7600 CrossRef CAS PubMed.
  42. A. Amjad, A. M. Madalan, M. Andruh, A. Caneschi and L. Sorace, Chem.–Eur. J., 2016, 22, 12849 CrossRef CAS PubMed.
  43. X. Lu, W. Bi, W. Chai, J. Song, J. Meng, W.-Y. Wong, W.-K. Wong and R. A. Jones, New J. Chem., 2008, 32, 127 RSC.
  44. W.-K. Lo, W.-K. Wong, W.-Y. Wong, J. Guo, K.-T. Yeung, Y.-K. Cheng, X. Yang and R. A. Jones, Inorg. Chem., 2006, 45, 9315 CrossRef CAS PubMed.
  45. O. V. Dolomanov, L. J. Bourhis, R. J. Gildea, J. A. K. Howard and H. Puschmann, J. Appl. Crystallogr., 2009, 42, 339 CrossRef CAS.
  46. L. Palatinus, S. J. Prathapa and S. van Smaalen, J. Appl. Crystallogr., 2012, 45, 575 CrossRef CAS.
  47. L. J. Bourhis, O. V. Dolomanov, R. J. Gildea, J. A. Howard and H. Puschmann, Acta Crystallogr., Sect. A: Found. Adv., 2015, 71, 59 CrossRef CAS PubMed.
  48. L. F. Chibotaru and L. Ungur, J. Chem. Phys., 2012, 137, 064112 CrossRef CAS PubMed.
  49. F. Aquilante, J. Autschbach, R. K. Carlson, L. F. Chibotaru, M. G. Delcey, L. De Vico, I. Fdez. Galván, N. Ferré, L. M. Frutos, L. Gagliardi, M. Garavelli, A. Giussani, C. E. Hoyer, G. Li Manni, H. Lischka, D. Ma, P. Å. Malmqvist, T. Müller, A. Nenov, M. Olivucci, T. B. Pedersen, D. Peng, F. Plasser, B. Pritchard, M. Reiher, I. Rivalta, I. Schapiro, J. Segarra-Martí, M. Stenrup, D. G. Truhlar, L. Ungur, A. Valentini, S. Vancoillie, V. Veryazov, V. P. Vysotskiy, O. Weingart, F. Zapata and R. Lindh, J. Comput. Chem., 2016, 37, 506 CrossRef CAS PubMed.
  50. F. Neese, Wiley Interdiscip. Rev.: Comput. Mol. Sci., 2012, 2, 73 CrossRef CAS.
  51. E. v. Lenthe, E. J. Baerends and J. G. Snijders, J. Chem. Phys., 1993, 99, 4597 CrossRef.

Footnote

Electronic supplementary information (ESI) available: Additional crystallographic magnetic characterizations and theoretical calculations. CCDC 1507037. For ESI and crystallographic data in CIF or other electronic format see DOI: 10.1039/c6ra24115h

This journal is © The Royal Society of Chemistry 2016